Article Text

Abstract
Understanding the geographical distribution of COVID-19 through the general population is key to the provision of adequate healthcare services. Using self-reported data from 1 960 242 unique users in Great Britain (GB) of the COVID-19 Symptom Study app, we estimated that, concurrent to the GB government sanctioning lockdown, COVID-19 was distributed across GB, with evidence of ‘urban hotspots’. We found a geo-social gradient associated with predicted disease prevalence suggesting urban areas and areas of higher deprivation are most affected. Our results demonstrate use of self-reported symptoms data to provide focus on geographical areas with identified risk factors.
- clinical epidemiology
- infection control
This is an open access article distributed in accordance with the Creative Commons Attribution 4.0 Unported (CC BY 4.0) license, which permits others to copy, redistribute, remix, transform and build upon this work for any purpose, provided the original work is properly cited, a link to the licence is given, and indication of whether changes were made. See: https://creativecommons.org/licenses/by/4.0/.
Statistics from Altmetric.com
The COVID-19 epidemic has led to large-scale closures and lockdown measures worldwide with the British government sanctioning lockdown from 23 March 2020 (https://www.gov.uk/government/speeches/pm-address-to-the-nation-on-coronavirus-23-march-2020).
Early in the pandemic, case distribution was not evenly spread across countries, with dense urban centres being the most affected.1 Individuals in deprived areas have lower life expectancy,2 are more likely to have multiple underlying comorbidities, have a higher level of influenza-associated hospitalisation3 and therefore could be more susceptible to COVID-19.2
Based on the known socioeconomic health gradient, we hypothesised that individuals in deprived areas were at greater risk of contracting COVID-19. Understanding the geographical distribution of the virus in a socioeconomic context is key to assist adequate healthcare resourcing, particularly intensive care beds.4
Here we investigated the geographical distribution of COVID-19 in Great Britain (GB) and its association with area-level deprivation using self-reported data from almost 2 million users of the COVID-19 Symptom Study. 5
We studied 1 960 242 unique GB app users (20–69 years old) reporting on COVID-19 symptoms, hospitalisation, reverse-transcription PCR (RT-PCR) test outcomes, demographic information and pre-existing medical conditions (online supplemental methods) over 23 days (29 March–19 April) of major social distancing measures (‘lockdown’). We computed a proxy of contracting COVID-19, based on reported symptoms6 (positive predicted value=0.69 (0.66; 0.71) (online supplemental methods). We then calculated a predicted prevalence as the proportion of app users that we predicted to have COVID-19 within each area (online supplementary figure S1).
Supplemental material
Supplemental material
Following aggregation of variables to local authority district level (LAD/geographic unit representing ~17 000 individuals), we tested the geographical distribution of predicted prevalence at eight different time points spanning 23 days. We used Local Moran’s I tests, which assess for non-random spatial distribution and clustering of a feature and can be used to identify disease hotspots and cold spots relative to the mean GB predicted prevalence7 (online supplemental methods).
Next, we used data from the eight different time points and used multivariable mixed-effects models to investigate the association of predicted area-level prevalence (at middle super output area level (MSOA)) and deprivation (as captured by the Index of Multiple Deprivatio) adjusting for different factors including geo-social mediators and confounders (air pollution, general practitioners per MSOA, household density and urbanicity) area level aggregates of obesity and comorbidities) and area-level adjusted mean age and sex and spatial autocorrelations8 (online supplemental methods).
table table 1 1 and online supplemental table S1. The number of predicted COVID-19 positive individuals ranged between 15 991 and 79 378.
Supplemental material
Demographic characteristics of the study population at eight time points
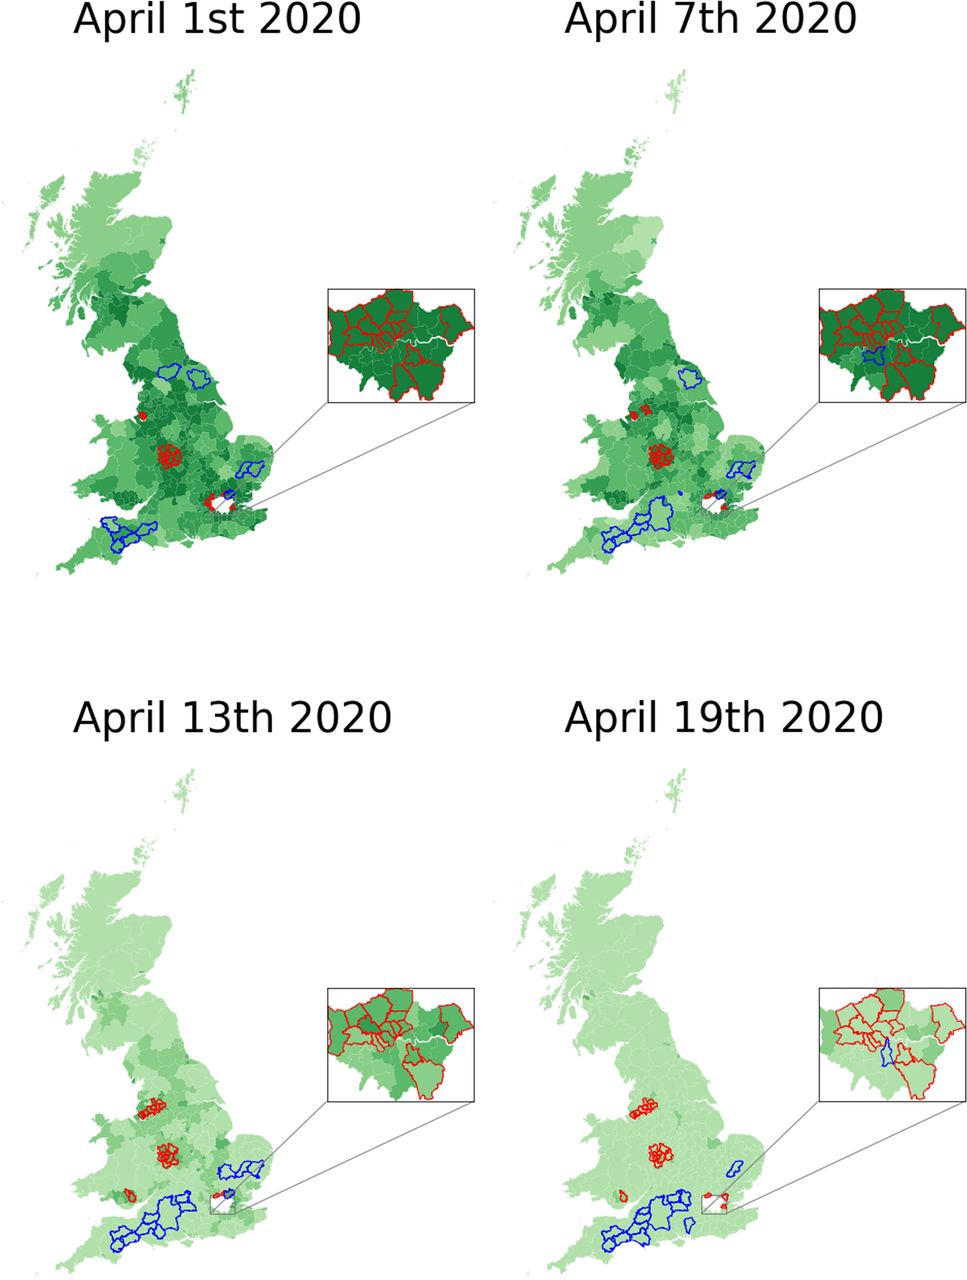
Local Moran’s I showed that predicted COVID-19 prevalence clustered in urban areas across GB when considered as a proportion of the population per LAD7 (figure 1 and online supplemental figure S2) adjusting for multiple testing. Predicted prevalence decreased over time, consistent with ‘lockdown’ (figure 1 and online supplemental figure S2) (pairwise Wilcoxon rank-sum tests, prevalence: all time points except T2:T3 and T1:T4, p<0.001), but some hotspots remained.
Supplemental material
Geographical distribution of predicted COVID-19 prevalence across four time points. Prevalence is presented as proportional to the responders per local authority district (LAD). Analyses are adjusted for multiple testing using Benjamini- Hochberg false discovery rate correction (p<0.05). Inset highlights London where LAD areas are smaller. Hot and cold spots are defined relatively to their neighbours and the mean GB predicted prevalence. Red/blue coloured perimeter lines around each LAD denote hotspot/coldspot.
In the MSOA-level analysis, area-level deprivation was significantly associated with predicted area-level prevalence in all models (M1–M6, see online supplemental table S2), including in the full model (M6) when adjusting for all geo-social covariates and comorbidities (M6: Beta (95% CI)=−0.15 (−0.17 to –0.130, p<0.001). This suggests that people in deprived areas were at higher risk.
Predicted COVID-19 prevalence was higher in urban areas compared with rural and in more deprived areas compared with less deprived. This could reflect the likelihood of individuals in more deprived areas working/living with people whose vocations mean they are unable to work from home and are thus more likely to be exposed to circulating COVID-19. Accumulation of socioenvironmental exposures across the life course are known to contribute to a greater health deficit and disease burden2; our results suggest that COVID-19 is no exception.
Moreover, our study illustrates how app data could be used to successfully monitor COVID-19 over time and identify hotspots as the viral pandemic progresses and social distancing measures are implemented or eased. Using this method, we detected a geo-social gradient associated with prevalence in the context of COVID-19, suggesting the focus of resources should be on deprived urban areas.
Our study has some limitations and assumptions. We used self-reported data on symptoms that can lead to bias. For example, should users in deprived areas report more symptoms due to a facet of the socioeconomic environment (eg, higher air pollution), this could lead to an incorrectly higher predicted prevalence in deprived areas. Second, app users are a self-selected group, not representative of the general population. Our approach to adjust for age and sex differences at MSOA level is unlikely to sufficiently overcome selection and collider bias.9 Third, our predicted COVID-19 prevalence is not from confirmed tests via RT-PCR, but rather based on self-reported symptoms. Additionally, we assume that people who have symptoms or have been exposed to COVID-19 are equally likely to use the app as those who do not. We performed a sensitivity analysis by rerunning the pooled analysis on individuals who were self-reportedly healthy at sign up and found the observed associations remained (online supplemental table S3), suggesting selection bias associated with being unhealthy at sign up is not influencing the observed associations of COVID-19 and deprivation. We also assume that people report symptoms in the same way and that their drop-out patterns do not differ by space, time and symptom reports. Finally, we aggregated data at MSOA level that could lead to ecological bias. We also cannot conclude that deprivation increased COVID-19 prevalence, as there could be unmeasured confounders or other factors.
Future work should check our assumptions and seek to integrate these data with data on area-level morbidity, extended pollution data, ethnicity and disease severity. Indeed, higher mortality has been observed among minority ethnic groups,10 and disentangling the environmental and biological factors contributing to greater disease burden in both deprived areas and among ethnic minorities is an essential focus of future work to ensure resources and intervention are better assigned.
Ethics statements
Ethics approval
The Ethics for the app has been approved by King’s College London ethics Committee (REMAS ID 18210, review reference LRS-19/20-18210), and all users provided consent for non-commercial use. An informal consultation with TwinsUK members over email and social media prior to the app having been launched found that they were overwhelmingly supportive of the project.
Acknowledgments
We express our sincere thanks to all the participants of the COVID Symptom Study app. We would like to thank the staff of Zoe Global Limited, the Department of Twin Research for their tireless work in contributing to the running of the study and data collection. Finally, we would like to thank Professor Kate Tilling of the University of Bristol for her invaluable insight and help in refining the manuscript.
Supplementary materials
Supplementary Data
This web only file has been produced by the BMJ Publishing Group from an electronic file supplied by the author(s) and has not been edited for content.
Footnotes
Twitter @mjorgecardoso
RCEB and TV contributed equally.
CJS and CM contributed equally.
Contributors Conceived and designed the experiments: CJS, TDS, SO and CM; analysed the data: RCB and TV. Contributed reagents/materials/analysis tools: MF, CHS, BM, MF, DY, SG, JC, ET, EB, MJC, RD and JW wrote the manuscript: RCB, TV and CM; revised the manuscript: all.
Funding Zoe provided in kind support for all aspects of building, running and supporting the app and service to all users worldwide. The Department of Twin Research is funded by the Wellcome Trust, Medical Research Council, European Union, Chronic Disease Research Foundation (CDRF), Zoe Global Ltd and the National Institute for Health Research (NIHR)-funded BioResource, Clinical Research Facility and Biomedical Research Centre based at Guy’s and St Thomas’ NHS Foundation Trust in partnership with King’s College London. CM is funded by the Chronic Disease Research Foundation and by the MRC Aim-Hy project grant. CHS is an Alzheimer’s Society Junior Fellowship AS-JF-17-011; SO and MJC are funded by the Wellcome/EPSRC Centre for Medical Engineering (WT203148/Z/16/Z), Wellcome Flagship Programme (WT213038/Z/18/Z).
Map disclaimer The depiction of boundaries on this map does not imply the expression of any opinion whatsoever on the part of BMJ (or any member of its group) concerning the legal status of any country, territory, jurisdiction or area or of its authorities. This map is provided without any warranty of any kind, either express or implied.
Competing interests TDS is a consultant to Zoe Global Ltd ('Zoe'). SG, JC, EB, RD and JW are or have been employees of Zoe Global Limited. Other authors have no conflict of interest to declare.
Provenance and peer review Not commissioned; externally peer reviewed.