Article Text

Abstract
Introduction Low-dose CT (LDCT) screening of high-risk smokers reduces lung cancer (LC) specific mortality. Determining screening eligibility using individualised risk may improve screening effectiveness and reduce harm. Here, we compare the performance of two risk prediction models (PLCOM2012 and Liverpool Lung Project model (LLPv2)) and National Lung Screening Trial (NLST) eligibility criteria in a community-based screening programme.
Methods Ever-smokers aged 55–74, from deprived areas of Manchester, were invited to a Lung Health Check (LHC). Individuals at higher risk (PLCOM2012 score ≥1.51%) were offered annual LDCT screening over two rounds. LLPv2 score was calculated but not used for screening selection; ≥2.5% and ≥5% thresholds were used for analysis.
Results PLCOM2012 ≥1.51% selected 56% (n=1429) of LHC attendees for screening. LLPv2 ≥2.5% also selected 56% (n=1430) whereas NLST (47%, n=1188) and LLPv2 ≥5% (33%, n=826) selected fewer. Over two screening rounds 62 individuals were diagnosed with LC; representing 87% (n=62/71) of 6-year incidence predicted by mean PLCOM2012 score (5.0%). 26% (n=16/62) of individuals with LC were not eligible for screening using LLPv2 ≥5%, 18% (n=11/62) with NLST criteria and 7% (n=5/62) with LLPv2 ≥2.5%. NLST eligible Manchester attendees had 2.5 times the LC detection rate than NLST participants after two annual screens (≈4.3% (n=51/1188) vs 1.7% (n=438/26 309); p<0.0001). Adverse measures of health, including airflow obstruction, respiratory symptoms and cardiovascular disease, were positively correlated with LC risk. Coronary artery calcification was predictive of LC (adjOR 2.50, 95% CI 1.11 to 5.64; p=0.028).
Conclusion Prospective comparisons of risk prediction tools are required to optimise screening selection in different settings. The PLCOM2012 model may underestimate risk in deprived UK populations; further research focused on model calibration is required.
- lung cancer
This is an open access article distributed in accordance with the Creative Commons Attribution Non Commercial (CC BY-NC 4.0) license, which permits others to distribute, remix, adapt, build upon this work non-commercially, and license their derivative works on different terms, provided the original work is properly cited, appropriate credit is given, any changes made indicated, and the use is non-commercial. See: http://creativecommons.org/licenses/by-nc/4.0/.
Statistics from Altmetric.com
Key messages
What is the key question?
How well do different risk prediction models perform in selecting a cohort for lung cancer screening in a deprived population?
What is bottom line?
There is significant variation in numbers selected for screening and cancer detection rate according to risk prediction model and population screened; prospective analysis is required to determine the best model and threshold for screening selection.
Why read on?
Our findings have direct relevance for screening implementation within the UK, as the risk models analysed (Liverpool Lung Project model and PLCOM2012) are being used for screening selection in the National Health Service England Targeted Lung Health Check programme.
Introduction
Lung cancer causes 1.6 million deaths each year, representing 20% of total cancer mortality worldwide.1 Survival is poor in both developed and low/middle-income countries.2 3 Poor survival is driven by late clinical presentation which is primarily a consequence of early-stage lung cancer having no or only mild non-specific symptoms.4 In the UK, half of all patients have stage IV disease at diagnosis and one-third present as an emergency, at which point outcomes are particularly poor.5 6 The National Lung Screening Trial (NLST) demonstrated that low-dose CT (LDCT) screening of high-risk smokers detects early-stage tumours and reduces lung cancer-specific mortality by 20%.7 This finding has recently been confirmed by the NELSON trial, which showed a 24% reduction in lung cancer-specific mortality in men and 33% reduction in women with LDCT screening after 10 years of follow-up.8 The MILD study also demonstrated a 39% reduction in lung cancer-specific mortality over 10 years with LDCT screening.9 Selection for these studies was based on age and a specific threshold of smoking exposure; in NLST, participants had a minimum of 30 pack-years and had smoked within 15 years of trial entry. Retrospective modelling of the NLST population demonstrated that the benefits and harms of screening varied according to lung cancer risk. Very few deaths were prevented among those in the lowest risk quintile but screening related harms still occurred.10 More precise targeting of screening, based on individual lung cancer risk, is proposed as a more effective approach.
The PLCOM2012 risk prediction model, which was derived from the large PLCO study (including 80 375 ever-smoking participants), estimates 6-year lung cancer risk.11 At a threshold of ≥1.51%, PLCOM2012 showed improved sensitivity, specificity and positive predictive value for lung cancer detection compared with NLST criteria.12 The PanCan study used a precursor of the PLCOM2012 model, at a 6-year lung cancer risk threshold ≥2%, to select individuals for screening in a large Canadian screening trial. This resulted in the detection of 172 lung cancers in 2537 eligible smokers, 77% at an early stage.13 In the UK Lung Cancer Screening Trial (UKLS) the Liverpool Lung Project model (LLPv2) was used; those with a 5-year lung cancer risk of ≥5% were eligible for screening. After one screening round and nodule surveillance, 2.1% were diagnosed with lung cancer, 86% of which were early stage.14
The Manchester Lung Health Check (LHC) pilot offered targeted LDCT screening to ever-smokers in deprived areas of Manchester. Annual screening, over two screening rounds, was offered to individuals with a 6-year lung cancer risk score of ≥1.51% calculated using the PLCOM2012 risk calculator.15 As well as recording lung cancer-related outcomes, other metrics were collected such as spirometry and 10-year cardiovascular disease (CVD) risk (QRISK2 score). Here, we compare screening performance according to population selection based on NLST eligibility criteria or individual lung cancer risk, calculated using PLCOM2012 and LLPv2 models, in participants of the Manchester LHC pilot. This is of relevance for screening implementation in the UK as National Health Service England (NHSE) have funded an expansion of LHCs at 14 sites across the country, employing both PLCOM2012 ≥1.51% and LLPv2 ≥2.5% risk thresholds to select screening participants.16
The risk of lung cancer is strongly correlated with increasing age and tobacco smoke exposure. Previous studies have shown that increased risk of lung cancer is accompanied by an increased risk of having comorbid conditions such as chronic obstructive pulmonary disease (COPD) and CVD.17 Individuals with comorbid conditions may experience less benefit and more harm from screening.18 This may negatively impact the efficacy and efficiency of the screening programme.19 Therefore, we also consider how comorbidity and respiratory symptoms are correlated with lung cancer risk.
Methods
The Manchester LHC pilot took place in three deprived areas of Manchester (Harpurhey, Gorton and Wythenshawe) during 2016–2017. The design and approach used by the service has previously been described.15 In brief, ever-smokers aged 55–74 from 14 general practices were invited to take part in a community-based LHC. The LHC consisted of an assessment of symptoms, measurement of spirometry, calculation of 6-year lung cancer risk using the PLCOM2012 model and smoking cessation advice. Those at higher risk of lung cancer (defined as PLCOM2012 score ≥1.51%) were eligible for annual LDCT screening over two screening rounds.
Variables used in the PLCOM2012 risk calculator are age, race/ethnicity, body mass index, detailed tobacco smoking history, self-reported COPD status, personal history of cancer, family history of lung cancer and educational attainment.11 US educational levels were adapted to the UK population in accordance with the International Standard Classification of Education.20 Data were also collected to allow calculation of 5-year lung cancer risk using the LLPv2, although this was not used for screening selection. Variables included in LLPv2 include age, sex, prior history of cancer, previous asbestos exposure, any first degree relative with lung cancer (and any under the age of 60), number of years smoked and previous history of one or more of the following: pneumonia, emphysema, bronchitis, tuberculosis, COPD.21 Spirometry was performed using a desktop spirometer (Vitalograph ALPHA) to measure the forced expiratory volume in 1 s (FEV1), forced vital capacity (FVC) ratio and respective predictive values. Airflow obstruction was defined as FEV1/FVC <0.7.22 All measures were prebronchodilator.
LHC participants completed a questionnaire related to symptoms. The Medical Research Council (MRC) dyspnoea scale was used to categorise breathlessness (scale of increasing severity from 1 to 5). Participants were classified as ‘symptomatic’ if they reported one or more of the following symptoms at baseline: breathlessness (MRC dyspnoea scale ≥2), cough ≥6 weeks in duration, sputum production ≥teaspoon/day. The presence or absence of emphysema was recorded by the reporting radiologist at the time of the baseline scan. Ten-year risk of CVD was estimated, in those with no prior history of CVD, in those who attended the second screening round using the QRISK2 calculator.23 Coronary artery calcification (CAC), another independent predictor of CVD, was measured using the LDCT images produced during the lung cancer screening. CAC was classified subjectively by the reporting radiologist as: none, mild, moderate or severe.24
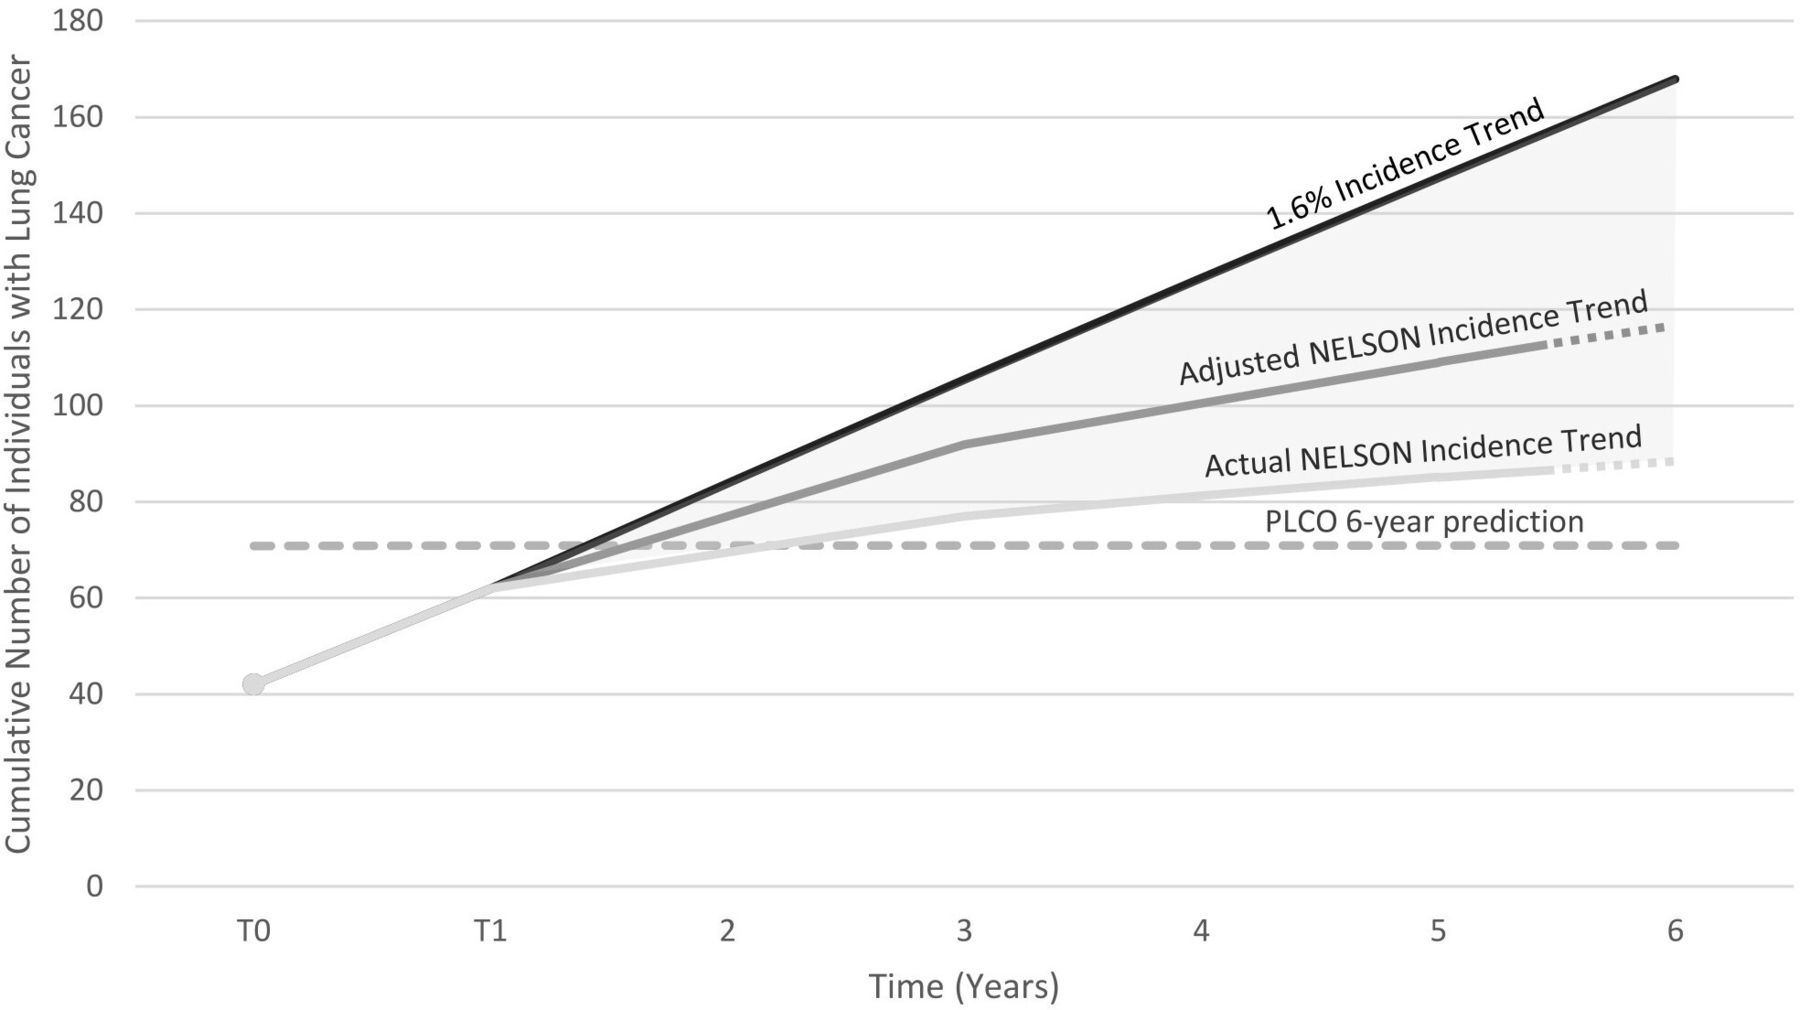
We used hypothetical detection rates to approximate the number of lung cancers that might have been detected in Manchester if screening had been continued for a total of 6 years. In the NELSON trial, lung cancer detection rates at each screen were 0.9% at baseline, 0.8% in the second screening round (1 year after baseline), 1.1% in the third (3 years after baseline) and 0.8% in the fourth screening round (5.5 years after baseline). This is one-third and one half the detection rate seen in Manchester at baseline (3.0%) and the second round (1.6%). The projected detection rates used for analysis were therefore adjusted twofold to 2.2% (3rd round) and 1.6% (4th round). Lung cancer incidence data from the NELSON trial was used as a basis for projections because it was undertaken in a comparable European population, at a large scale and the duration of screening was similar (5.5 years) to the 6-year risk calculated by PLCOM2012. The denominator was total number eligible for screening minus the number of participants diagnosed with lung cancer prior to that screening round, thus the estimated number of cases assumes complete adherence. Lung cancers diagnosed outside of screening (interval cancers) in the NELSON trial were not included in the analysis, and therefore, we assumed that no interval cancers would occur. This is consistent with our own data which showed no interval cancers between the first and second screening round.25
Statistical analysis was carried out using IBM SPSS Statistics V.25. Comparison of means was conducted by T test or one-way analysis of variance (ANOVA). All p values for ANOVA were adjusted for multiple testing by post hoc Bonferroni correction. P values for trend were calculated by fitting linear or logistic regression models, using a single independent variable with 1 degree of freedom. We tested a number of variables, not included in the PLCOM2012 model, in a logistic regression analysis to see if they were independently predictive of lung cancer after controlling for PLCO risk score, as indicated by a statistically significant p value for the variable in question (<0.05). These variables included FEV1/FVC ratio, CAC and emphysema.
Results
The results from both screening rounds have previously been published.15 25 In brief, 2541 ever-smokers had an LHC. A total of 1429 (56.2%) were eligible for screening based on a threshold of PLCOM2012 ≥1.51%; 1384 had a baseline LDCT scan and 26 had a scan at T1 only. The total number who had at least one screening scan was 1410 or 98.7% of those eligible. The characteristics of attendees are detailed in table 1 stratified according to lung cancer risk (PLCOM2012). Variables included in the PLCOM2012 risk model such as age and smoking exposure associate closely with risk score; for example, mean age increases from 62.4 in the lowest risk (PLCOM2012 score 1.51%–1.99%) to 69.7 in the highest risk group (PLCOM2012 score ≥10%) and mean smoking duration likewise increases from 37.5 to 53.5 years.
Distribution of variables according to LC risk category (as calculated by PLCOM2012)
Lung cancer detection
Forty-two individuals were diagnosed with screen detected lung cancer in the first screening round (3.0%) and 19 (1.6%) in the second. One person was diagnosed with lung cancer during nodule surveillance after the end of the second round and has been included in the analysis. The number needed to screen (NNS) to detect one lung cancer using PLCOM2012 risk threshold of ≥1.51% was 23; this ranged from 66 to 73 in those with a risk score 1.51%–2.99%, falling to nine for those with a score of ≥10% (table 1). There was a difference in the NNS to detect one lung cancer at or above each risk group (simulating different screening thresholds) between male and female subgroups (table 1). At the ≥1.51% threshold, used in the LHC pilot, the NNS to detect one cancer was 26 for men and 20 for women. The NNS to detect one cancer was lower for women at every threshold until ≥6% at which point it was similar.
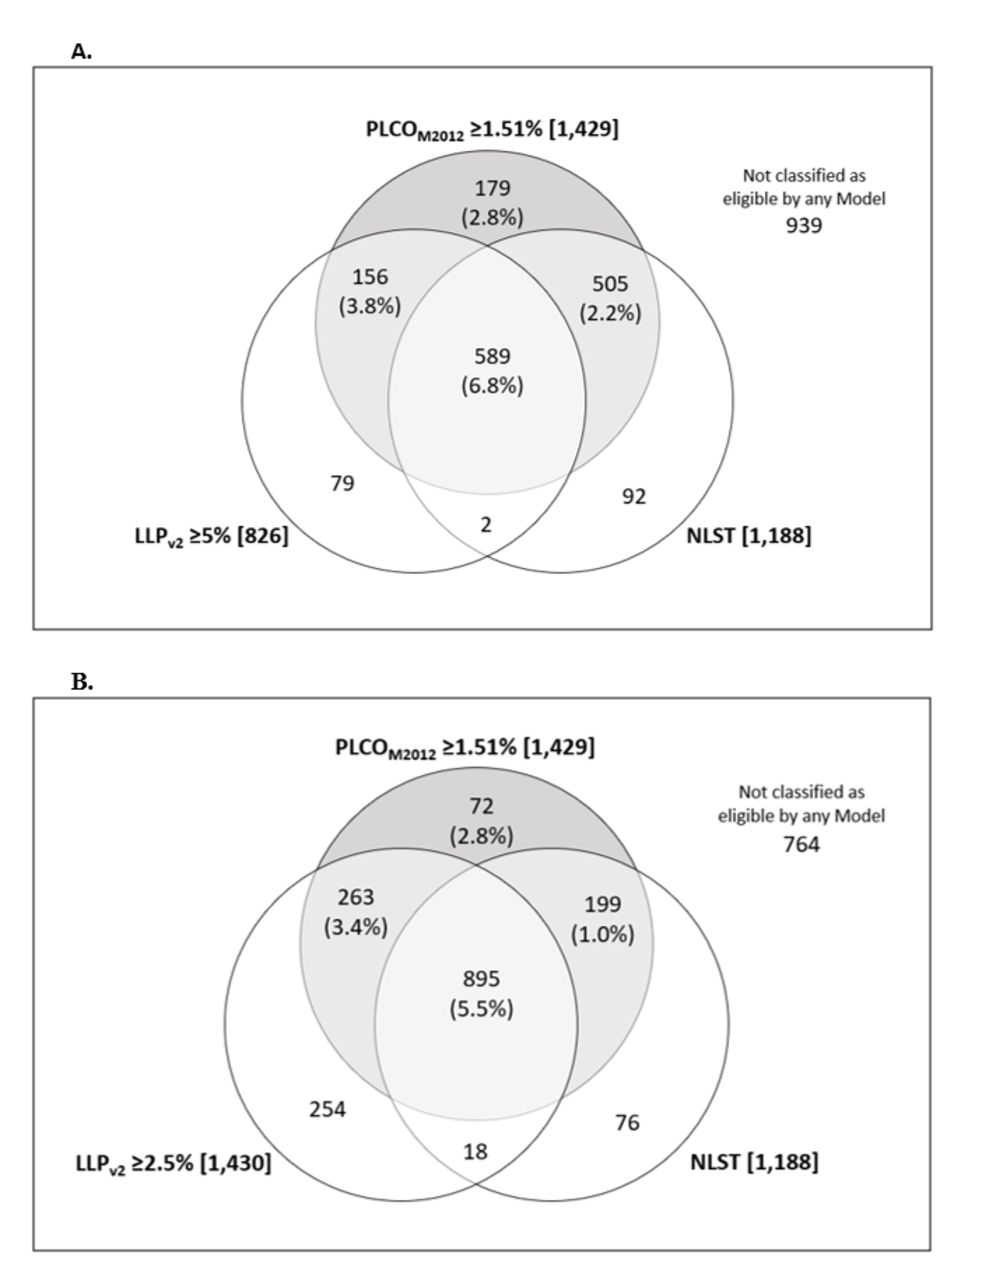
In UKLS, screening eligibility was defined as LLPv2 score ≥5%. In our population, 826 participants would have qualified for screening based on this threshold, including 52.1% (n=745/1429) of those eligible by PLCOM2012 (figure 1A). One-quarter of those diagnosed with lung cancer would not have been eligible for screening (25.8%, n=16/62). It is unknown how many additional cancers would have been diagnosed within the 81 individuals eligible using LLPv2 ≥5% criteria who were not screened (PLCOM2012 <1.51%). With a lower LLPv2 threshold of ≥2.5% (figure 1B), 1430 of those assessed would have been eligible for screening, including 93.5% (n=58/62) of screen-detected lung cancers. Lung cancer outcomes are unknown among the 272 participants who were eligible by LLPv2 ≥2.5% but ineligible by PLCOM2012 ≥1.51%. This cohort (n=272) was significantly older (66.7±4.9 vs 62.4±5.6 years, p<0.0001), had a lower proportion of current smokers (19% vs 39%, p<0.0001) and lower smoking exposure (pack-years 19.4±13.7 vs 37.8±15.5, p<0.0001) than the lowest risk screened group (PLCOM2012 score 1.51%–1.99%; n=265). If LHC attendees had been deemed eligible by either PLCOM2012 (≥1.51%) or LLPv2 (≥2.5%), the number screened would have increased by 19% (n=272). We show the distribution of screen detected lung cancers according to PLCOM2012 and LLPv2 risk score (figure 2).

Number of participants eligible for screening by each risk model: PLCOM2012 ≥1.51%, NLST and (A) LLPv2 ≥5% (B) LLPv2 ≥2.5%. Percentage in () = lung cancer detection rate within segment. Number in [] = number of individuals eligible for screening. Shaded = threshold used for LHC screening selection. LHC, lung health check; LLPv2, Liverpool Lung Project Model; NLST, National Lung Screening Trial.

Distribution of screen detected lung cancers according to lung cancer risk (PLCOM2012 and Liverpool Lung Project model (LLPv2) score).
Had screening participants been selected according to NLST eligibility criteria (aged 55–74; ≥30 pack-year smoking history; smoker within 15 years), 14% fewer individuals would have been offered screening (n=1188) and 18% (n=11) of individuals diagnosed with lung cancer would not have been eligible for screening. A PLCOM2012 ≥1.51% threshold selected 92.7% of individuals eligible by NLST criteria. It is unknown how many additional cancers would have been diagnosed within the 7.3% (n=94) of individuals eligible by NLST criteria but not screened (PLCOM2012 score <1.51%) (figure 1A). If we conservatively assume that none of the 94 individuals eligible by NLST criteria but ineligible by PLCOM2012 would have been diagnosed with lung cancer, then detection rates in the NLST eligible Manchester population would be 4.3% (n=51/1188) over both screening rounds or 2.8% at T0 (n=35/1188) and 1.5% at T1 (n=16/1094). These are significantly higher (p=0.0001) than the equivalent figures in NLST which are 1.0% (n=270/26 309) at T0 and 0.7% (n=168/24 715) at T1 equating to 1.7% (n=438/26 309) over both rounds.26 Therefore, despite the same eligibility criteria, the Manchester population had more than double the rate of lung cancer detection than those recruited to NLST.
Based on the mean PLCOM2012 score among screened participants (5.0%), the model predicts 71 lung cancers over 6 years. The actual number of lung cancers detected was 62 (detection rate 4.3%) after approximately 15 months (two rounds of annual screening and 3 months nodule follow-up). Assuming a series of detection rates modelled on the NELSON trial27 (see the Methods section), we hypothesise that 113 lung cancers might be diagnosed after 5.5 years (figure 3). Even with a conservative projection using unadjusted NELSON incidence, 87 lung cancers might be detected after 5.5 years. If the annual detection rate were to remain the same as T1 (1.6%) (approximately the pattern seen in the Danish Lung Cancer Screening Trial28), then an estimated 168 lung cancers might be detected after 6 years, almost 2.5 times as many as predicted by the PLCOM2012 model.

Projected cumulative number of individuals with lung cancers detected within the LHC cohort over 6 years of screening with detection rates based on: NELSON actual detection rates, NELSON-adjusted detection rates (see the Methods section) and continuation of the 1.6% LHC T1 detection rate. LHC, lung health check.
Respiratory comorbidity
Respiratory symptoms were recorded at baseline as part of the LHC and attendees classified symptomatic if they reported one or more of the following symptoms: breathlessness (MRC dyspnoea scale ≥2), cough ≥6 weeks in duration or sputum production ≥teaspoon/day. Overall, 50% of attendees reported at least one symptom (n=1273). The proportion categorised as symptomatic was highest in the highest risk group (PLCOM2012 ≥10%; 75.9% symptomatic) double that in those at lowest risk (PLCOM2012 ≤1.5%; 37.6% symptomatic). The proportion reporting breathlessness (MRC dyspnoea score ≥2) increased from 22% in the lowest risk group to 52% in the highest (p<0.001).
The increase in symptom burden was mirrored by changes in lung function. Airflow obstruction was present in 37% (n=948) of LHC attendees overall, this ranged from 21% in those at low risk (PLCOM2012 ≤1.5%) to 74% in those at highest risk (PLCOM2012 ≥10%). The degree of airflow obstruction (represented by reduced FEV1/FVC ratio) was inversely correlated to PLCOM2012 score, with mean ratio dropping from 74.7% (PLCOM2012 ≤1.5%) to 61.3% (PLCOM2012 ≥10%) (table 1, figure 4, p<0.001). The presence or absence of emphysema was recorded in 98.4% of scan reports (n=1387/1410); overall, 64% (n=883) of individuals had radiological evidence of emphysema, this ranged from 54% in the lowest (PLCOM2012 1.51% to 1.99%) to 77% in the highest risk group (PLCOM2012 ≥10%) (p<0.001).

FEV1/FVC ratio according to lung cancer risk group. Horizontal line represents 70% threshold indicative of airway obstruction. FEV1/FVC, forced expiratory volume in 1 s/forced vital capacity. (o = outlier 1.5-3 interquartile ranges (IQRs) from nearest edge of box. * = outlier >3 IQRs from nearest edge of box.)
Cardiovascular disease
Of 939 individuals who responded to a questionnaire in the second screening round, 21.9% reported a prior history of CVD (defined as a previous diagnosis of one or more of the following: myocardial infarction, angina, stroke or transient ischaemic attack). This ranged from 17.8% (PLCOM2012 ≤1.51%) to 30.0% (PLCOM2012 ≥10%). The presence of CAC also increased with PLCO risk; CAC was present in 66% of the lowest risk group increasing to 80% in the highest risk. Almost one in five of those with PLCOM2012 ≥10% risk of lung cancer had severe CAC.
Lung cancer risk
We assessed a number of clinical variables, not included in the PLCOM2012 model, to see if any were independently predictive of lung cancer after controlling for PLCOM2012 score. The presence of symptoms (as defined in the Methods), FEV1/FVC ratio and the presence of CAC were predictive of lung cancer after univariable analysis but the presence of emphysema on LDCT was not (table 2). There was a borderline significant association between decreasing FEV1/FVC ratio and lung cancer after adjustment for PLCOM2012 score alone (adjOR 1.02, 95% CI 0.99 to 1.05; p=0.067). This analysis was undertaken because FEV1/FVC ratio is available at the time of the LHC but radiological measures are not. After multivariable analysis (which included: CAC, presence of symptoms, FEV1/FVC ratio and PLCOM2012 score) only PLCOM2012 score and CAC were independent predictors of lung cancer (table 2). The presence of CAC was associated with lung cancer (n=885) (adjOR 2.50, 95% CI 1.11 to 5.64; p=0.028), this association was higher in those with moderate and severe CAC (n=429) (adjOR 2.62, 95% CI 1.11 to 6.20; p=0.029) compared with those with mild CAC (n=456) (adjOR 2.38, 95% CI 0.996 to 5.67; p=0.051).
Univariable and multivariable analysis of the risk of screen detected lung cancer stratified according to clinical variables and PLCOM2012 score
Discussion
Retrospective analysis of PLCOM2012, LLPv2 (at ≥2.5% and ≥5% thresholds) and NLST criteria, applied to the participants of the Manchester LHC pilot, demonstrated significant variability between models in lung cancer detection and numbers selected for screening. For example, one in four of those with screen detected lung cancer in our cohort would not have qualified for screening in UKLS, which used the LLPv2 model at a threshold ≥5%, and one in five using NLST criteria. In the national protocol for NHSE Targeted LHC programme, selection for lung cancer screening is based on either PLCOM2012 (≥1.51%) or LLPv2 (≥2.5%) score. In our cohort, this lower LLPv2 threshold would have classified a similar number of people as screening eligible, and among the individuals who were screened, it selected 93.5% of those with cancer. However, if eligibility was allowed by either PLCOM2012 or LLPv2, the number screened would have increased by almost 20%. It is not possible from our data to determine how many of those 20% would have been diagnosed with lung cancer, and therefore, the potential benefit or detriment of concurrently using these two different criteria.
One possible interpretation of our results is that the PLCOM2012 model may underestimate risk in our population. Over only 15 months of screening and associated follow-up, 87% of the predicted 6-year lung cancer incidence rate was reached. Using hypothetical detection rates projected based on NELSON, we estimated a 1.6-fold increase in lung cancer incidence over 5.5 years of screening in our population compared with incidence predicted by PLCOM2012. However, it is important to recognise limitations to this approach. The PLCOM2012 model was developed in the PLCO trial and therefore predicts risk in the absence of LDCT screening, whereas we have observed detection in the presence of screening. Screening increases incidence over a short-term period by moving lung cancer diagnoses earlier in time, and also via overdiagnosis, the magnitude of which is debated in lung screening.29 30 Further, we do not take drop-out and participation rates into account when calculating projected cancer diagnoses, nor do we account for mortality from other causes. However, if the PLCOM2012 model does underestimate risk in our population, this would highlight the need for a recalibration of the risk model to ensure optimal performance. Formal calibration of the risk model would require at least 100 events, which is beyond the scope of this study.31
The high-risk nature of our cohort was also evident when we limited analysis to only those eligible for screening based on NLST criteria, as the lung cancer detection rate was more than double that seen in NLST. The majority of lung cancers diagnosed through screening were found in individuals occupying the higher risk groups. This was true for both PLCOM2012 and LLPv2 risk models. Moving the risk threshold dramatically changes the number of individuals eligible for screening and therefore the number of CT scans requiring reports. For example, increasing the threshold to 2% by PLCOM2012 (as in the PanCan study) reduces those eligible for screening by 20%, with only 6.5% fewer cancers detected. Although such a modification could mitigate the impact of limited CT scanner and thoracic radiologist capacity in the UK, it would fail to take into account a number of complex subsidiary considerations such as the potential reduction in screening efficacy through the selection of a more comorbid population. Our data underline this by showing how increased lung cancer risk is associated with increased comorbidity, such as established CVD, the presence and severity of airflow obstruction as well as respiratory symptoms. Previous studies have highlighted that individuals with significant comorbidities can reduce the cost-effectiveness and benefit of a screening programme. For example, in colorectal cancer screening, individuals with diabetes at age 50 derive approximately 1.8 times fewer ‘life years saved per-person’ than their counterparts without diabetes.32 Breast cancer screening for those aged over 79 may only be only cost-effective for the 25% of individuals with the highest life expectancy (based on chronological age and comorbidities).33 Similar recommendations have been made for lung cancer screening based on comparative modelling analysis.34 A recent study found that selecting lung cancer screening participants using a model which predicts life-years gained rather than disease risk would increase the benefits derived from CT screening by selecting a younger, less comorbid screening cohort.35 A possible drawback of such an approach might be that it deprives the LHC programme of the opportunity to address common and significant comorbidities such as detection of undiagnosed COPD, evaluation of CV risk to optimise primary prevention and immediate access to stop smoking services. Including these in a screening programme may improve cost-effectiveness, although quantifying such an improvement will require measurement of these potential added benefits.36
We investigated a number of objective measures of ‘smoking damage’ (FEV1/FVC ratio, CAC and presence of emphysema on CT), not included in the PLCOM2012 model, to see if they were independently predictive of lung cancer after controlling for PLCO risk score. The presence and degree of CAC remained an independent predictor of lung cancer. If this association is confirmed in other datasets, the value of CAC to inform screening strategies, after the baseline round, should be evaluated further. The ratio of FEV1/FVC showed borderline statistical significance to predict lung cancer after adjusting for PLCOM2012 score. Previous studies have shown that the inclusion of lung function test results in lung cancer risk prediction significantly improved its precision.37 38 As spirometry tests are already conducted as part of the LHC programme (and the results are immediately available), lung function measures could be factored into lung cancer risk prediction and screening selection with ease. Further research is warranted to establish whether FEV1/FVC improves prediction over current risk prediction models.
Although our cohort is relatively small, it does provide ‘real-world’ data relevant to lung cancer screening implementation. The population screened in the LHC pilot represents the target population for a lung cancer screening programme, particularly regarding measures of deprivation (75% in the lowest deprivation quintile), smoking history and associated comorbidity. Our data relating to lung cancer risk and comorbidities is of particular relevance to screening implementation; previous studies relating to lung cancer risk and comorbidities have examined participants in randomised control trials such as NLST, where participation bias and the healthy volunteer effect may reduce lung cancer risk and the prevalence of comorbidities in the study population.39 40 Conversely our data, although not immune from bias, is derived from a cohort at high risk of lung cancer resident in deprived areas of Manchester. This population may more accurately indicate the health and comorbidities of screening attendees in a ‘real-world’ setting.
One limitation of our study is that not enough time has elapsed to allow for collection of data related to the life expectancy, future health events and ultimate cause of death of those within the cohort. PLCOM2012 calculates lung cancer risk over 6 years, while our data are limited to 15 months. Furthermore, we do not have data related to quality of life, an important metric when it comes to decisions related to screening inclusion and success, particularly when examining the impact of screening on individuals with co-morbid conditions.
The retrospective nature of our analysis means that we are unable to determine the outcomes of those who were not eligible for screening using the PLCOM2012 threshold but were eligible using LLPv2 or NLST criteria. Further work is needed to prospectively evaluate the performance of risk models in different populations. The randomised controlled Yorkshire Lung Screening Trial (YLST) is prospectively evaluating PLCOM2012 (≥1.51%), LLPv2 (≥5%) and NLST criteria (extended to age 80) and will provide important information for the optimal approach for screening selection in a UK population. Future screening programmes may incorporate screening result as a way of optimising lung cancer risk prediction. Examples of such models include PLCO2012results 41 and LCRAT+CT.42 Population selection could also take into account ‘life-years gained’ to reduce the impact of comorbidity on screening efficacy.35 These approaches would require external validation and evaluation prior to clinical implementation.
References
Footnotes
Twitter @MLebrett, @JetstreamSol, @DrPhilCrosbie
Contributors Service concept: RB, PAJC, PVB and JT. Service development by members of the Macmillan Cancer Improvement Partnership: RB, PAJC, PVB, JT, DC, AM, PE, ST. Service operation and delivery by the Manchester University NHS Foundation Trust lung cancer team: HB, ME, JL, RB, PAJC and AS. Radiology reporting by the radiology consortium: RD, MG, JH, KI, DK, SM, TN, AS, ES, BT, AW and JW. Data collection, analysis and drafting of manuscript: MBL, HB, HAR and PAJC. Guarantor of overall content PAJC. Review, revision and agreement of final manuscript: all authors.
Funding The Manchester ‘Lung Health Check’ pilot was supported by funding from Macmillan Cancer Support and the Macmillan Cancer Improvement Partnership facilitated service design and development. PAJC is supported by the NIHR Manchester Biomedical Research Centre. MBL is supported by the NIHR Manchester Biomedical Research Centre. HAR is supported by the INTEGRAL project (USA National Cancer Institute U19 CA203654).
Disclaimer Where authors are identified as personnel of the International Agency for Research on Cancer/ World Health Organization, the authors alone are responsible for the views expressed in this article and they do not necessarily represent the decisions, policy or views of the International Agency for Research on Cancer / World Health Organization.
Competing interests None declared.
Patient consent for publication Not required.
Provenance and peer review Not commissioned; externally peer reviewed.
Data availability statement Data are available upon reasonable request. We have established a Lung Cancer Steering Committee who will consider applications for data access.