Article Text

Abstract
Background Rates of hospital admissions for bronchiolitis vary seasonally and geographically across England; however, seasonal differences by area remain unexplored. We sought to describe spatial variation in the seasonality of hospital admissions for bronchiolitis and its association with local demographic characteristics.
Methods Singleton children born in English National Health Service hospitals between 2011 and 2016 (n=3 727 013) were followed up for 1 year. Poisson regression models with harmonic functions to model seasonal variations were used to calculate weekly incidence rates and peak timing of bronchiolitis admissions across English regions and clinical commissioning groups (CCGs). Linear regression was used to estimate the joint association of population density and deprivation with incidence and peak timing of bronchiolitis admissions at the CCG level.
Results Bronchiolitis admission rates ranged from 30.9 per 1000 infant-years (95% CI 30.4 to 31.3) in London to 68.7 per 1000 (95% CI 67.9 to 69.5) in the North West. Across CCGs, there was a 5.3-fold variation in incidence rates and the epidemic peak ranged from week 49.3 to 52.2. Admission rates were positively associated with area-level deprivation. CCGs with earlier peak epidemics had higher population densities, and both high and low levels of deprivation were associated with earlier peak timing.
Conclusions Approximately one quarter of the variation in admission rates and two-fifths of the variation in peak timing of hospital admissions for bronchiolitis were explained by local demographic characteristics. Implementation of an early warning system could help to prepare hospitals for peak activity and to time public health messages.
- respiratory infection
- viral infection
Statistics from Altmetric.com
Key messages
What is the key question?
How is the timing and volume of hospital admissions for bronchiolitis associated with demographic characteristics across England?
What is the bottom line?
There is a 5.3-fold difference in rates of admissions across clinical commissioning groups, with about one quarter explained by area-level deprivation, while the peak epidemic week varies by 3 weeks and tends to be earlier among areas with higher population densities, such as London and Manchester.
Why read on?
With no universal prevention available, determining epidemic patterns of bronchiolitis across the country is an essential step in understanding how to reduce this common cause of infant hospital admissions.
Introduction
Bronchiolitis, an acute lower respiratory tract infection, is the most common reason for hospital admission during the first year of life.1 In 2011, the rate of emergency hospital admissions in England due to bronchiolitis reached 46.1 per 1000 infants.2 Approximately 80% of hospitalised bronchiolitis cases among children under 1 year in England are attributable to respiratory syncytial virus (RSV).3 In temperate climates, rates of RSV peak in winter, creating a substantial seasonal burden on primary and secondary care services.2 Infants at high risk of RSV-related hospital admissions, including pre-term infants with chronic heart or lung conditions that are less than 6 months of age at the beginning of the RSV season, are recommended to receive palivizumab, a humanised monoclonal antibody, prophylactically during peak months of RSV circulation.4 5 There is currently no vaccination available against RSV, although several candidates are currently being assessed in clinical trials.6
Geographical location is a prominent source of variation in rates of hospital admissions for bronchiolitis in England.2 7 8 Green e t al 2 noted a 5.3-fold difference in the rate of hospital admissions for bronchiolitis across the 352 Local Government Areas of England and found a positive correlation between admission rates and area-level socioeconomic deprivation (r2 =0.24). Another study of hospital admissions found a similar modest association between socioeconomic deprivation and bronchiolitis rates (r2 =0.33) across the 152 English Primary Care Trusts—the local National Health Service (NHS) administrative bodies, which were abolished and replaced by clinical commissioning groups (CCGs) in 2013.7 As suggested in both papers, it is likely that hospital factors, including admission thresholds and bed capacity, are a major contributor to the variation in admission rates noted. However, previous studies did not examine spatial variation in the timing of bronchiolitis admission rates or the impact of population factors, including population density.
We describe the spatial variation in seasonality of hospital admissions for bronchiolitis across England. We demonstrate how seasonality of bronchiolitis admissions among infants varies across region in England and assess how epidemic timing and rates of admissions are associated with demographic characteristics between CCGs. Our results can be used to plan interventions, such as whether differential timing of prophylaxis or vaccination could reduce the impact of RSV epidemics.
Methods
Data sources
Hospital Episodes Statistics admitted patient care data (HES APC) is a database containing information on all inpatient admissions to hospitals in England funded by the NHS. This dataset captures approximately 97% of births in England with information stored separately for the baby (birth episode) and mother (delivery episode).9 HES APC allows patients to be tracked via longitudinal hospital records using a unique identifier called the HESID, which enables researchers to create cohorts from the dataset.10 Alongside HES APC, we used CCG-level data, namely the Index of Multiple Deprivation (IMD) and population size, which we downloaded from the Ministry of Housing, Communities & Local Government11 and Office for National Statistics12 websites, respectively.
Study population
A birth cohort of children born from 1 January 2011 to 31 December 2016 was created from HES APC. Ninety-five per cent of birth records were successfully linked to maternal delivery records using the methods developed by Harron et al,13 which enabled us to complete missing information on geographical residence of infants, based on the postcode recorded at birth/delivery. Infants were excluded from analyses if they were from a multiple birth or stillborn, and non-English resident children were excluded since they cannot be followed up in English hospital data. We followed children from birth or 1 January 2012, whichever was later, to their 1st birthday, date of death, (estimated) date of emigration or 31 December 2016, whichever came first. This study period ensured that we had follow-up for children aged up to 12 months in all study years. Emigration was defined as the presence of a non-English address in any admission during follow-up. The emigration date was set as the mid-point between the child’s date of birth and the date at which the non-resident admission occurred. We focused on admissions in the first year of life since more than 90% of bronchiolitis admissions occur in infancy.3 14
Outcome
Our study outcome was the number of hospital admissions for bronchiolitis, recorded as either the primary or one of the 19 secondary diagnosis in HES APC. Diagnoses in HES APC are coded using the International Classification of Diseases, version 10 (ICD-10), and we identified bronchiolitis admissions using ICD-10 J21 codes indicating acute bronchiolitis. Any admission date for bronchiolitis within 14 days of the previous discharge date were assumed to be associated with the same infection, and only the first of these admissions included in the number of admissions.
Covariates
Year and week of the year at admission were derived from each bronchiolitis admission record. All other covariates were based on each infant’s recorded address at birth.
Government region was used to describe broad patterns across England and CCGs to examine local areas. There are nine government office regions in England, created to delegate functions from national government in 1994, but now used only for administrative and statistical purposes.15 In ascending order of population size, these are the North East, East Midlands, Yorkshire and the Humber, South West, West Midland, East of England, North West, London and the South East. CCGs, introduced in England in 2013, are NHS bodies responsible for planning and commissioning for local areas in England.12 There were 209 CCGs in England over the study period with mid-2016 populations ranging from 68 187 in Corby (Northamptonshire) CCG to 898 025 in Northern, Eastern and Western Devon CCG. The number of CCGs within each region ranged from 11 CCGs in the North East to 39 CCGs in the South East.
We calculated annual population density estimates—the number of residents per square kilometre—for each CCG by dividing annual CCG population sizes by the area of each CCG in square kilometres (estimated using polygon areas in QGIS).12 The average population size over the 5-year study period was assigned to each CCG. IMD is an overall measure of deprivation experienced by people within a neighbourhood. IMD is constructed using seven domains of deprivation: income, health and disability, education, skills and training, barriers to housing and services, crime and living environment, with measures mainly derived from the 2011 Census.16 We used the average CCG IMD score for 2015—with a higher score indicating higher levels of deprivation.11
Statistical methods
Stata 15.017 was used for data analysis. Microsoft Excel 2013 was used to create graphs and QGIS 2.18,18 a free open-sourced geographic information system, to present geospatial data. Weekly incidence rates of bronchiolitis admissions for each study year, by region and CCG, were calculated by dividing the number of admissions by person-time at risk. Rates are expressed as admission-based rates per 1000 infant-years. To explore geographical variation at the regional level, we fitted a fixed effects Poisson model (as there was no evidence of overdispersion) to the regional count data. We used robust SEs and expressed the rate in terms of region, year and harmonic functions capturing seasonal variations in weeks (see box 1).19 20 We adjusted for year of admission to account for the annual increasing trend in bronchiolitis admission rates.2
Models’ specifications and derived parameters
Region-specific analyses
Let  , the number of bronchiolitis admissions in region j and year k observed at time t (measured in weeks), follow a Poisson distribution with rate
  where
where  denote the person-time at risk in region
j
and in year
k
at time
t
. We modelled this rate, after log-transformation, as a function of region, year and time of admission as follows:
denote the person-time at risk in region
j
and in year
k
at time
t
. We modelled this rate, after log-transformation, as a function of region, year and time of admission as follows:

where T is the length of period within one harmonic cycle (ie, 1 year=52.14 weeks) and  is the binary indicator of the variable X taking value x. The parameter
  is the intercept,
  and
and  are harmonic function coefficients,
  and
and  are region-specific harmonic function coefficients, and the parameters
  ,
,  and
and  are all constrained to be zero to deal with the collinearity of the binary indicators.
CCG-specific analyses: stage 1
Let the number of bronchiolitis admissions in CCG i and year k, observed at time
t
(in weeks),  , follow a Poisson distribution with rate
  , with
  denoting the relevant person-time at risk. Given the large number of CCGs, the following multilevel model with random intercepts and random harmonic coefficients was specified for the log rate:

where  = random effect component of the intercept;
  = random effect component of the sine parameter;
  = random effect component of the cosine parameter and
  as before. The model’s predicted CCG-specific parameters were then used to derive CCG-specific peak time,
  , and CCG-specific amplitude,
  .
.
CCG-specific RSV analyses: stage 2
These predicted values were then related to predictors in two separate linear regression models:

where  intercepts;
  IMD coefficients;
  population density coefficients;
  CCG-specific IMD;
  CCG-specific log-population density and
  random error terms, assumed to be independently distributed.
CCG, clinical commissioning group; IMD, Index of Multiple Deprivation; RSV, respiratory syncytial virus.
We included interaction terms between region and the sine and cosine functions in the region-specific analyses to allow for effect modification of seasonality by region, formally tested via a Wald  test. Using the estimated harmonic function coefficients, we calculated the following quantities for each region’s epidemic curve21: the amplitude (log)
  =
=  ; the phase (in radians)
  =
= and the peak week
  . For descriptive purposes, we also calculated epidemic duration from the first of three consecutive weeks with increasing predicted rates up to the first of three consecutive weeks with decreasing predicted rates.
As outlined in box 1, there were two parts to the CCG-level analyses. In stage 1, we fitted a multilevel (ie, mixed-effects) Poisson model to the individual admission records. We included the harmonic functions as specified above and allowed for clustering at the CCG level via random effects for the intercept and the harmonic function parameters.20 Using the estimated harmonic function coefficients, we calculated CCG-specific average annual peak week as  , where
i
indicates CCG.20 21 The CCG-specific departures from the model intercept (ie, the random effects for the intercept,
, where
i
indicates CCG.20 21 The CCG-specific departures from the model intercept (ie, the random effects for the intercept,  ) across England were exponentiated to obtain CCG-specific incidence rate ratios (IRRs) relative to the population mean.22 23
In stage 2, with CCGs treated as units of analysis, multivariable linear regression models were fitted to estimate the mutually adjusted association of population density and deprivation score with, separately, the CCG-specific peak timing of bronchiolitis admissions and the IRRs predicted in stage 1. Population density was highly positively skewed and therefore first log-transformed to reduce the impact of very high values. We added quadratic terms to allow for non-linear associations with the explanatory variables and included interactions between them, comparing model specifications via likelihood ratio tests. Alongside regression coefficients, we report the proportion of total variance in each dependent variable explained by the model using eta-squared ( ) and the relative contribution of each model component using partial eta-squared (
 ). To assess the impact of ignoring the uncertainty of the predicted values from the first step, we computed bootstrapped SEs from 1000 bootstraps (from the two stages of the analysis). We calculated bootstrapped SEs using a 20% random sample of the data because of computational constraints due to the size of the complete data.
These models assumed no spatial dependency of the CCG-level residuals. To assess this assumption, we calculated Moran’s I, which is a measure of how related the values of a variable are based on the locations where they were measured (with −1 indicating perfect dispersion, 0 no autocorrelation and 1 perfect clustering).24 Due to the large difference in admission rates within London compared with the rest of the country, sensitivity analyses were conducted to assess the robustness of the results when London-based CCGs were excluded from analyses. To assess the impact of repeated events by the same child, we replicated the analyses including only the first admission per child.
Results
Of all singleton births in our dataset, 1.5% had missing information for region and/or CCG and were excluded from further analyses (see online supplementary figure S1). The final cohort consisted of 3 727 013 children, of which 34.4% had a London or South East address recorded at the time of birth (table 1). The average follow-up time per infant was 304 days. Between 1 January 2012 and 31 December 2016, 3.7% of infants (n=1 39 532) had at least one admission to hospital for bronchiolitis. There were 155 485 admissions for bronchiolitis by cohort members in total, an average annual admission-based rate of 50.1 per 1000 infant-years (95% CI 49.9 to 50.4). Bronchiolitis admission rates increased from 46.9 per 1000 infant-years (95% CI 46.4 to 47.4) in 2012 to 58.4 per 1000 (95% CI 57.8 to 59.1) in 2016. This was equivalent to a 5.2% annual increase of admissions, from 29 853 to 36 028, between 2012 and 2016. Nationally, bronchiolitis epidemics peaked once a year, in December (see online supplementary figure S2). The average weekly variation in observed bronchiolitis admission rates by region are shown in figure 1. Annual admission rates were highest in the North West (68.7 per 1000 infant-years, 95% CI 67.9 to 69.5) and North East (63.8, 95% CI 62.5 to 65.1); both more than twice the rate in London (30.9, 95% CI 30.4 to 31.3).
Supplemental material
Cohort characteristics by admission status

Observed weekly rates of hospital admissions for bronchiolitis, by Region: England, 2012–2016 averaged.
Estimates of the region-specific seasonal parameters derived from the harmonic Poisson regression model (online supplementary table S1, online supplementary figure S3) are presented in table 2. There is some seasonal variation across regions, with the epidemic peak week ranging from week 50.3 in London (95% CI 50.2 to 50.5) to week 51.4 in the North East (95% CI 51.2 to 51.5). The estimated amplitude at peak epidemic week compared with the mean week was lowest in London ( =3.41, 95% CI 3.31 to 3.52) and highest in the North East (
 =4.95, 95% CI 4.72 to 5.19). Each region had an epidemic duration of 26 or 27 weeks. At week 51, rates of admissions were 2.45 and 2.44 times greater in the North West (95% CI 2.39 to 2.52) and the North East (95% CI 2.36 to 2.52) compared with London.
Derived average annual seasonal estimates following harmonic Poisson regression* (online supplementary table S1), by region
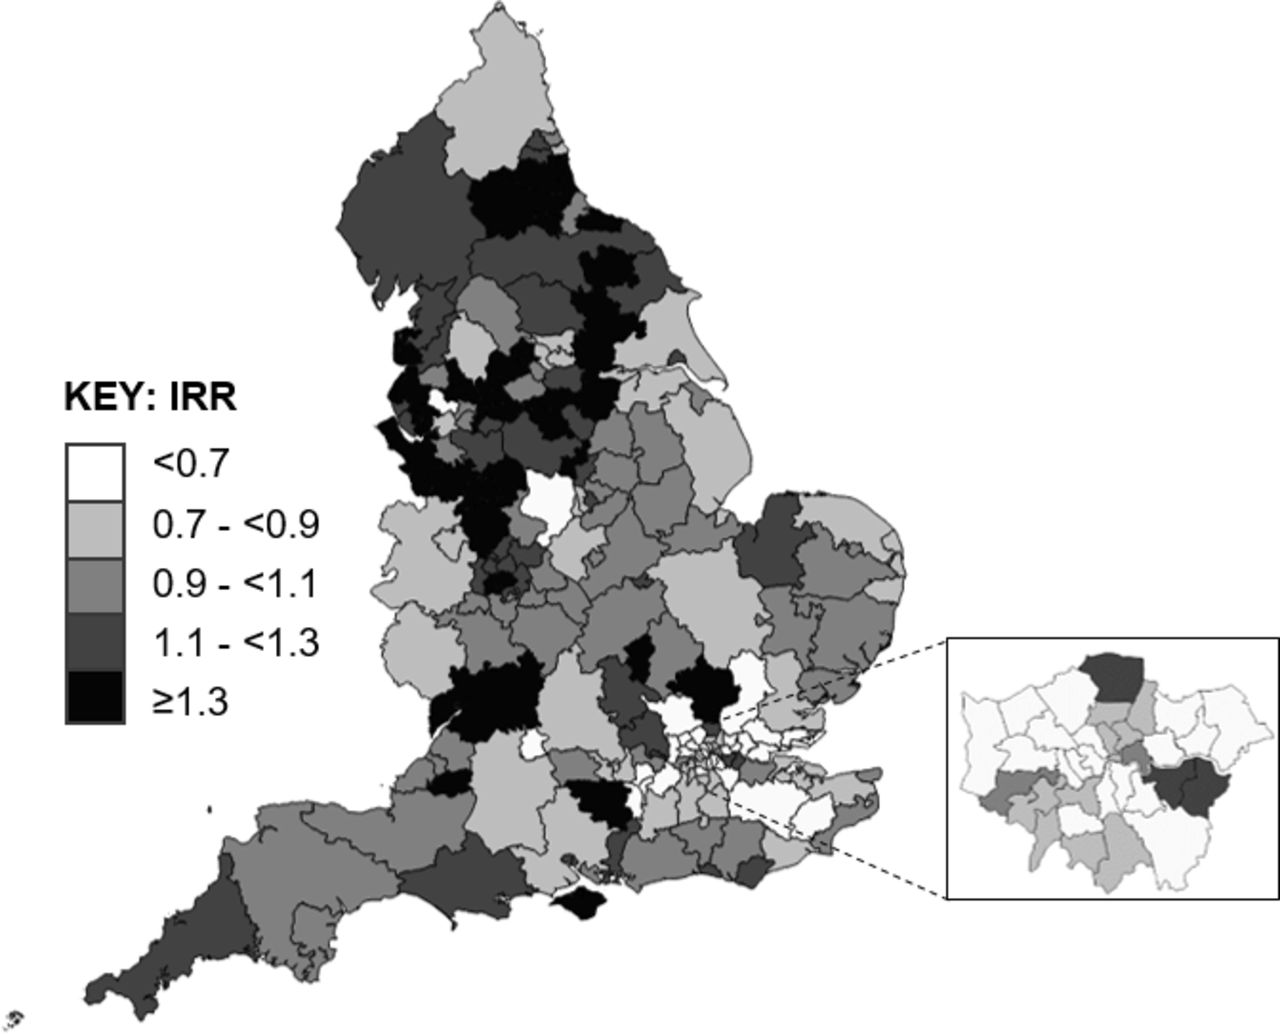
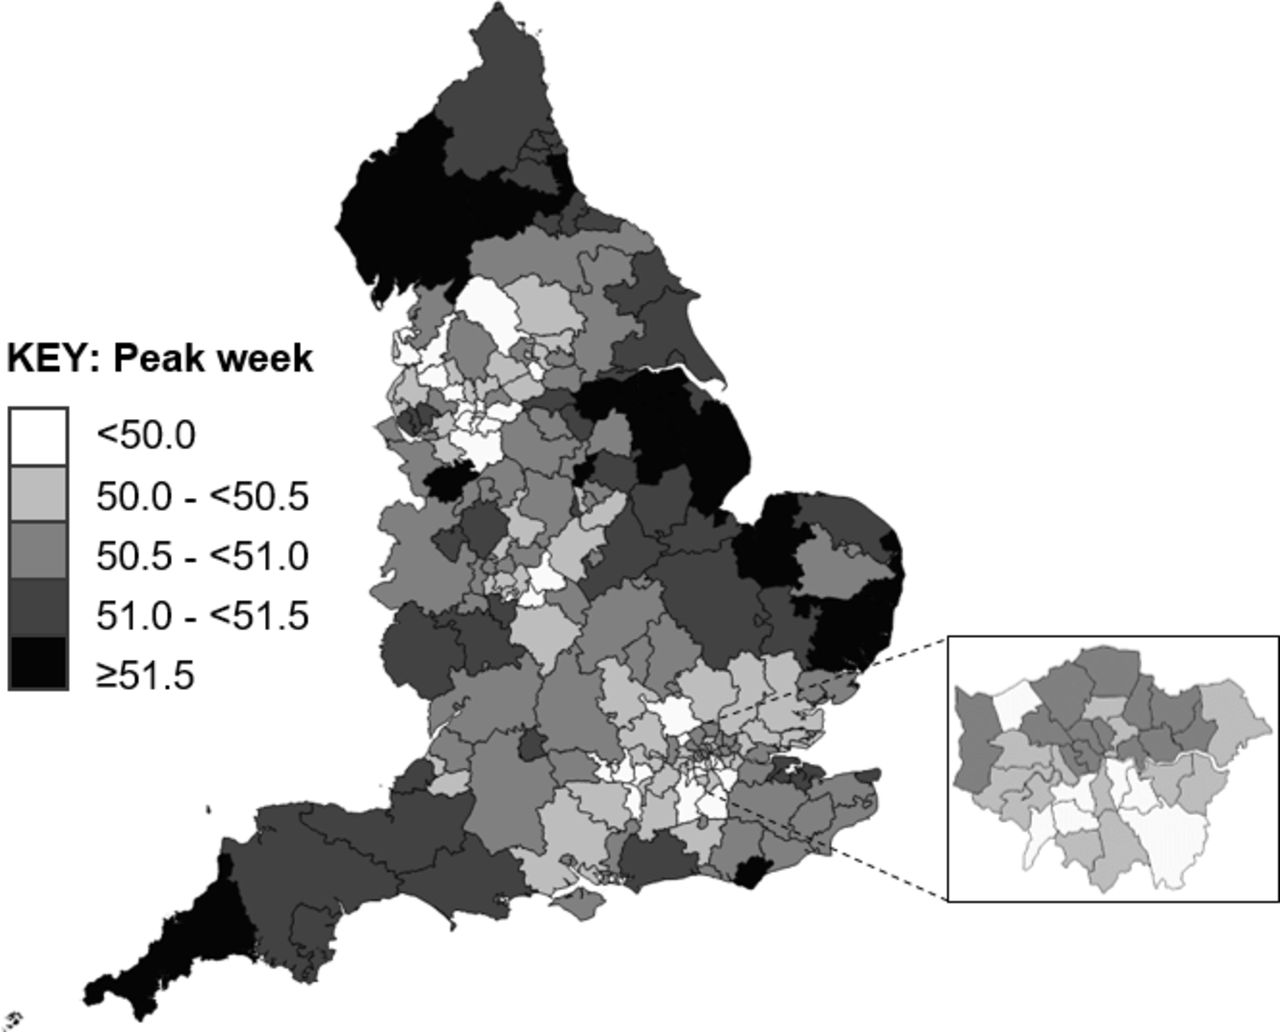
Compared with the average rate of admissions in England, predicted rates (derived from the multilevel model, online supplementary table S2) were highest in CCGs based in the North West and lowest in London and South-East CCGs (figure 2). There was a ratio of 5.3 between the lowest and highest CCG-based incidence rates. Peak epidemic timing by CCG ranged by 2.9 weeks, from week 49.3 to week 52.2. As illustrated in figure 3, the earliest peaks were seen in North West and London CCGs.

Predicted IRRs of bronchiolitis hospital admissions compared with the national average, by CCG: England (with London inset). CCG, clinical commissioning group; IRR, incidence rate ratio.

Predicted peak timing (weeks) of bronchiolitis admission rates, by CCG: England (with London inset). CCG, clinical commissioning group.
Results of the multivariable regression models for CCG-level rates of admission and peak timings are displayed in online supplementary table S3. In mutually adjusted models, a greater IMD score was associated with higher rates of admissions at the CCG level, while higher log population density was associated with a slightly lower rate of admissions (figure 4). In total, 23% of the variation in incidence rates at the CCG level was explained by this model, η2
(2)=0.23 (95% CI 0.13 to 0.31). As shown in figure 5, IMD had a quadratic relationship with peak timing, (likelihood ratio test for the quadratic term,  (1)=19.6, p<0.0001); both low and high IMD scores were associated with earlier peak timing of bronchiolitis admissions. Higher log population density was associated with earlier peak timing. In total, 38.0% of the variation in peak timing at the CCG level was explained by this model, η2
(2)=0.38 (95% CI 0.27 to 0.46).
(1)=19.6, p<0.0001); both low and high IMD scores were associated with earlier peak timing of bronchiolitis admissions. Higher log population density was associated with earlier peak timing. In total, 38.0% of the variation in peak timing at the CCG level was explained by this model, η2
(2)=0.38 (95% CI 0.27 to 0.46).
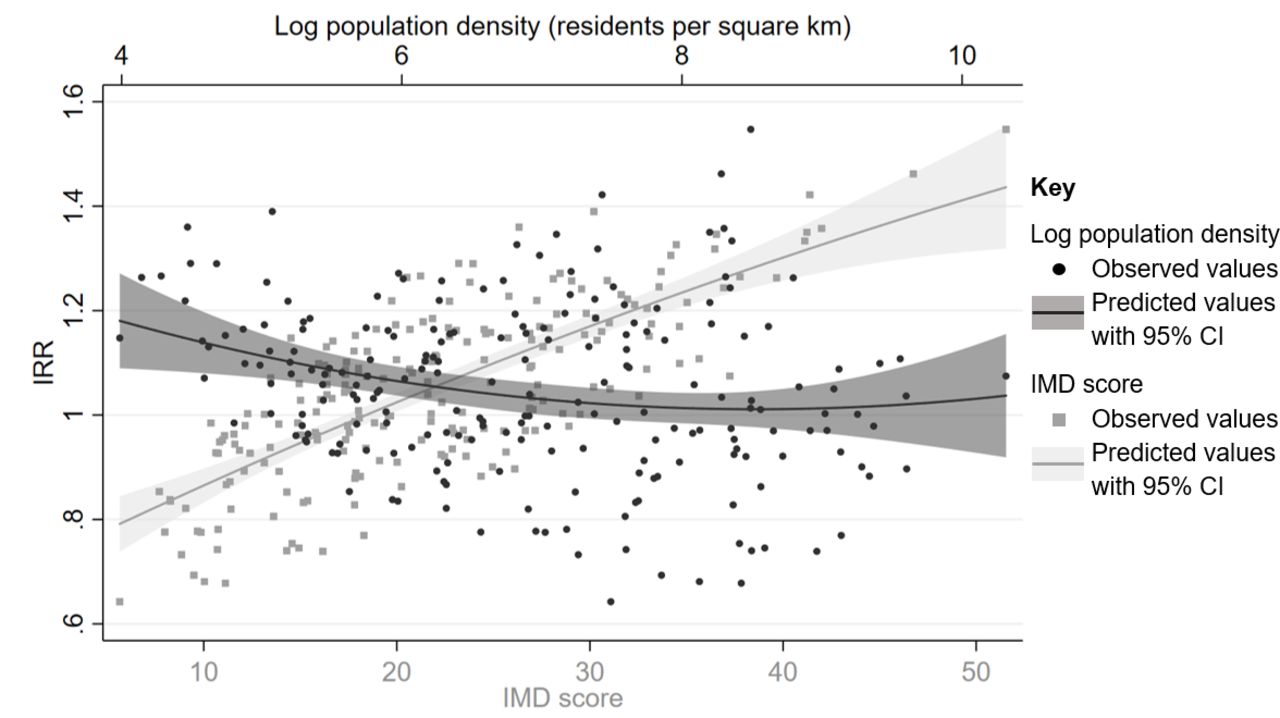
Observed and predicted variation in CCG-level rates of bronchiolitis hospital admissions compared with the National average, by IMD score and log population density. CCG, clinical commissioning group.

Observed and predicted peak timing of CCG-level bronchiolitis hospital admissions, by IMD score and log population density. CCG, clinical commissioning groups; IMD, Index of Multiple Deprivation.
Sensitivity analysis
To assess whether the uncertainty of the stage 1 estimation has an impact on our stage 2 inferences, we calculated bootstrapped SEs on 20% of the total sample and compared them to those obtained without bootstrap on the same data. The results showed very minimal differences, supporting the interpretations above, especially given the size of the whole sample (see online supplementary table S4).
The Moran’s I values were positive for the IRR residuals (I=0.28) and the peak timing residuals (I=0.37) of spatially proximal CCGs. With London-based CCGs excluded from the models, the adjusted association between IMD and peak timing and IRR of admissions broadly stayed the same (online supplementary tables S5,S6). The relationship between log population density and peak timing intensified slightly, while log population density had weaker association with IRR of admissions compared with the national average. When only the first admission by each child was included in analyses, regional amplitudes increased and peak epidemic timing was approximately 0.2 weeks earlier (online supplementary table S7). Relative differences in the seasonality of admissions across regions and CCG-level analyses remained broadly the same (online supplementary tables S8,S9).
Discussion
We found large variation in the size of the epidemic peak and accompanying admission rates for bronchiolitis, particularly when comparing London to the rest of the country. At week 51 (mid-December), rates of admissions were 2.4–2.5 times higher in Northern regions of the country compared with London. The shape of the epidemic curve was similar across regions, with admission rates increasing continually for 26 or 27 weeks of the year and epidemics peaking between week 50.3 and 51.4 (second and third weeks of December). At the smaller geographical (CCG) level, the difference in peak week increased to 3 weeks, with earlier peaks tending to occur in areas with higher population densities, such as London and Manchester.
Our cohort was created from HES APC, a national administrative dataset, which accounts for approximately 97% of births in England and allows for follow-up of the same individuals over time.9 HES APC does not capture private hospital activity among non-NHS funded patients. However, since emergency treatment is not typically covered under private medical insurance in the UK and NHS care is free at the point of need, we expect that very few children are admitted privately for acute illnesses like bronchiolitis.25 Hence, private provision of hospital services is unlikely to affect the representativeness of our results. Data in HES APC are recorded by clinical coders in each hospital and coding consistency may, therefore, vary by hospital according to diagnostic protocols and recording practices. Diagnosis of bronchiolitis is clinical and testing for viral aetiology is rarely performed in children presenting to hospital in England with symptoms of respiratory infections.26 However, we know from previous joint modelling of HES APC and laboratory surveillance data that the vast majority of bronchiolitis cases in infants are attributable to RSV.3 We could not account for the patterns of milder cases of bronchiolitis that do not result in a hospital admission. Diagnostic codes are rarely entered in emergency departments in England, and there is no national primary care database covering all English general practices.25 Nonetheless, with a large number of bronchiolitis admissions across the whole of England, our study provides a contextual understanding of this issue across the country.
We modelled admissions using harmonic functions, which allowed us to assess variability in the seasonality of bronchiolitis by area of the country. The predicted regional model produced seasonal patterns similar to the observed rates of admissions but underestimated the amplitude of the regional epidemics. Fitting splines may have improved estimation but would not have allowed us to straightforwardly estimate seasonal parameters. Using a single pair of sine/cosine terms in the model mirrored the single annual peak exhibited in the data and enabled us to estimate the peak epidemic week seen each year in England. We were unable to account for uncertainty in the estimates of incidence rates and peak timing in the second part of the CCG-level model; however, our results were shown to be robust by the sensitivity analyses.
Similar to findings from previous research,2 7 we find that one-fifth of the variation in admission rates across England was explained by socioeconomic factors, after controlling for population density. Socioeconomic deprivation is a broad facet associated with risk factors for severe RSV infection including tobacco smoke exposure, housing conditions and family size, among others.2 8 27 We used a small-area level indicator of deprivation, IMD, to capture socioeconomic deprivation of the children contributing to this study. IMD is widely used in studies of health outcomes in England and has been shown to be associated with bronchiolitis admission rates.2 28 Further research is required to establish which particular aspects of deprivation have the highest impact on bronchiolitis admissions. Converse to expectation, larger population density was associated with lower admission rates; however, sensitivity analyses showed that this relationship was driven by London-based CCGs. The difference in emergency admission rates in London compared with the rest of England is stark, but not a new finding—having previously been reported for a range of conditions.8 29 30 Plausible reasons for differential admission rates include primary care accessibility and availability, hospital bed availability and differences in admission thresholds.2 Data published by Public Health England show that, while rates of emergency admissions for children aged 0–4 are low in London, accident and emergency rates are higher than the national average, potentially reflecting regional differences in admission practices.31 Green et al 2 found that admissions for bronchiolitis have risen substantially over the last few decades and our updated analyses show a continuation of this trend. As examined elsewhere,2 32 it is likely that lowering admission thresholds have driven this increase rather than disease severity or increased incidence of bronchiolitis.
Our results suggest that population density is a stronger predictor of epidemic peak timing than of incidence rates, even after adjustment for IMD. Similar to the results of a RSV epidemic study in Connecticut,20 we found that higher population density (residents per km2) was associated with an earlier peak timing. Area-level socioeconomic deprivation had an inverted U-shaped association with peak timing, which may be indicative of shared factors between CCGs on the extremes of socioeconomic deprivation. Our model included just two predictors and more than 60% of the variation in the timing of epidemic peak remained unexplained. Figure 3 illustrates that the earliest peaks are in South London, Manchester and Birmingham—all urban areas with major national and international transport links. High levels of travel and increased contact and mixing among the population likely play a role in viral spread in these areas. Pitzer e t al 33 undertook detailed modelling of RSV epidemics across USA, noting associations between vapour pressure, temperature, precipitation and the timing of epidemics. Notably, even in a country with much greater climatic variation that the UK, Pitzer e t al 33 were unable to account for the finding that RSV activity begins in Florida, leading the authors to contemplate the potential role of population mixing.
In all, this nationwide descriptive analysis of bronchiolitis admissions has shown variation in the size and timing of the epidemic peak across England. Our findings have implications on preparedness for severe bronchiolitis. Given the gap in timing between peak epidemics across the country, messaging systems could be enacted to relay warnings from CCGs experiencing early peaked admissions to other areas. Warning systems could inform the distribution of prophylaxis or future vaccinations and be used to time simple public health messages, such as warning families to avoid taking their young infants into public spaces or encourage frequent handwashing for older siblings.34 At the very least, early warning systems could be implemented to prepare hospitals for an increased bronchiolitis case load. Future studies would profit from the inclusion of clinical factors unavailable in our dataset, such as a measure of bed availability and admission thresholds, as well as examining the impact of climate and pollution on the timing of admission rates. Further investigation of the incongruent patterns of admissions in London compared with the rest of the country is warranted.
Supplementary materials
Supplementary Data
This web only file has been produced by the BMJ Publishing Group from an electronic file supplied by the author(s) and has not been edited for content.
Footnotes
Contributors All authors designed the study and revised the paper. KML cleaned and analysed the data and drafted the paper. PH supervised the study.
Funding KML is funded by a Medical Research Council UK doctoral training studentship (MR/N013867/1). Research at UCL Great Ormond Street Institute of Child Health is supported by the NIHR Great Ormond Street Hospital Biomedical Research Centre. This research benefits from and contributes to the NIHR Children and Families Policy Research Unit, but was not commissioned by the National Institute for Health Research (NIHR) Policy Research Programme. This work uses data provided by patients and collected by the NHS as part of their care and support. The use of Hospital Episodes Statistics data was approved by the Health and Social Care Information Centre for the purpose of this study (DARS-NIC-393510-D6H1D-v1.11). Source data can be accessed by researchers applying to the Health and Social Care Information Centre for England. Copyright © 2018. Reused with the permission of the Health and Social Care Information Centre. All rights reserved.
Disclaimer The views expressed are those of the author(s) and not necessarily those of the NIHR or the Department of Health and Social Care.
Competing interests None declared.
Patient consent for publication Not required.
Provenance and peer review Not commissioned; externally peer reviewed.
Data availability statement Data may be obtained from a third party and are not publicly available. Authors do not have permission to share patient-level HES data. HES data are available from the NHS Digital Data Access Advisory Group (enquiries@nhsdigital.nhs.uk) for researchers who meet the criteria for access to confidential data.
Linked Articles
- Airwaves