Article Text

Abstract
Background Relapse continues to place significant burden on patients and tuberculosis (TB) programmes worldwide. We aimed to determine clinical and microbiological factors associated with relapse in patients treated with the WHO standard 6-month regimen and then evaluate the accuracy of each factor at predicting an outcome of relapse.
Methods A systematic review was performed to identify randomised controlled trials reporting treatment outcomes on patients receiving the standard regimen. Authors were contacted and invited to share patient-level data (IPD). A one-step IPD meta-analysis, using random intercept logistic regression models and receiver operating characteristic curves, was performed to evaluate the predictive performance of variables of interest.
Results Individual patient data were obtained from 3 of the 12 identified studies. Of the 1189 patients with confirmed pulmonary TB who completed therapy, 67 (5.6%) relapsed. In multipredictor analysis, the presence of baseline cavitary disease with positive smear at 2 months was associated with an increased odds of relapse (OR 2.3(95% CI 1.3 to 4.2)) and a relapse risk of 10%. When area under the curve for each multipredictor model was compared, discrimination between low-risk and higher-risk patients was modest and similar to that of the reference model which accounted for age, sex and HIV status.
Conclusion Despite its poor predictive value, our results indicate that the combined presence of cavitary disease and 2-month positive smear status may be the best currently available marker for identifying individuals at an increased risk of relapse, particularly in resource-limited setting. Further investigation is required to assess whether this combined factor can be used to indicate different treatment requirements in clinical practice.
- tuberculosis
- clinical epidemiology
Statistics from Altmetric.com
Key messages
What is the key question?
What clinical and microbiological factors are associated with relapse in patients with tuberculosis treated with the WHO standard 6-month regimen?
What is the bottom line?
Using the combined marker of cavitary disease and 2-month smear positivity, we can detect a group of individuals with a 10% risk of relapse.
Why read on?
Despite its poor predictive ability, cavitary disease and 2-month smear positivity may be the best currently available marker for identifying persons at higher risk for relapse, particularly in low-resource settings.
Introduction
WHO guidelines recommend that patients with new pulmonary tuberculosis (TB) be treated with a 6-month multidrug regimen administered in two phases: a 2-month intensive phase of daily isoniazid, rifampin, pyrazinamide and ethambutol followed by a 4-month continuous phase of daily isoniazid and rifampin (WHO standard regimen).1 2 Although this regimen is considered to be highly effective in treatment of drug-susceptible disease, close to 4% of patients treated with this regimen under trial conditions experience relapse and require retreatment within 2 years.3 4 This proportion is likely higher under programmatic conditions in high burden regions.4–6 According to WHO global estimates, approximately 430 000 previously treated patients returned to their healthcare provider with bacteriologically confirmed or clinically diagnosed relapse in 2015, representing 7% of all TB cases notified.7
Given the toll relapse takes on individual patients and TB programmes, simple, low-cost predictors of relapse are urgently needed, particularly in resource-limited settings. Prior studies have noted that patients having both cavitation and a positive culture at completion of 2 months of therapy are at an increased risk of relapse.8 9 Based on this evidence, the American Thoracic Society, Centers for Disease Control and Prevention, and Infectious Disease Society of America Clinical Practice (ATS/CDC/IDS) guidelines recommend extending the continuation phase for an additional 3 months for these patients.10 Until 2009, the WHO recommended treatment extension in patients with a positive sputum smear at the end of the second month treatment.1 2 More recent editions no longer carry this recommendation, likely due, in large part, to a 2010 systematic review and meta-analysis evaluating smear and/or culture status in predicting outcomes.11 This review found both sputum smear microscopy and mycobacterial culture during treatment to have low sensitivity and modest specificity in predicting relapse.11
Since 2009, several high-quality randomised controlled trials (RCTs) have been published that evaluate the WHO standard regimen and report standardised outcomes, including relapse.12–19 Individual patient data from three of these studies12–14 were published on the Critical Path TB Clinical Trial Data-Sharing Platform,20 providing an opportunity for a meta-analysis of individual patient data from phase III trials in which at least one group received the WHO standard regimen. The primary purpose of our study was to determine clinical and microbiological factors associated with relapse in patients treated with the WHO standard regimen. Our secondary aim was to evaluate the accuracy of each factor at predicting an outcome of relapse.
Methods
Search strategy and selection criteria
The studies considered for this individual patient-level data (IPD) meta-analysis were identified from a systematic review evaluating the efficacy of dosing schedules in first-line pulmonary TB therapy.21 Study selection included in that systematic review has been described elsewhere in detail.21 In brief, studies were restricted to high-quality RCTs with treatment regimens that used rifampin for 6 months or longer. For this analysis, studies were also restricted to a 20-year period from 1 March 1996 to 1 March 2016 given the limitations in trial data availability. To be consistent with current WHO recommendations, only studies reporting a trial arm using the WHO standard regimen were included in our analysis.
Data collection
Corresponding authors of all identified studies were contacted and invited to share trial data. Study data were included if authors agreed to submit individual patient data from published studies or if the individual patient data were available on the Critical Path TB Clinical Trial Data-Sharing Platform. We excluded studies that did not provide individual patient data in our analysis. We only used data from participants assigned to the control arms in each study, that is, we excluded participants from the various intervention arms. Participants were included if they had: (1) successfully completed adequate treatment with the WHO standard regimen for newly diagnosed, microbiologically confirmed, pulmonary TB and (2) were classified as either having treatment success or relapse at the end of the study follow-up period.
The individual patient data obtained included patient demographics, clinical markers of disease severity, treatment regimen doses and treatment outcomes. We checked all data for internal consistency and compared it with the trial protocol and published reports. Any inconsistencies were checked with the data provider. Variables from each original database were extracted, their meaning and coding verified and then mapped to a common set of variables for all patients. Missing data were treated as such (ie, imputation was not performed).
Statistical analysis
Our primary outcome of interest was relapse, defined as positive smears and/or cultures requiring therapy after successful treatment completion, according to specific study protocols. Participants were not categorised as relapsed if genotyping demonstrated reinfection. Participants re-treated without full microbiological confirmation were counted as relapsed if they had been classified as such in their study’s primary analysis. The primary analysis was restricted to participants included in the original studies’ per-protocol analyses. A sensitivity analysis with all participants included in the original studies’ modified intention to treat analyses was also performed. Additional analyses also examined relapse determined at 12 months post-treatment completion and the combined outcome of relapse and reinfection for all included studies.
We considered two types of patient-level factors in our meta-analysis: (1) patient characteristics and (2) combinations of characteristics. Patient-level factors were chosen a priori and based on clinical relevance as well as clinical expertise and experience. We performed a one-step IPD meta-analysis, using random intercept regression models to estimate the pooled OR and 95% CIs of relapse for each type of patient-level factor.22 We performed both crude and multipredictor analyses. For crude analysis, an unadjusted mixed logistic regression model was used to estimate ORs for each prespecified marker. For multipredictor analysis, mixed logistic regression was performed including covariates chosen a priori to account for potential confounding, with the study as a random effect.
Using the multipredictor regression models, we generated receiver operating characteristic (ROC) curves to express the predictive accuracy of each models at its ability to distinguish between patients who will relapse from those who will experience treatment success. We calculated the area under the curve (AUC) or c-statistic for each ROC curve and performed bootstrap resampling among all patients to obtain 95% CIs. The predictive power of each model was assessed using AUC and compared using DeLong’s Test.23 The negative predictive values (NPV), positive predictive values (PPV) and maximum sensitivity, when specificity was set to 0.95 and 0.80, were also determined. For added insight regarding classification by the different models, we also assessed the next classification index (NRI). Reclassification tables for patients who did or did not experience relapse were constructed using <5%, 5% to 15% and >15% predicted probability categories. Heterogeneity between studies was accounted for by having the studies as a random effect.
Analyses were conducted using RStudio (V.1.0.44: The R Foundation for Statistical Computing).24 Random intercept logistic regression models were created using lme4 (V.1.1–13).25 Receiver operating curve analysis was performed using pROC (V.1.9.1).26 Bootstrap validation and NRI calculations were performed using rms (V.5.1.0).27 P values less than 0.05 were considered statistically significant in both unadjusted and multipredictor analyses.
The study was performed per PRISMA-IPD guideline recommendations28 and prospectively registered in the PROSPERO database (CRD42016040050).
Results
Of the 56 studies identified in the systematic review, 12 were eligible for inclusion in our analysis. Ultimately, patient-level data were obtained from three recent multicentre RCTs available on the Critical Path TB Clinical Trial Data-Sharing Platform (figure 1).12–14 Characteristics of excluded studies are presented in the appendix table S1 in online supplementary appendix). Table 1 summarises the characteristics of the included studies. Each of the three studies was a double-blind, multicentre, phase III trial conducted in resource-limited, high TB incidence countries. The ReMoxTB and RIFAQUIN trials had defined relapse at a follow-up duration of 18 months; OFLOTUB used 24 months and also provided outcomes determined at 18 months.
Supplementary file 1

Flowchart of study and participant selection.
Characteristics of studies meeting inclusion criteria
HIV status was assessed at enrolment in all three studies. Individuals coinfected with HIV who required antiretroviral therapy (ART) were not eligible for the Oflotub and ReMoxTB trials. The RIFAQUIN trial excluded all patients with resistance to isoniazid, rifampin, ethambutol or fluoroquinolones at study entry and provided directly observed therapy at the health facility during the intensive phase and relative supervised treatment during the continuation phase. ReMoxTB excluded patients with rifampin or fluoroquinolone resistance and also administered therapy on a daily-supervised basis. OFLOTUB excluded patients with rifampin resistance and provided directly observed therapy 6 days a week during the intensive phase, and then assessed adherence every 2 week by a count of tablets remaining in weekly treatment boxes. MIRU-VNTR confirmation data was used to distinguish between relapse and reinfection, except in the OFLOTUB trial where genotyping results were not available.
Combining the control arms of the three trials yielded data on 1760 participants, all assigned to receive WHO standard therapy. Of those, 1189 were eligible for our primary analysis, including 67 (5.6%) that relapsed (figure 1). Pooled demographic and clinical characteristics of the total population are shown in table 2, with risk of relapse by specified factors shown in table 3.
Pooled baseline characteristics of patients included in the analysis
Risk of relapse by specified factor
As seen in table 4, HIV coinfection had the highest odds of relapse in univariable analysis among patient characteristics (OR 2.2 (95% CI 1.2 to 3.9)). When combinations of characteristics were examined, the odds of relapse for those with baseline cavitary disease and positive smear at 2 months were very similar to the odds of relapse for those with baseline cavitary disease and 2 month culture positivity (OR 2.3 (95% CI 1.3 to 4.2) vs OR 2.3 [95% CI 1.3 to 4.0)). When HIV coinfection was combined with the presence of positive culture at 2 months and baseline cavitary disease, the odds of relapse was 5.7 (95% CI 1.7 to 17.9); however, due to limited sample size, CIs were quite wide (n combined risk factor=16, n relapse=4).
Summary of association of patient level factors with treatment relapse
In multipredictor analysis, HIV coinfection (OR 2.6 (95% CI 1.4 to 4.6)), the presence of baseline cavitary disease with positive smear at 2 months (OR 2.3 (95% CI 1.3 to 4.3)) and the presence of baseline cavitary disease with positive culture at 2 months (OR 2.1 (95% CI 1.2 to 3.8)) had the highest odds of relapse.
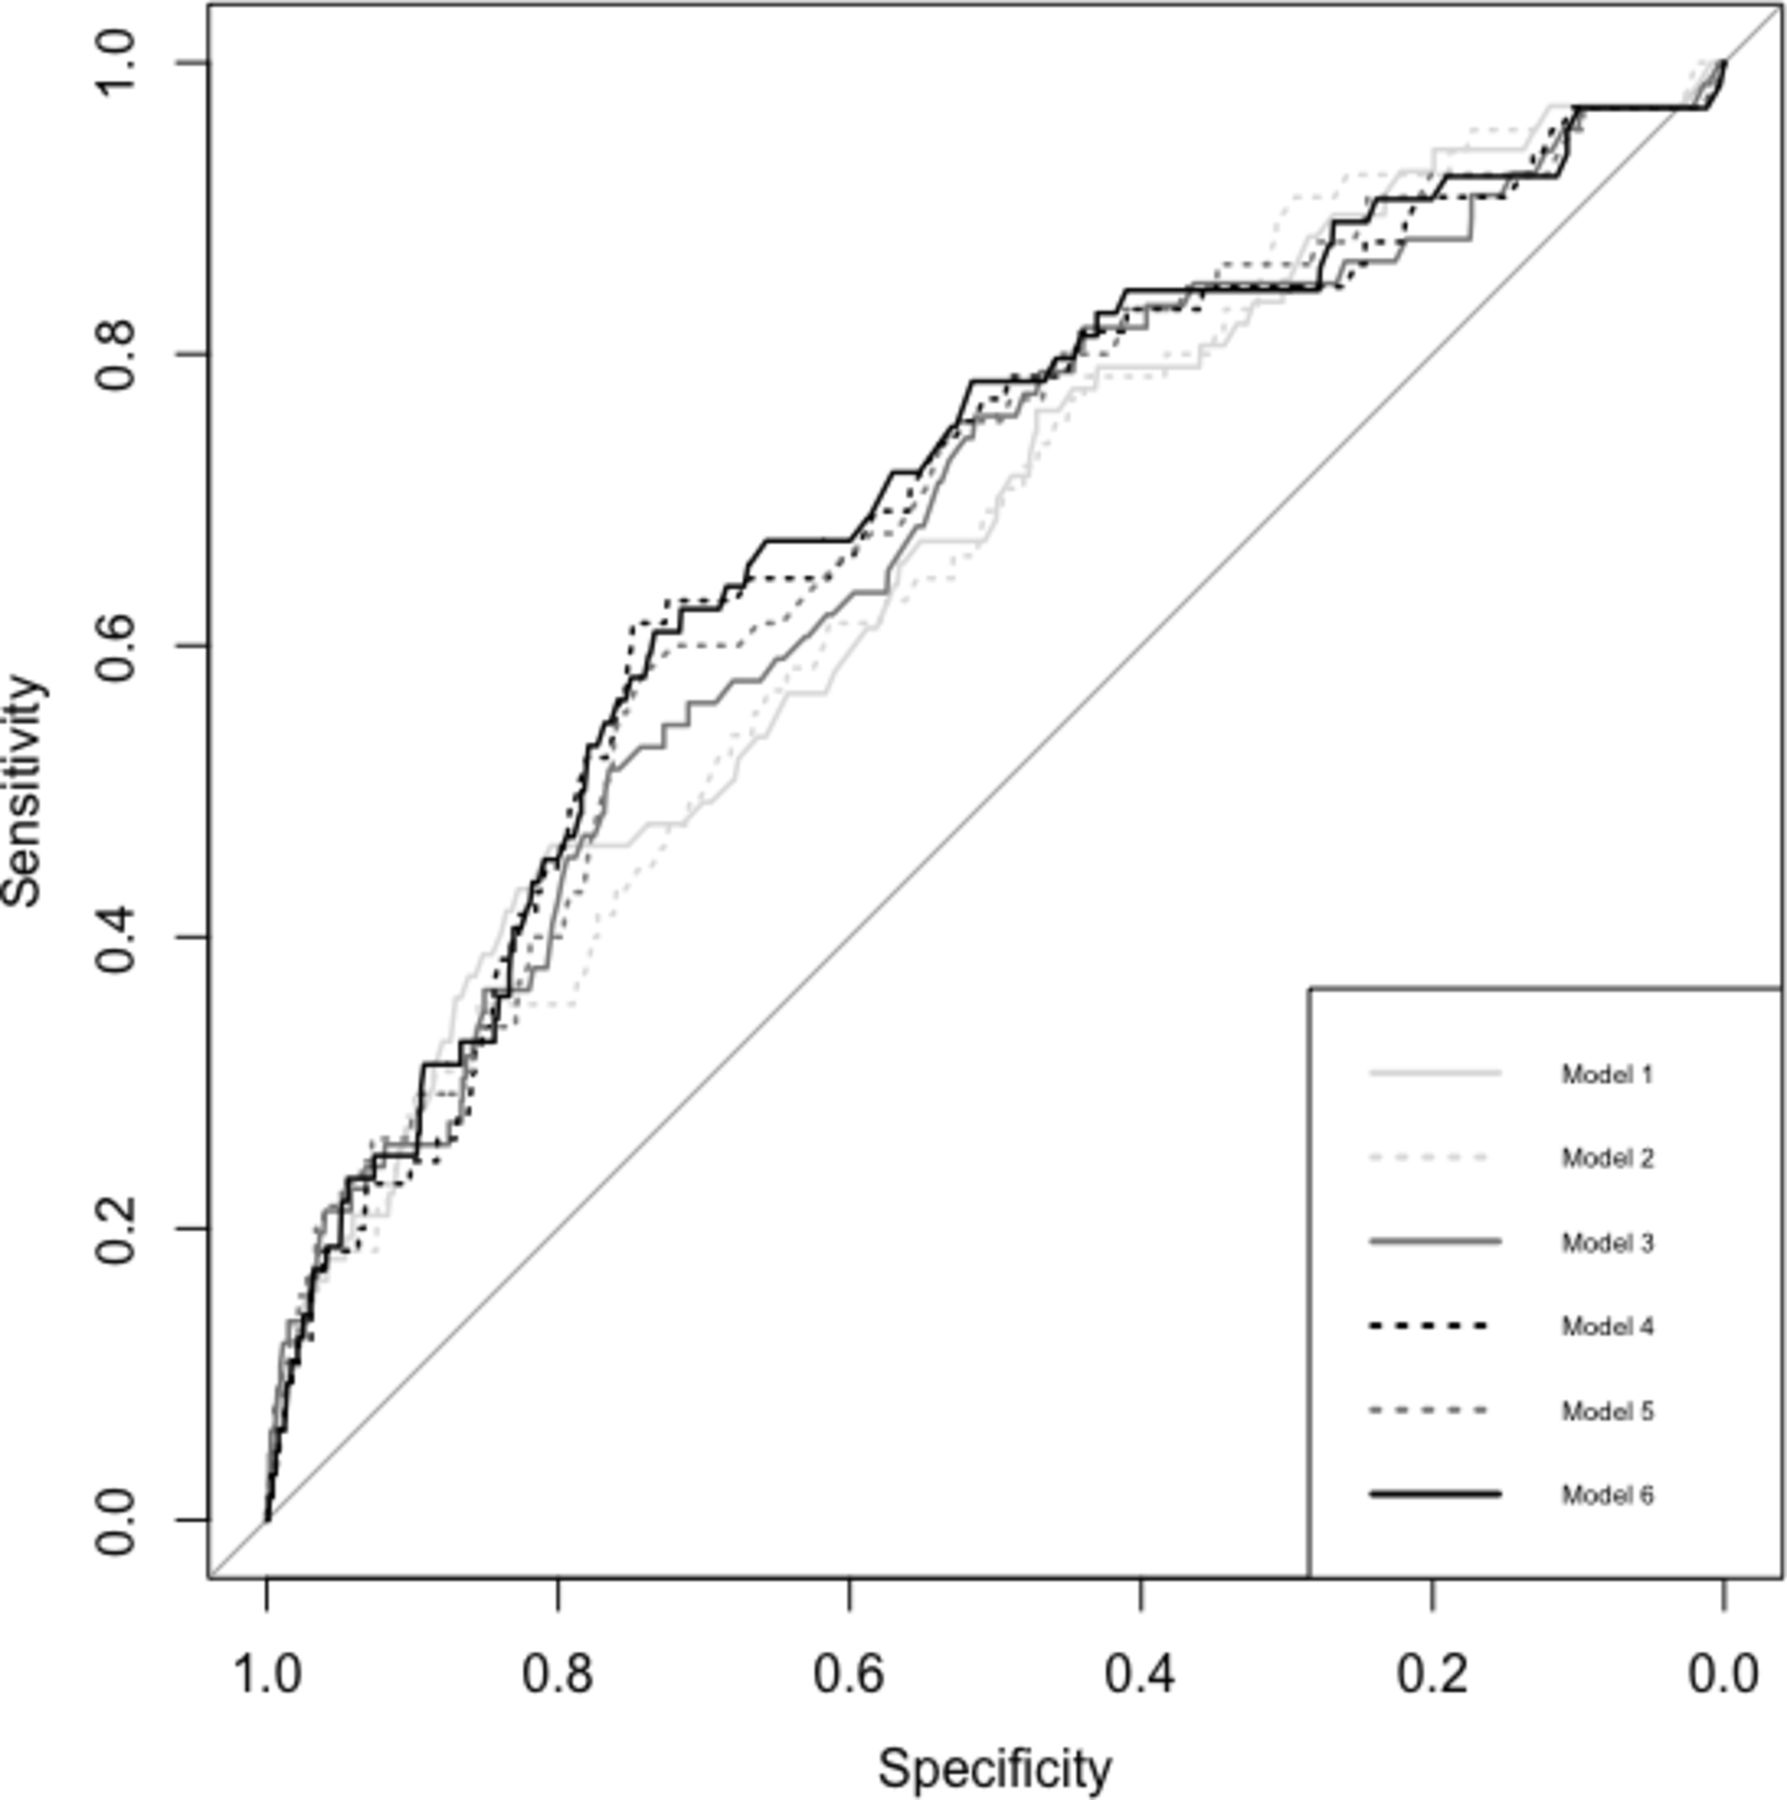
Comparative analysis of ROC curves is summarised in figure 2. As shown in table 5, Model 1 (the reference model) contained age, sex and HIV status and yielded a fair AUC value of 0.66 (95% CI 0.59 to 0.73). The addition of clinical risk factors, or combinations of clinical risk factors, resulted in small but non-statistically significant increases in predictive power (DeLong’s test p>0.05). Bootstrap validation indicated that our results showed little evidence of over fitting, that is, the optimism in the estimated AUC was less than 0.04 (table S2 in online supplementary appendix). table 6 shows sensitivity for held specificities for all multipredictor models.

Performance of each of the multipredictor models in predicting an outcome of relapse.
Summary of multipredictor models and ROC curves
Multipredictor model for relapse at set specificities
Overall, results with NRI were similar to our findings with AUC; few participants had clinically meaningful changes in risk categories, which resulted in non-significant net reclassification improvement (table S3 in online supplementary appendix).
Our sensitivity analyses with the modified intention-to-treat analysis set, with relapse determined at 12 months post-treatment completion, and when combining the outcomes of relapse and reinfection for all studies, yielded results very similar to those in our primary analysis (supplementary tables S4–S7 in online supplementary appendix).
Discussion
Over the past two decades, several studies have reported 2-month culture positivity or cavitary disease as independent predictor of relapse. Indeed, recent ATS/CDC/IDSA guidelines cite a 20% relapse rate in patients with cavitary disease at baseline and 2-month sputum culture positivity.10 However, studies cited for these guidelines did not use daily or five times a week therapy under trial conditions. Instead, the cited studies used two times a week regimens or analysed outcomes under cohort conditions and were limited by a small sample size.8 9 Using individual patient data meta-analysis, we analysed clinical and microbiological factors associated with relapse in patients with new pulmonary TB treated with the WHO Standard Regimen. The most notable finding of our study was that the presence of cavitary disease with 2-month positive smear status was associated with increased odds of relapse, and this association was maintained even after adjusting for key covariates and in numerous sensitivity analyses. Moreover, the strength of this association was similar to that of commonly accepted determinants of relapse: HIV coinfection and cavitary disease with 2-month positive culture.
While our findings demonstrated that HIV coinfection, cavitary disease with 2-month positive culture and cavitary disease with 2-month positive smear were associated with increased odds of relapse, we also identified that the ability of these markers to reliably discriminate between individuals who will or will not experience an outcome of relapse remains modest. All clinical and microbiological markers investigated in our analysis had poor sensitivities when specificity was set to 0.95 and 0.80 and lacked adequate positive predictive values, indicating that despite having the risk factor, an individual will not necessarily experience relapse. The accuracy of our models presented in table 4 is similar to that recently reported by Phillips et al, for sputum-based markers of bacillary clearance.29 Horne et al also reported that 2-month culture and 2-month smear status were poorly sensitive and moderately specific as predictors of relapse.11 Overall, these results imply that discrimination between low-risk and higher-risk patients remains poor for current clinical and microbiological at predicting an outcome of relapse and better predictors are needed.
Until improved markers are available, the combined marker of cavitary disease and 2-month smear positivity may be the best currently available option for identifying persons at higher risk for relapse, particularly in low-resource settings. Using 2-month smear and chest radiography results, we were able to identify a subgroup of participants with a relapse risk of at least 10%, which likely translates to higher risk under programmatic conditions. Given the higher risk of relapse observed in this group and the widespread availability of chest radiography30 and smear microscopy, our findings suggest that this combined marker be used in future trials to assess which patients may benefit from treatment prolongation or closer post-treatment follow-up.
There were several limitations to this study. First, we were only able to obtain individual patient data from 3 of the 12 eligible studies. Five principal investigators could not be contacted despite extensive efforts. One investigator agreed to forward the data; however, the data were not received. Another investigator was unable to be reached following initial contact. Two investigators refused to participate; reasons for not participating included lack of resources and time constraints. Since not all eligible patient data were included in our analysis, retrieval bias may have been introduced.31 Unfortunately, due to limited reporting of outcomes within subgroups, we were unable to test if results including the additional trials differed from our findings, although as seen when comparing table 1 with online supplementary table S1, the characteristics and outcomes of patients in the included and excluded studies are similar. We were able to perform a meta-analysis of relapse proportions using the published study data and found the relapse proportion to be 4% (95% CI 3% to 6%), which our relapse proportion of 5.6% falls within (figure S1 in online supplementary appendix). The small number of available studies also prevented reliable testing for heterogeneity; this was accounted for by having the studies set as a random effect. From the obtained data, we were missing variables that have been previously identified as factors increasing the risk of relapse: <5% wt gain during the first 2 months of treatment and diabetes mellitus.32–35 Regardless, we did have near complete and high-quality data on other key patient characteristics.
A second limitation is that variation in study protocols meant we were unable to distinguish between true relapse versus reinfection for all cases. This could have biased the estimation of the effect of several demographic and clinical factors towards the null; it might also have resulted in an overestimation of relapse risk associated with HIV coinfection. Given that relapse is more likely to occur soon after treatment completion,36 we performed a sensitivity analysis examining outcomes at 12 months post-treatment completion with no substantive change in results. Last, we analysed the per-protocol analysis sets from RCTs. This clearly limits the generalisability of these data to programmatic conditions; however, we felt that an understanding of per-protocol outcomes under idealised conditions would be key when informing programmatic policy.
There were also a number of strengths to this study. First, by using individual patient data, we had greater power to identify predictors of relapse than traditional, aggregate data meta-analyses.37 Second, the individual patient data were of high quality and came from three independent, large, high-quality multinational RCTs, each with detailed reporting and robust, microbiologically confirmed treatment outcomes. Using these detailed data, we were able to analyse participants who all received identical treatment regimens and duration of therapy. Finally, we presented results using measures of association and of diagnostic accuracy, and these results were maintained in numerous sensitivity analyses.
These individual patient data meta-analysis of 1189 patients treated with standard, first-line therapy suggests that individuals with the presence of both cavitary disease and 2-month positive smear status are at an increased risk of relapse, even after accounting for other risk factors. These tests, which are widely available even in resource-limited settings, may be the best currently available for identifying persons at high risk of relapse, and further investigation is required to assess whether this combined factor can be used to indicate different treatment requirements in clinical practice.
Acknowledgments
We would like to thank Leslie Chiang for his assistance with the initial data cleaning.
References
Footnotes
Contributors JCJ, FAK and KR initiated the project and were responsible for the design of the protocol. KR was responsible for data management and performed the statistical analysis with advice from RFB and AB. KR, RFB, AB, JRC, DM, FAK and JCJ interpreted the data. KR and JCJ wrote the initial draft of the manuscript. RFB, AB, JRC, DM and FAK were responsible for critical revisions of the manuscript and provided important intellectual content. All authors gave their final approval of the version submitted for publication.
Funding JCJ is supported by the Michael Smith Foundation for Health Research. FAK received salary support from the Fonds de Recherche Québec Santé. The researchers were independent of the funders, which had no role in this study.
Competing interests None declared.
Patient consent Not required.
Ethics approval University of British Columbia Clinical Ethics Review Board (H16-01282).
Provenance and peer review Not commissioned; externally peer reviewed.