Article Text

Abstract
Background Perturbed iron homeostasis is a risk factor for tuberculosis (TB) progression and an indicator of TB treatment failure and mortality. Few studies have evaluated iron homeostasis as a TB diagnostic biomarker.
Methods We recruited participants with TB, latent TB infection (LTBI), cured TB (RxTB), pneumonia (PN) and healthy controls (HCs). We measured serum levels of three iron biomarkers including serum iron, ferritin and transferrin, then established and validated our prediction model.
Results We observed and verified that the three iron biomarker levels correlated with patient status (TB, HC, LTBI, RxTB or PN) and with the degree of lung damage and bacillary load in patients with TB. We then built a TB prediction model, neural network (NNET), incorporating the data of the three iron biomarkers. The model showed good performance for diagnosis of TB, with 83% (95% CI 77 to 87) sensitivity and 86% (95% CI 83 to 89) specificity in the training data set (n=663) and 70% (95% CI 58 to 79) sensitivity and 92% (95% CI 86 to 96) specificity in the test data set (n=220). The area under the curves (AUCs) of the NNET model to discriminate TB from HC, LTBI, RxTB and PN were all >0.83. Independent validation of the NNET model in a separate cohort (n=967) produced an AUC of 0.88 (95% CI 0.85 to 0.91) with 74% (95% CI 71 to 77) sensitivity and 92% (95% CI 87 to 96) specificity.
Conclusions The established NNET TB prediction model discriminated TB from HC, LTBI, RxTB and PN in a large cohort of patients. This diagnostic assay may augment current TB diagnostics.
- iron homeostasis
- diagnostic biomarker
- neural network model
- tuberculosis
- receive operating characteristic (roc)
This is an open access article distributed in accordance with the Creative Commons Attribution Non Commercial (CC BY-NC 4.0) license, which permits others to distribute, remix, adapt, build upon this work non-commercially, and license their derivative works on different terms, provided the original work is properly cited, appropriate credit is given, any changes made indicated, and the use is non-commercial. See: http://creativecommons.org/licenses/by-nc/4.0/.
Statistics from Altmetric.com
- iron homeostasis
- diagnostic biomarker
- neural network model
- tuberculosis
- receive operating characteristic (roc)
Key messages
What is the key question?
Can iron homeostasis be applied as a biomarker for sensitive and accurate tuberculosis (TB) diagnosis?
What is the bottom line?
Based on the combination of serum iron, ferritin and transferrin biomarkers, we successfully built an optimal neural network (NNET) model that discriminated TB from healthy control, latent TB infection, cured TB and non-TB pneumonia in a large cohort of participants.
Why read on?
To the best of our knowledge, our NNET model with satisfactory diagnostic accuracy and sensitivity is the first to be constructed based on a three-iron biomarker signature and validated using data from a large cohort of participants.
Introduction
Tuberculosis (TB), caused by Mycobacterium tuberculosis (MTB) bacterial infection, is a major global health burden. MTB infects one-third of the global population and is responsible for ~1 570 000 deaths annually.1 Conventional diagnostic methods, including sputum smear microscopy and MTB culture, are time-consuming and have unsatisfactory sensitivities. Early TB diagnosis with high accuracy and sensitivity is, however, vital for patient outcomes and prevention. The recently developed Xpert MTB/RIF (Cepheid, Sunnyvale, California, USA) assay is the only approach recommended by the WHO for the rapid diagnostic testing of TB and rifampicin resistance. The technique uses real-time PCR and molecular beacon technology, which is not affordable worldwide, particularly in developing countries.2 3 The Mantoux tuberculin skin test and interferon-gamma release assay (IGRA) are useful in identifying latent TB infection (LTBI) but are poor predictors for the transformation of LTBI to active TB.4 5 Therefore, novel TB diagnostic methods based on TB-associated biomarkers and with rapid, non-sputum, inexpensive and accurate features are urgently required.
Anaemia is a common comorbidity with TB, affecting 32%–86% of patients with TB.6 7 Several investigations have clarified the intricate host–pathogen iron competition in early MTB infection.8–10 A hallmark of TB-associated anaemia is the ‘iron delivery problem’, in which absorbed dietary iron is retained in macrophages, rather than released from intestinal enterocytes.7 11 Perturbed iron homeostasis is a risk factor for TB progression among household contacts12 or HIV-infected individuals13 and may be an indicator of treatment failure and even mortality in affected patients.14 15 To the best of our knowledge, although previous studies have suggested the potential use of serum ferritin levels for TB diagnostic purpose,16 other iron homeostasis markers, either individually or in combination, have not been previously examined for TB diagnosis.
The present study investigated biomarkers of iron homeostasis, including serum iron, ferritin and transferrin in healthy controls (HCs), and patients with TB, LTBI, non-TB pneumonia (PN) and cured TB (RxTB). Our aim was to built a model in which iron homeostasis biomarkers can be applied to differentiate patients with TB from other participants, and this model was validated in an independent cohort of 967 participants.
Methods
Ethics statement
Written informed consent was provided by all study participants.
Participant definition and classification
The participants were recruited from the Shenzhen Third Hospital (Shenzhen, China) and Guangzhou Chest Hospital (Guangzhou, China) between January 2014 and June 2017. All participants underwent clinical assessment at recruitment, including chest radiography, comorbidity assessment, IGRA and sputum microbiological examination by acid fast bacilli (AFB) staining and MTB culture. The involved participants were divided into two groups. The first group (discovery cohort) consisted of 883 participants, including 316 with definite TB, 167 with LTBI, 100 with RxTB, 100 with PN and 200 HC participants (table 1, figure 1). The second group prospectively enrolled 967 participants, in which patients coinfected with HIV and those who did not fulfil enrolment criteria were excluded. The eligible participants in the second group were classified as definite TB, probable TB, participants without TB (non-TB) and those with a questionable diagnosis (table 1). Non-TB cases include PN, asthma and acute exacerbations of chronic obstructive pulmonary disease. In the evaluation process, all participants with definite and probable TB were grouped as TB, whereas participants with a questionable diagnosis were excluded from the final analysis (figure 1).
Definitions to classify study participants
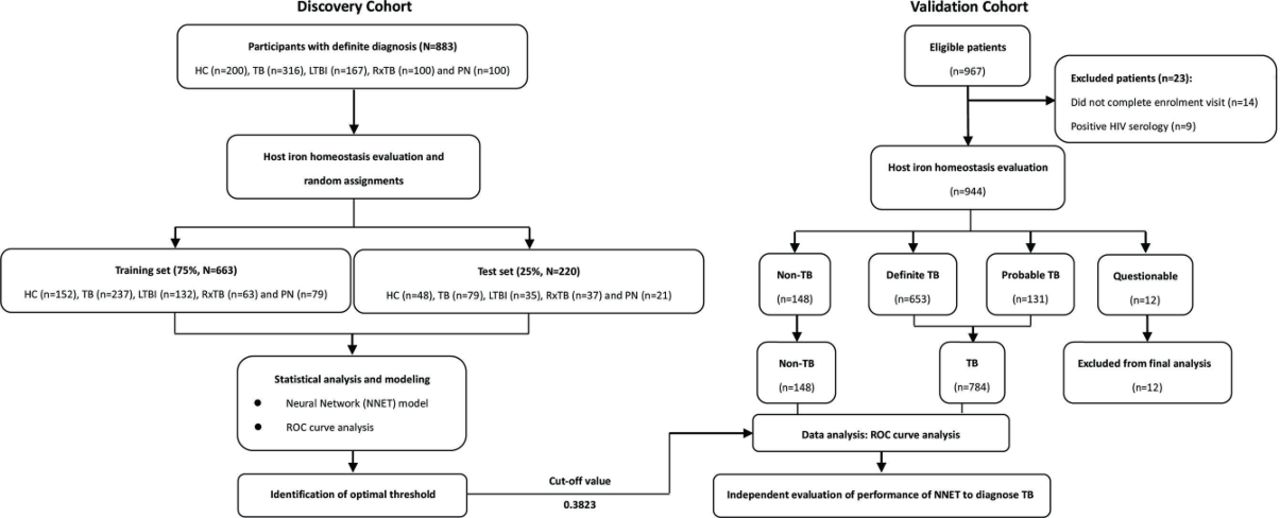
Study design and numbers of participants included in the discovery and validation cohorts. Participants in the first group were divided randomly at a 3:1 ratio. All patients with TB in the first group were classified with definite TB. In the valida tion group, non-TB cases included PN, asthma and acute exacerbations of chronic obstructive pulmonary disease. ‘Questionable’ represents participants without a clarified diagnosis. All definite TB and probable TB participants were classified together as TB. HC, healthy control; LTBI, latent tuberculosis infection; NN, neural network; PN, pneumonia; ROC, receiver operating characteristic; RxTB, cured TB; TB, tuberculosis.
Laboratory procedures
Peripheral whole-blood samples (5 mL) were collected from participants in vacuum blood collection tubes (BD Vacuntainer), transported at 4°C and processed within 2 hour of collection. Sera were separated by centrifugation at 500 g for 5 min and stored at −80 °C prior to use. Sera were further processed with commercial kits for serum iron (DiaSys, Holzheim, Germany), ferritin (Siemens, Munich, Germany) and transferrin (Leadman, Beijing, China) analyses, according to the manufacturer’s instructions. Subsequently, the serum iron and transferrin levels were determined using an automatic biochemical analyser (Siemens, Advia 2400). The ferritin levels were determined using an automatic chemiluminescence analyzer (Siemens, Advia centaur XP).
Sputum samples were collected from participants and assessed by Ziehl-Neelsen staining. MTB culture analysis was performed using the BACTEC MGIT 960 system (Becton Dickinson, Sparks, Maryland, USA). The isolated MTB was confirmed by Ziehl-Neelsen staining. T cell responses specific to interferon-γ were detected by enzyme-linked immunospot assay (ELISPOT), as previously described.17
High-resolution CT (HRCT) and AFB scores
HRCT scans were evaluated by experienced specialists, including a chest physician and two independent radiologists, who scored cases (ranging between 0 and 14) based on the distribution and percentage of parenchymal abnormalities, as previously described.18 Lung damage in patients with TB was directly quantified using HRCT scores on a scale of 0–3 for mild, 4–7 for moderate and 8–14 for severe.
According to the American Thoracic Society guidelines19 and our previously study,20 AFB-positive results were graded as follows: rare (1+, 1–9 AFB per 100 fields), few (2+, 1–9 AFB/10 fields), moderate (3+, 1–9 AFB/field) and numerous (4+, 9 AFB/field).
Statistical analysis and modelling
Differences in the concentrations of iron homeostasis-related biomarkers between participants with TB and control cohorts were evaluated by one-way analysis of variance and Dunnett’s test. Model construction and receiver operating curve (ROC) analysis were implemented using log2-transformed values.
A neural network (NNET) model was established using the R package ‘caret’ to discriminate TB from all other clinical phenotypes. The data on serum iron, ferritin and transferrin levels from the first group of participants were divided randomly at a 3:1 ratio. Data from the larger (3/4) subset were used for modelling (training set), whereas data from the smaller subset (1/4) were used as the test set. The modelling of a NNET typically reflects the complexity of the problem that is being solved and how much training data are available, as a complex model has more parameters than a simple model. Weight decay regularisation was used to access and minimise classification errors, avoid overfitting and produce interpretable results. Following a random internal 10-fold cross-validation by five times, the final layer and weight decay of the model were selected as 5 and 0.1, respectively. Following prediction by the NNET model, a probability for each observation was obtained, ranging between 0 and 1. To obtain the required specificity and sensitivity, the optimal threshold was determined using the Youden’s index with the R package ‘pROC’. The model performance was evaluated by: (A) accuracy and kappa values from cross-validation during model training and by (B) area under the curve (AUC) analysis and confusion matrix on model prediction/validation. Calibration of the models was measured by the construction of calibration curves and computation of the Hosmer-Lemeshow goodness-of-fit χ2 statistic. Additionally, a detailed description of NNET model building was provided in online supplementary text 1.
Supplemental material
Results
Iron homeostasis biomarkers are differentially expressed in patients with TB and controls
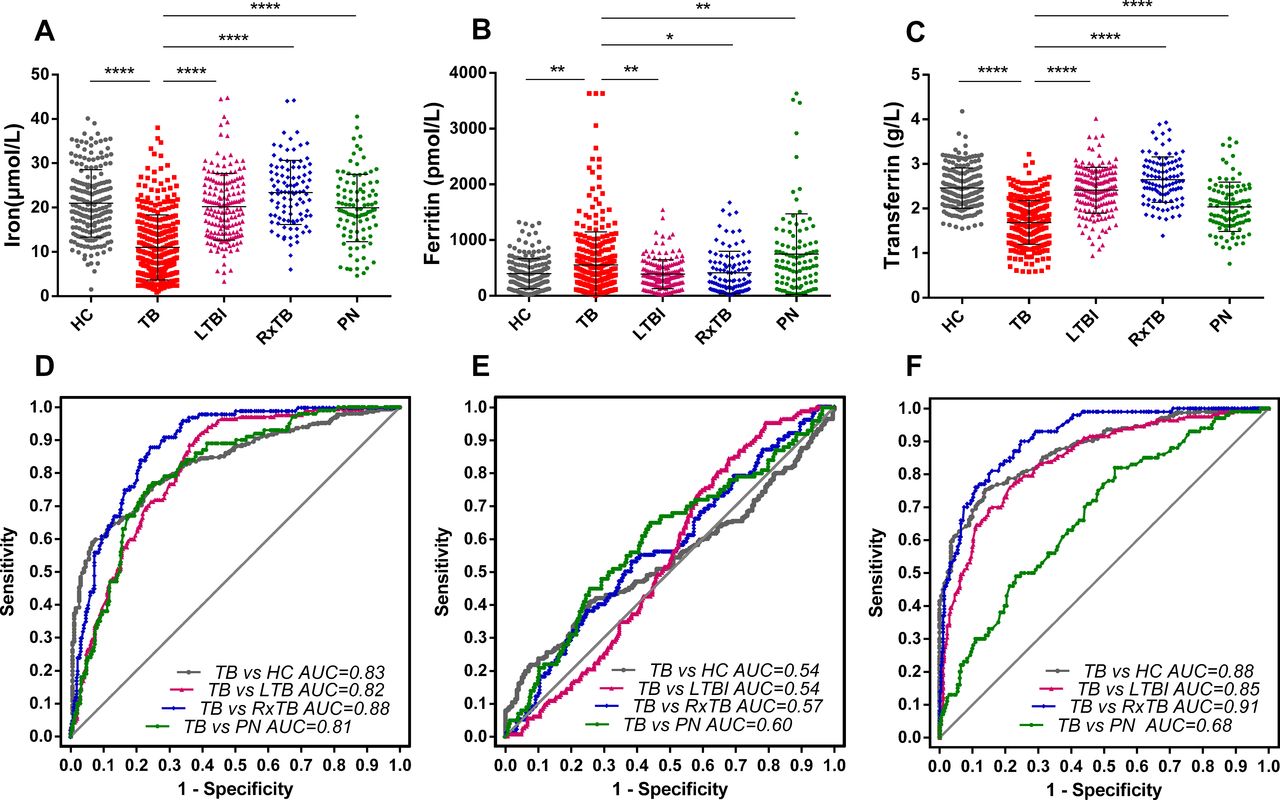
We recruited two groups of participants from two hospital centres and collected their clinical and demographic information (table 1, online supplementary table 1). We then measured serum iron, ferritin and transferrin levels in the patient sera. Data from the first group indicated that the levels of all three biomarkers differed significantly (p<0.05) between those with definite TB and controls. Specifically, the serum iron and transferrin levels were significantly lower in those with definite TB compared with those with HC, LTBI, RxTB and PN (figure 2A, C), and the ferritin levels were significantly higher in those with definite TB compared with those with HC, LTBI and RxTB but lower than those with PN (figure 2B). In addition, following further analysis, we found that it was possible to apply serum iron and transferrin individually to distinguish TB from HC, LTBI and RxTB (All AUC >80%, figure 2D, F); however, the result from applying ferritin as a biomarker was unsuitable (figure 2E).

Iron homeostasis biomarker levels in serum samples of patients in the first group and ROC plots for the diagnosis of TB. Representative plots showing iron (A and D), ferritin (B and E) and transferrin (C and F) levels between HC, TB, LTBI, RxTB and PN. Comparisons between the TB cohort and each of the other cohorts were determined by one-way analysis of variance and Dunnett’s multiple comparison test. All patients with TB in the first group were classified as definite TB. Data are expressed as the means±SE of the mean. *P<0.05; **p<0.01; ****p<0.0001. AUC, area under the ROC curve; HC, healthy control; LTBI, latent tuberculosis infection; PN, pneumonia; ROC, receiver operator characteristic; RxTB, recovered tuberculosis.
Further analysis of the HRCT and AFB results of the patients with TB from the first group unexpectedly showed significantly higher ferritin and lower transferrin levels in those with severe lung damage than those with TB with only mild or moderate lung damage (figure 3B, C); however, the difference in iron levels between all three groups of patients with TB was not significant (figure 3A). When comparing the rare AFB density, we found that higher ferritin and lower transferrin levels were significantly associated with a higher AFB score (4+) (figure 3E, F). Following TB treatment for 1 month, all three iron markers returned to normal (figure 3G–I), which is consistent with a previous study.7 These findings suggest that the serum levels of the three iron homeostasis biomarkers (serum iron, ferritin and transferrin) may be useful for the diagnosis of TB.
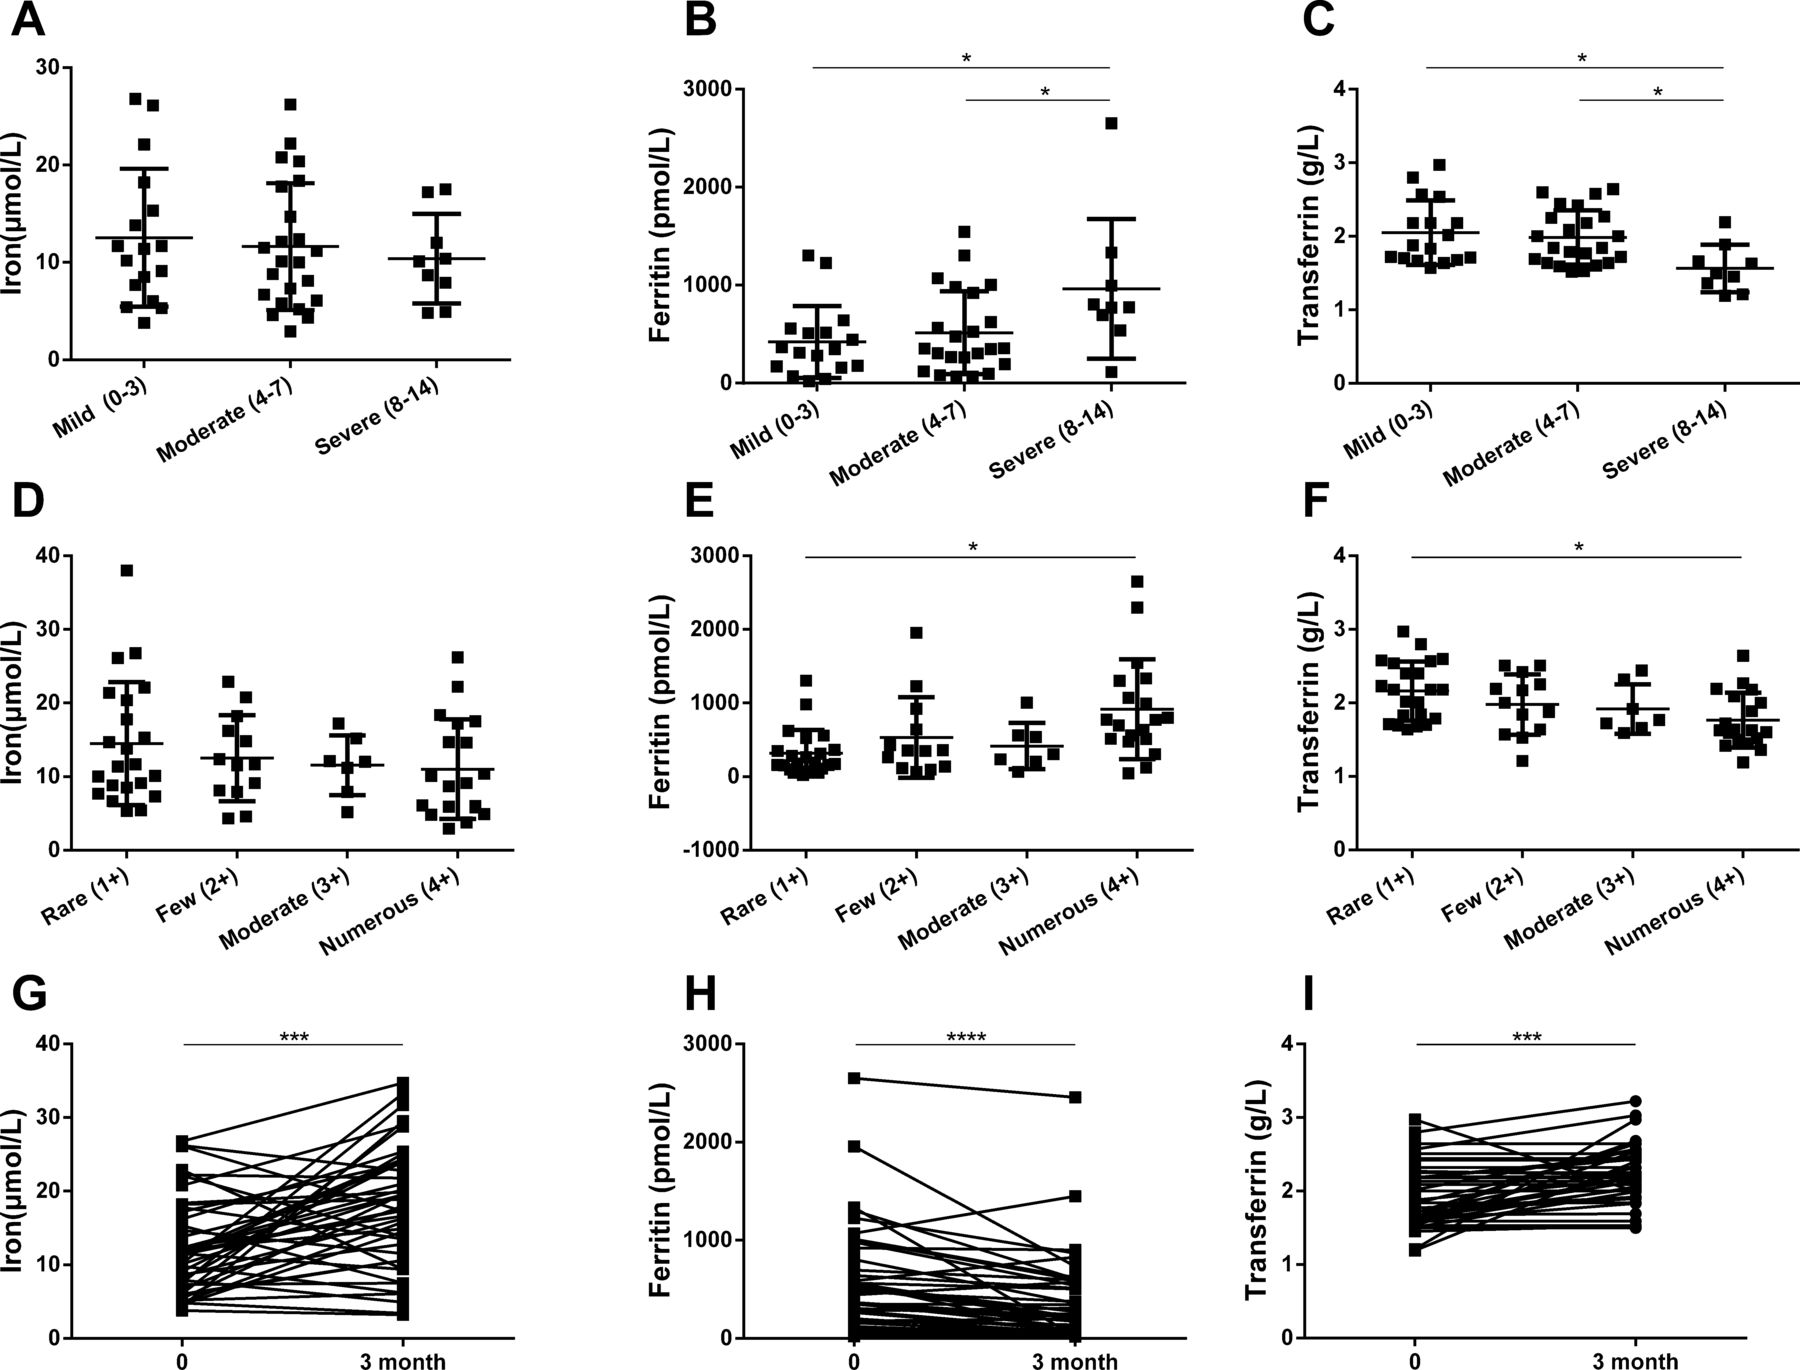
Iron homeostasis biomarkers are associated with HRCT, AFB grades and TB treatment. Representative plots showing serum iron, ferritin and transferrin levels between patients with TB with different HRCT grades (A–C) and AFB grades (D–F) and changes in the three iron biomarkers during TB treatment (G–I). A total of 49 cases of TB in first group who received HRCT were graded into mild (17 cases), moderate (23 cases) or severe (9 cases) groups. Patients with TB with positive AFB (62) were graded as rare (22 cases), few (13 cases), moderate (7 cases) or numerous (19 cases) bacillary load groups. A total of 45 randomised patients with TB underwent iron status assessment prior to and 3 months after initiating TB treatment. Comparisons between different grades were determined by one-way analysis of variance and Dunnett’s multiple comparison test. Differences between preinitiation and postinitiation of TB treatment were compared by by Student’s (paired) t-test. Data are expressed as the means±SE of the mean. *P<0.05; ***p<0.001; ****p<0.0001. AFB, acid fast bacilli; HTCT, high-resolution CT; TB, tuberculosis.
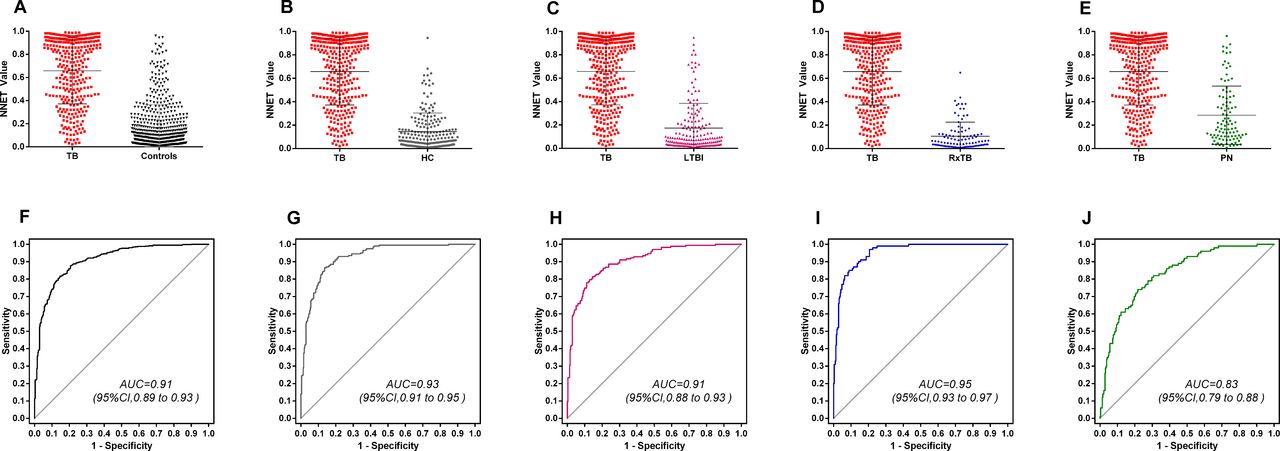
Intergroup comparisons for the performance of the NNET model. Values of the NNET model from the TB (n=316), HC (n=200), LTBI (n=167), RxTB (n=100) and PN (n=100) cohorts (A–E) and receiver operator characteristics plots (F–J) showing the accuracies of this model in diagnosing of TB disease. Data are expressed as the means±SE of the mean. AUC, area under the ROC curve; HC, healthy control; LTBI, latent tuberculosis infection; PN, pneumonia; RxTB, recovered tuberculosis; TB, tuberculosis.
An NNET model that combines iron homeostasis biomarker levels accurately differentiates TB from controls
To objectively establish a TB diagnostic model based on the three iron homeostasis biomarkers, we divided the serum iron, ferritin and transferrin level data derived from the first group into two subsets at a ratio of 3:1. The larger (663/883) subset was used as the training set, which included 152 cases of HC (22.93%), 237 cases of definite TB (35.75%), 132 cases of LTBI (19.91%), 63 cases of RxTB (9.50%) and 79 cases of PN (11.92%). The smaller (220/883) subset was used as the test set, which included 48 cases of HC (21.82%), 79 cases of definite TB (35.91%), 35 cases of LTBI (15.91%), 37 cases of RxTB (16.82%) and 21 cases of PN (9.55%) (online supplementary table 2).
An NNET model was established based on the iron biomarker data and patient categorisations within the training set. The result of the Hosmer-Lemeshow test (χ2=8.93, p=0.35) indicated that NNET model was well calibrated initially and did not require post-training calibration. As the present study aimed to identify biomarkers for the purpose of diagnosing TB from non-TB, specificity was a priority over sensitivity to maximally exclude the misdiagnosis of TB. Therefore, a threshold with a specificity of ~90%, and the maximum sensitivity, was selected. Specifically, with the optimum threshold (cut-off=0.3823), optimal performance of the supervised model for TB diagnosis was obtained with the following training set data: 83% (95% CI 77 to 87) sensitivity, 86% (95% CI 83 to 89) specificity, 77% (95% CI 71 to 82) positive predictive value (PPV), 90% (95% CI 87 to 93) negative predictive value (NPV), 5.79 (95% CI 4.68 to 7.62) positive likelihood ratio (PLR) and 0.20 (95% CI 0.15 to 0.27) negative likelihood ratio (NLR). The NNET model also performed well on the test dataset: 70% (95% CI 58 to 79) sensitivity, 92% (95% CI 86 to 96) specificity, 83% (95% CI 72 to 91) PPV, 84% (95% CI 78 to 90) NPV, 8.92 (95% CI 4.97 to 16.03) PLR and 0.33 (95% CI 0.24 to 0.46) NLR. The AUC and accuracy for the NNET model in both the training and test groups was ~0.90% and 84%, respectively (table 2). In conclusion, the NNET model could successfully differentiate TB from control cohorts.
Diagnostic efficiency of the NNET model in diagnosing TB in the discovery cohort
The NNET model can differentiate TB from HC, LTBI, RxTB and PN
The present study subsequently evaluated the performance of the NNET model on intergroup comparisons between definite TB and HC, LTBI, RxTB or PN. The NNET model achieved successful discrimination with the three-iron biomarker signature for all group comparisons. The AUCs of the NNET model to discriminate definite TB from HC, LTBI, RxTB and PN were all >0.83, and the accuracies were all >78% (figure 4 and online supplementary table 3). The AUC and accuracy evaluations were within the expected sensitivities and specificities at the Bayes operating points based on bootstrap estimates of the associated empirical 95% confidence intervals. In line with the previous report,21 22 we also found that IGRAs, which has been widely applied to MTB infection diagnosis over the last decade, fail to discriminate TB from LTBI (online supplementary figure 1).
The NNET model performs well in an independent validation cohort
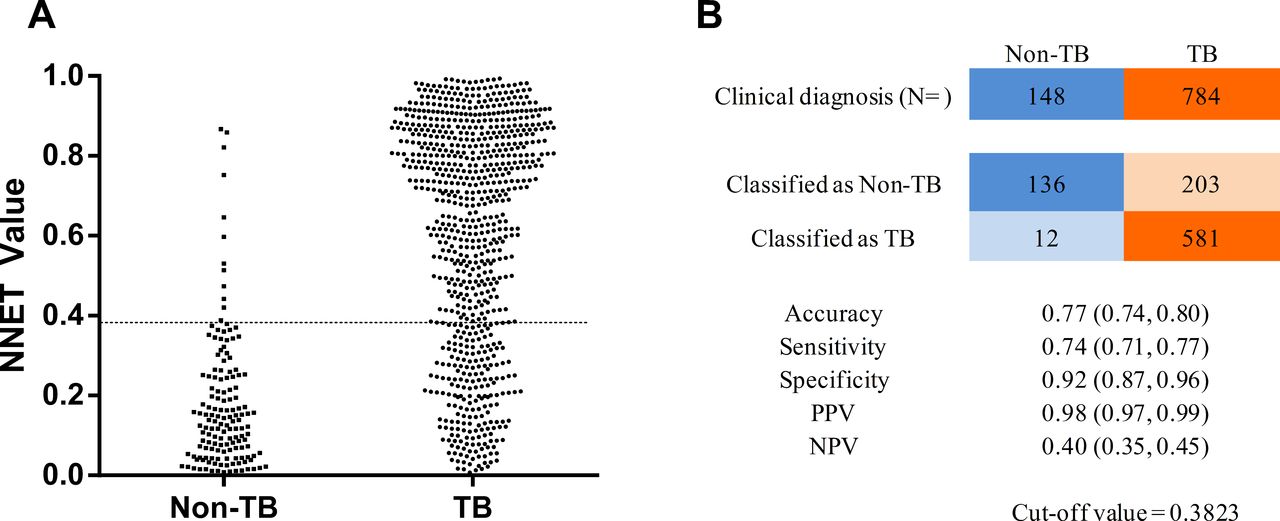
To verify how well the established model could be generalised to other cohorts, we performed a prospective blind validation study using the NNET model incorporating the three-iron biomarker signature. For this, we prospectively enrolled 967 individuals, of which 14 were excluded for not fulfilling the enrolment criteria and 9 were excluded due to HIV-positive serology. We then evaluated the host iron status of the remaining 944 participants, consisting of 653 (69.17%) with definite TB, 131 (13.88%) with probable TB, 148 (15.68%) with non-TB and 12 (1.27%) with an uncertain diagnosis (figure 1 and online supplementary table 1). With a cut-off value set as 0.3823, the NNET model successfully differentiated TB from non-TB, with 77% (95% CI 74 to 80) accuracy, 74% (95% CI 71 to 77) sensitivity, 92% (95% CI 87 to 96) specificity, 98% (95% CI 97 to 99) PPV and 40% (95% CI 35 to 45) NPV (figure 5).

Diagnostic performance of the NNET model in an independent validation cohort. A total of 932 participants with clinical diagnosis results were independently validated using the established NNET model, with the cut-off value set as 0.3823 (A, dotted line). The numerical agreement with the clinical diagnosis and key parameters is listed (B). NNET, Neural Network; NPV, negative predictive value; PPV, positive predictive value; TB, tuberculosis.
Discussion
The present study recruited ~2000 participants to examine the feasibility and efficiency of measuring host iron homeostasis biomarkers (including serum iron, ferritin and transferrin) for TB diagnosis. Following the integration of data from the three biomarkers and subsequent modelling, we established an NNET model that warranted further testing and validation in an independent cohort. The NNET model was able to discriminate TB with a sensitivity of 83% (95% CI 77 to 87) and a specificity of 86% (95% CI 83 to 89) in the training set and a sensitivity of 70% (95% CI 58 to 79) and a specificity of 92% (95% CI 86 to 96) in the test set. We achieved a similar result in a second independent validation of the NNET model. Notably, we trained three additional supervised models, including linear discriminant analysis, support vector machine and decision tree (rPart) and confirmed the performance of the three iron homeostasis biomarkers (online supplementary table 2). All these findings indicate that the serum levels of the three iron homeostasis biomarkers—serum iron, ferritin and transferrin—offer potential for use in the diagnosis of TB or initial screening.
Iron is a micronutrient that is important for host and MTB metabolism.23 Pathogenic mycobacteria compete with the host for iron, either by directly depleting intracellular iron from the host cytoplasm or by synthesising siderophores and macromolecules, including transferrin, ferritin or lactoferrin, which have high affinity to capture extracellular ferric ion.9 24–28 Anaemia, as a result of inflammation caused by MTB infection, is predominantly caused by an iron delivery problem, where erythrocyte iron is poorly used and dietary iron is enriched in intestinal enterocytes.11 29 This condition is in contrast to iron deficiency-mediated anaemia, which is mainly due to malnutrition.30 Although serum iron levels are low in both types of anaemia, other components involved in iron homeostasis are high in anaemia due to inflammation, including ferritin and hepcidin, a peptide involved in regulating iron metabolism.7 31 32
Previous studies have found that serum iron and transferrin concentrations are lower and ferritin levels are higher in patients with TB compared with those without TB.7 29 33 These abnormalities in ferritin and transferrin concentration in affected patients typically normalise following treatment.7 Others have suggested that reduced transferrin levels are associated with the progression of TB at any time point, and higher ferritin and hepcidin levels are associated with a higher risk of early TB progression in household contacts of TB cases.12 In addition, iron biomarker status can be used as an indicator of treatment failure (low ferritin) and mortality (high ferritin).14 Finally, low transferrin and serum iron, and high ferritin concentrations in HIV-infected patients suggest increased risks of TB incidence and recurrence.13 However, no previous study has examined the possible combination of these iron homeostasis biomarkers for clinical TB diagnosis, particularly in differentiating TB from LTBI and PN.
Over the last decade, substantial efforts have been made to develop novel methods for TB diagnosis. Among them, although IGRA is the most important and widely used immunodiagnostic for TB, it is unable to accurately differentiate TB from LTBI (online supplementary figure 1) or PN21 22 34 35; therefore, IGRA may not be useful in monitoring clinical anti-TB treatment.36–38 Based on polychromatic flow cytometry, biomarkers on MTB-specific CD4+ T cells have been identified to effectively discriminate between active TB and LTBI.39 40 However, flow-based assays are highly specialised, technical and complicated processes. We found that the gold standard assays, AFB and MTB culture, could discriminate TB with 100% specificity but they showed low sensitivity, at 37% (95% CI 34 to 41) and 47% (95% CI 43 to 51), respectively (online supplementary figure 2). By contrast, the serum iron homeostasis-related biomarkers has good performance for diagnosis of TB, which can be rapidly and easily determined at low cost using automated equipment. Therefore, in combination with microbiological tests, this new TB diagnostic strategy may improve TB detection rate, particularly in resource-limited high TB-burden countries.
In conclusion, we have identified a three-iron biomarker signature in a large number of participants, which successfully discriminates TB from LTBI, RxTB and non-TB PN. Our NNET model was accurate and efficient for TB diagnosis when incorporating the three-iron biomarker signature. Although the participants of the present study were recruited from two centres in China, two cohorts may not represent the status of patients with TB globally. Future investigations are now required to validate and optimise this model in larger cohorts recruited from other clinical centres worldwide and in the context of more diverse pulmonary diseases, including lung cancer, pulmonary silicosis and intrathoracic sarcoidosis. We anticipate that this approach may reduce the cost and time required to diagnose active TB. With further validation and development, our method may be applied in routine clinical practice for differential diagnosis of TB in the following clinical situations. First, this iron biomarker test may be employed for preliminary diagnosis of TB as a point-of-care testing in primary TB care units in resource-limited countries. Second, in the TB or infectious disease hospital setting, this test, in combination with microbiological tests, may be included to assist in diagnosis of active TB, as well as in decision making involving invasive methods, such as collection of bronchoalveolar lavage fluid. Finally, this test may be useful in situations where suspected individuals are unable to in provide sputum samples.
Acknowledgments
The authors would like to thank Dr Jessica Tamanini (Shenzhen University and ET editing) for editing the manuscript prior to submission and all participants and site staff at the Clinical Laboratory of Shenzhen Third Hospital (Shenzhen, China) for their contributions to the study.
References
Footnotes
Contributors Authors YD and WS contributed equally to this manuscript. XC conceived the study and critically revised the manuscript. YD, WS, QY, JG and YT recruited and assessed the patients and preprocessed the study specimens. RZ, XT, YC and LT were responsible for statistical analysis. YD interpreted the data and wrote the manuscript. All authors contributed to the subsequent drafts and approved the final version.
Funding This study was supported by the Twelve-Fifth Mega-Scientific Project on 'prevention and treatment of AIDS, viral hepatitis and other infectious diseases' (grant nos. 2017ZX10201301-001-001/002), the Natural Science Foundation of China Grant (grant nos. 81525016/81671984), the Science and Technology Project of Shenzhen (grant nos. JSGG20160427104724699/JCYJ20160427184123851/JCYJ20160427151540695/JCYJ20150402145015986/JCYJ20150402111430656) and the Jin Qi team of Sanming Project of Medicine in Shenzhen, Sanming Project of Medicine in Shenzhen (grant no. GCZX2015043015340574).
Competing interests None declared.
Patient consent for publication Not required.
Ethics approval The present study was approved by the ethics committees of the Shenzhen Third Hospital and Guangzhou Chest Hospital, China.
Provenance and peer review Not commissioned; externally peer reviewed.
Data availability statement All data relevant to the study are included in the article or uploaded as supplementary information.