Article Text

Abstract
Background The demand for lung transplantation vastly exceeds the availability of donor organs. This translates into long waiting times and high waiting list mortality. We set out to examine factors influencing patient outcomes from the time of listing for lung transplantation in the UK, examining for differences by patient characteristics, lung disease category and transplant centre.
Methods Data were obtained from the UK Transplant Registry held by NHS Blood and Transplant for adult lung-only registrations between 1January 2004 and 31 March 2014. Pretransplant and post-transplant outcomes were evaluated against lung disease category, blood group and height.
Results Of the 2213 patient registrations, COPD comprised 28.4%, pulmonary fibrosis (PF) 26.2%, cystic fibrosis (CF) 25.4% and other lung pathologies 20.1%. The chance of transplantation after listing differed by the combined effect of disease category and centre (p<0.001). At 3 years postregistration, 78% of patients with COPD were transplanted followed by 61% of patients with CF, 59% of other lung pathology patients and 48% of patients with PF, who also had the highest waiting list mortality (37%). The chance of transplantation also differed by height with taller patients having a greater chance of transplant (HR: 1.03, 95% CI: 1.02 to 1.04, p<0.001). Patients with blood group O had the highest waiting mortality at 3 years postregistration compared with all other blood groups (27% vs 20%, p<0.001).
Conclusions The way donor lungs were allocated in the UK resulted in discrepancies between the risk profile and probability of lung transplantation. A new donor lung allocation scheme was introduced in 2017 to try to address these shortcomings.
- lung transplantation
Statistics from Altmetric.com
Key messages
What is the key question?
How does lung disease, height and blood group influence the opportunity of lung transplantation in the UK?
What is the bottom line?
Significant discrepancies existed in time on the lung transplant list and waiting list mortality depending on patient-related variables.
Why read on?
The findings of this study contributed to the implementation of the latest iteration of the lung allocation scheme in the UK, aiming to mitigate these discrepancies and ensure equitable distribution of organs.
Introduction
Lung transplantation is the accepted treatment for end-stage lung disease when all other medical and surgical therapeutic interventions have been exhausted. In carefully selected individuals, lung transplantation offers both prognostic and quality of life benefit. However, there is a mismatch between the demand for lung transplantation and the availability and utilisation of donor organs that limits the broader application of this life-saving therapy. This shortfall results in a strong chance that a patient listed for lung transplantation will die before a donor organ becomes available for transplantation.
While the outcomes postlung transplantation are well described, these outcomes are entirely dependent on the listed individual having the opportunity of a transplant.1 Prior to May 2017 in the UK, allocation of donor lungs to patients on the lung transplant waiting list was at the discretion of the transplant centre at which they are listed. The decisions at each individual centre were based on the clinical assessment, often taking into account waiting times and the degree of acuity. While this allowed the transplant centres the freedom to decide on recipients, it did run the risk of introducing inequities in the system across the country. These may have resulted in a situation where the sickest patient may not receive the donor organ.
The aim of this project was to examine how listing for lung transplantation as well as outcomes postregistration varied by disease group. In addition, we investigated whether height and blood group influenced waiting list duration and associated outcomes among the five designated adult lung transplant centres in the UK.
Methods
Study population
Data were obtained from the UK Transplant Registry held by NHS Blood and Transplant (NHSBT) as of 14 May 2016. The patient cohort comprised all adult (aged ≥16 years) first lung-only registrations between 1 January 2004 and 31 March 2014. Patients who met any of the following exclusion criteria were not studied: patients registered for a heart-lung block or other multiorgan transplant; patients registered on another organ transplant list (eg, kidney list) either before, during or after their lung registration; patients registered outside the UK or not entitled to ’National Health Service (NHS) treatment and adult patients registered on paediatric lists. Adult lung transplantation in the UK is provided by five designated units. Registrations at all five transplant centres were analysed. For data presentation, each transplant centre was anonymised by randomly assigning a letter to the centre (A–E).
Primary disease is recorded on the lung recipient registration form and the following groupings were used for the analysis: COPD (encompassing alpha-1-antitrypsin deficiency and emphysema), cystic fibrosis (CF), pulmonary fibrosis (PF, encompassing all fibrotic lung diseases). All other lung diseases were grouped under the category ‘other’.
Statistical analysis
The distribution of registrations and transplants were summarised by disease group and transplant centre. Postregistration outcome (transplanted, still awaiting, removed or died while on the waiting list) was also summarised according to disease group, blood group and height. Predicted total lung capacity (TLC) is determined by height and since size matching of donor organs to potential recipients takes TLC into consideration, the relationship between height and postregistration outcome was of great interest. Gray’s test (for comparing cumulative incidence functions under a competing risks framework) and Χ2 tests were used to analyse differences within these groups. A Fine-Gray model, unadjusted for recipient factors, was also used to summarise postregistration outcomes for the overall cohort. All analyses were performed using SAS V.9.4 (SAS Institute, Cary, North Carolina, USA).
Cox proportional hazard regression modelling was used to analyse the four different outcomes as described below with the primary aim to evaluate whether these outcomes differed significantly by disease group. All four models used transplant centre as a stratifying factor to relax the assumption of proportional hazards as it was felt that trends should not be restricted to be the same for each centre. This involved fitting a model to data from all transplant centres simultaneously yet allowing for non-proportional hazards between transplant centres. Once each model had been defined, a disease group term and an interaction term between disease group and transplant centre were tested as the effect of disease group may differ by transplant centre.
Complete case analysis was used in the development of all multivariable models. To validate this approach, we first investigated whether there were systematic missing data for particular factors/centres. For those factors deemed to be potentially systematically missing, we used Kaplan-Meier methods to analyse each of the four unadjusted outcomes once with only the complete case cohort and once including only the cases which contained missing values. None of the analyses showed a significant difference in outcomes between the two concerned cohorts and hence complete case analysis was valid.
One-year survival from registration
Survival from registration was defined as the time from joining the transplant list until death, regardless of whether the patient received a transplant or not. These data were censored at one of the following time points: date of removal from the list if this occurred within 1 year of registration, the last known follow-up date post-transplant if this was within 1 year of registration or 1 year after registration if the patient was still actively waiting at this time. The model used was taken from NHSBT in their annual cardiothoracic report.2 Specifically, this was a Cox proportional hazards model, which included the following risk factors: age, sex, ethnicity, blood group, body mass index (BMI), previous thoracotomy, in hospital at registration (yes/no) and era (2004–2006, 2007–2010, 2011–2014).
Time to transplant
Receiving a transplant is one of three competing risks (transplant, death on the list, removal from the list) on entering the lung transplant list. Therefore, the model developed was specifically a cause-specific Cox proportional hazards model, which is the recommended technique for assessing the effect of covariates (disease group and disease group/transplant centre interactions being the primary focus for this study) on the hazard (or event rate) of an event under a competing risks framework.3 4 Time to transplant was defined as the time from joining the transplant list until the time of transplant. These data were censored at one of the following time points: date of removal from the list, death on the list, suspension from the list or date of data extraction (14 May 2016), if the patient was still waiting on the list at that time. Only active waiting time was considered in the analysis as patients should not receive a transplant if they are suspended from the list. The candidate variables assessed for inclusion in the model are available in the online supplement 1. Mean pulmonary artery pressure, ejection fraction and registration, ventilation and extracorporeal membrane oxygenation were not tested due to the large amount of missing data and/or low incidence rates. Complete case analysis was used to deal with missing data; if a case (row of data relating to one patient) contained missing values for at least one of the candidate variables, the entire case was omitted from the model building dataset. Candidate variables were tested using a stepwise modelling procedure where variables were retained in the model if p value was <0.1 under the likelihood ratio test (LRT). Continuous variables were tested as linear terms in the first instance, and if they were found to be significant, were tested for non-linearity using a spline term. A linear term would assume that the relationship between a variable and the chance of transplant is constant as the variable increases, while a non-linear term allows the relationship to vary depending on the value of the variable. A natural cubic spline was used to explore non-linearity, enabling cubic expressions between ‘knots’ at the 5th, 35th, 65th and 95th percentiles.
Supplemental material
Time to death on the list
Time to death on the list was defined as the time from joining the transplant list until the time of death while waiting. These data were censored at one of the following time points: removal from the list, suspension from the list, transplant or time of data extraction if the patient was still waiting on the list at this time. A risk-adjusted cause-specific Cox proportional hazards model was developed to analyse the factors that influenced the time to death on the list in the same manner as the ‘time to transplant’ model described above; complete case analysis of the same candidate variables (see online supplement 1) was used in conjunction with a stepwise modelling procedure. Non-linearity of continuous variables was tested using spline terms in the same manner.
One-year post-transplant survival
Post-transplant survival was defined as the time from transplant until the time of death. These data were censored at time of last follow-up. The model used was taken from NHSBT in their annual cardiothoracic report.2 This was a Cox proportional hazards model, which included the following risk factors: donor cytomegalovirus status; donor history of smoking; recipient daily dose of prednisolone at registration; donor/recipient predicted TLC mismatch; recipient FVC at registration; recipient bilirubin at registration; recipient cholesterol at registration; recipient age at transplant; ischaemia time (hours); transplant type (single vs bilateral transplant); primary disease group (CF, COPD, PF, other) and primary disease group by transplant type.
Results
Registrations
The registration cohort comprised 2213 registrations made between 1 January 2004 and 31 March 2014, the distribution of which was as follows: COPD (n=629, 28.4%), PF (n=579, 26.2%), CF (n=561, 25.4%) and ‘other’ lung diseases (n=444, 20.1%) (table 1).
Distribution of registrations by centre according to disease group between 1 January 2004 and 31 March 2014
Transplants
Overall, 1402 (63%) of the 2213 registrations in the study cohort resulted in transplant by the time of data extraction (the last registration in the cohort was 775 days before data extraction). The transplant rate differed across disease groups (Χ2: p<0.001). More specifically, 79.2% (n=498) of the COPD listed patients were transplanted, followed by 62.2% (n=349) patients with CF, 61.3% (n=272) of patients with other lung pathology and 48.9% (n=283) of those with PF diagnosis. The distribution of transplants performed in each disease group differed significantly between centres (Χ2: p<0.001) (table 2).
Distribution of transplants by centre and disease group for registrations between 1 January 2004 and 31 March 2014
Postregistration outcome
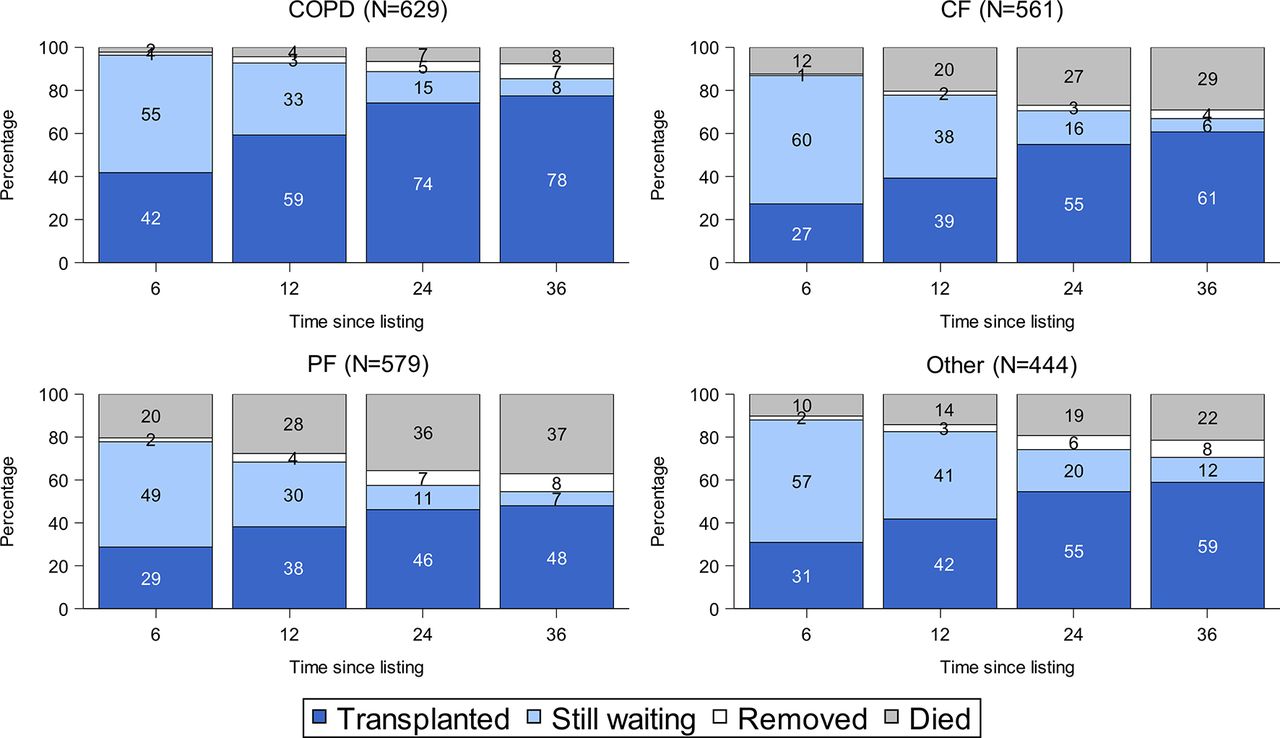
Outcomes 3 years postregistration (patient transplanted, still awaiting transplant, patient removed from the list or died while waiting) are shown in figure 1. This illustrates that patients with COPD had the highest rate of transplantation within 3 years of registration along with the lowest percentage of deaths on the list. Conversely, patients with PF had the lowest number of transplants and highest waiting list mortality. The difference in mortality outcomes (died on the list vs did not die on the list) between the four groups of patients at 3 years postregistration was statistically significant (Χ2: p<0.001).

Outcomes from listening for each disease group at 36 months postregistration. CF, cystic fibrosis; PF, pulmonary fibrosis.
Across disease groups, blood group A patients generally had a greater opportunity of transplantation than other blood groups (figure 2). Within 3 years of registration, 70% of blood group A patients had been transplanted compared with a much lower percentage for the other blood groups. Figure 3 shows a similar trend using Fine-Gray cumulative incidence functions to illustrate the percentage of patients on the list by blood group. The possibility of lung transplant varied significantly by blood group (Gray’s test: p<0.001); blood group O and B patients had a longer wait for transplant compared with blood group A patients. Blood group AB patients were transplanted the quickest of all four blood groups, but the issue of small numbers (NAB=67) should be taken into account when interpreting this. Patients with blood group O had the highest waiting list mortality compared with all other blood groups at 3 years (27% vs 20%, Χ2: p<0.001).

Outcomes from listing by blood group at 36 months postregistration.

Cumulative incidence of transplantation by blood group (Gray’s test: p<0.001).
The percentage of patients transplanted within 3 years of registration also varied significantly by height (Χ2: p<0.001); taller patients were more likely to be transplanted. Across all disease groups, approximately 69% of the tallest group of patients (≥174 cm) were transplanted within 3 years from registration, compared with 52% of the shortest group (<161 cm) (figure 4). A breakdown of outcomes according to blood group or height and lung disease groupis presented in online supplement 2.

Outcomes from listing by height at 36 months postregistration.
The Fine-Gray cumulative incidence functions (figure 5) for each competing risk, for patients joining the lung list, show that at 1 year postregistration, 35% of patients remained alive on the list, 17% died on the list, 45% received a transplant and 3% had been removed. By 5 years, the percentage transplanted had increased to 64% while 25% had died on the list.
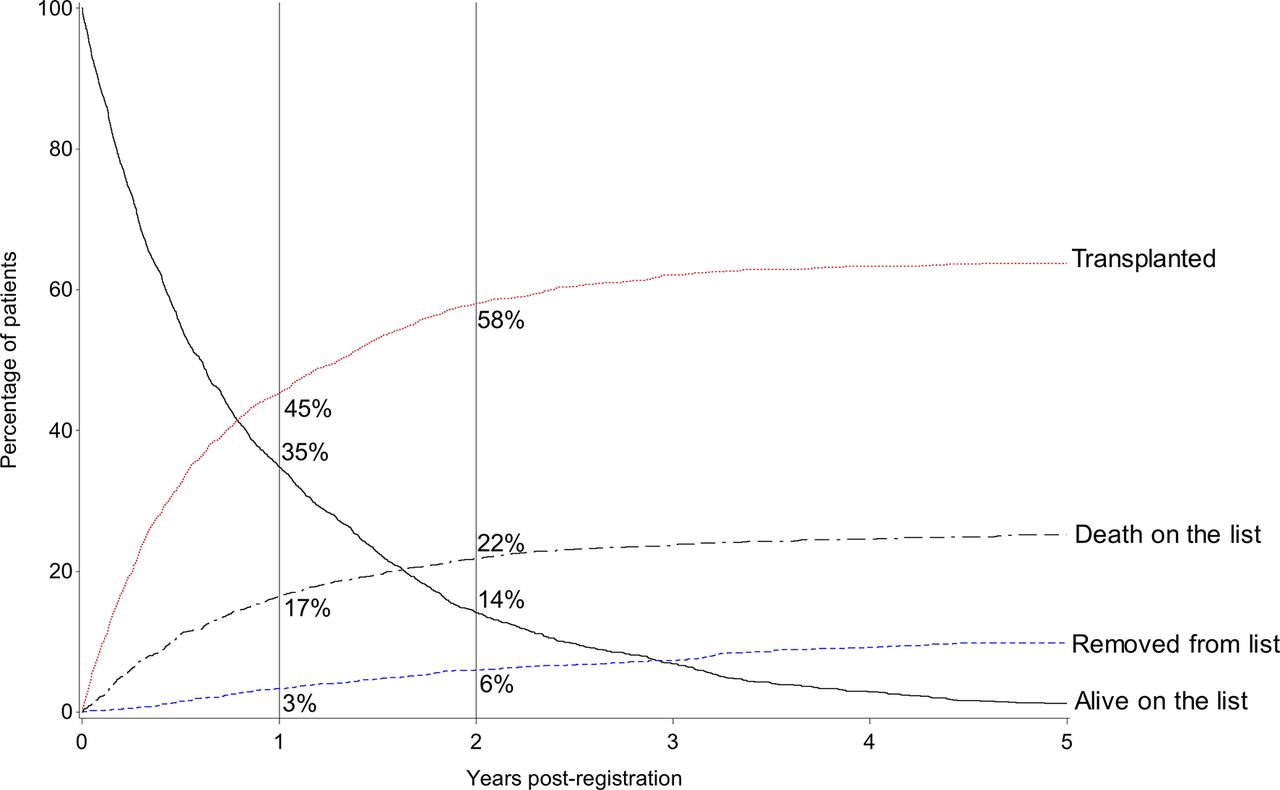
Competing risk analysis for the overall cohort.
One-year survival from registration
Applying the existing NHSBT Cox proportional hazards model, 1-year survival from registration was analysed using data from 2206 patients (99.7% of the registrations), where there were no missing data for any of the explanatory variables. After adjusting for these factors, an interaction term allowing the effect of disease group to differ depending on transplant centre was tested and found to be significant (LRT: p=0.015) as illustrated in figure 6. The hazard of death for patients with PF was much higher than for patients with COPD at all centres, but in transplant centre E the difference was particularly pronounced (HR: 8.4, 95% CI: 4.08 to 17.15). All disease groups are shown relative to COPD but the hazard of death (pretransplant or post-transplant) for patients with COPD differs for each centre. This is illustrated in table 3, which shows the absolute numbers of patients registered along with the percentage of deaths (pretransplant or post-transplant), according to disease type and transplant centre. Therefore, the hazard of death for patients with PF is not comparable between centres.

HRs for 1-year survival from listing for each disease catagory by anonymised transplant centre. CF, cystic fibrosis; PF, pulmonary fibrosis.
Percentage of deaths within 1 year of listing (pretransplant or post-transplant) by centre and disease group for the registrations over the period 1 January 2004 to 31 March 2014, which featured in the 1-year survival from registration section
Time to transplant
The variables found to significantly influence the time to transplant are shown in online supplement 3a. Six factors were found to significantly influence a patient’s time to transplant, with blood group and height being two of the most significant. Blood group A patients had the greatest chance of transplant. Blood group A patients did not have a significantly different chance of transplant than blood group B patients, while blood group O and AB patients had a significantly higher chance of transplant than blood group B patients. Taller patients had an increased chance of transplant: the chance of transplant increased by 3% for every centimetre (HR: 1.03, 95% CI: 1.02 to 1.04). An interaction term between centre and disease group was then tested and found to be significant (LRT: p<0.001). Figure 7 illustrates the HRs and CIs associated with this interaction term. Patients with COPD generally had the highest chance of transplant (represented by the larger HR). Differences in the chance of transplant by between-disease groups was particularly pronounced for centre C (HR for patients with PF relative to patients with COPD: 0.2, 95% CI: 0.11 to 0.24).
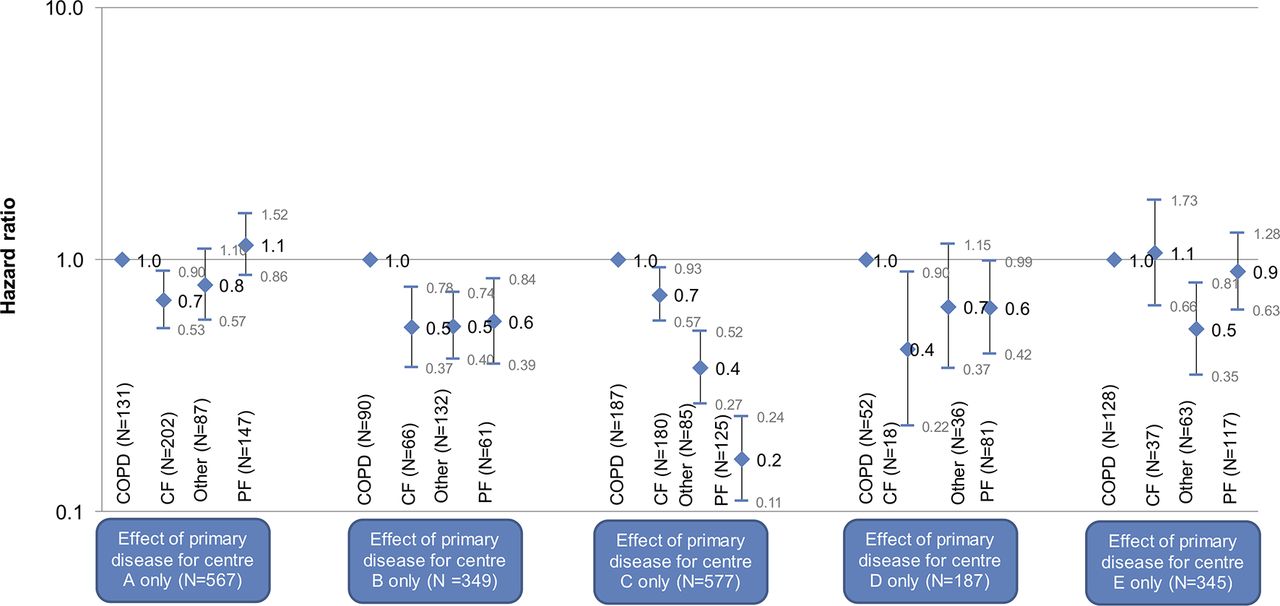
HRs for time to transplant for each disease group by anonymised transplant centre. CF, cystic fibrosis; PF, pulmonary fibrosis.
Time to death on the list
Out of a total 2025 registered patients for whom complete data were available for all explanatory variables (92% of the total cohort), 501 (24.7%) died while on the waiting list. The variables found to significantly influence the time to death on the list are shown in online supplement 3b. Nine factors were found to significantly influence the time to death on the list, in particular if a patient is in hospital at time of registration (patients who were not in hospital at the time of registration were 61% less likely to die on the list than those who were, HR: 0.39, 95% CI: 0.27 to 0.57) and BMI (HR: 0.95, 95% CI: 0.93 to 0.98). Adjusting for these significant factors, time to death on the list varied significantly (p<0.001) by disease group: patients with COPD had the lowest mortality on the list. In comparison, patients with CF had a 230% higher chance of death on the list (HR: 3.30, 95% CI: 2.11 to 5.16), patients with PF had a 341% higher chance (HR: 4.14, 95% CI: 2.91 to 5.90) and patients with other lung pathology had a 116% higher chance of death on the list (HR: 2.16, 95% CI: 1.50 to 3.09) relative to patients with COPD. When testing for the interaction between centre and disease group, there was no significant difference (LRT: p=0.3) and so the differences between disease categories could be interpreted directly. Figure 8 illustrates the HRs for primary disease group with regard to the hazard of death on the list.
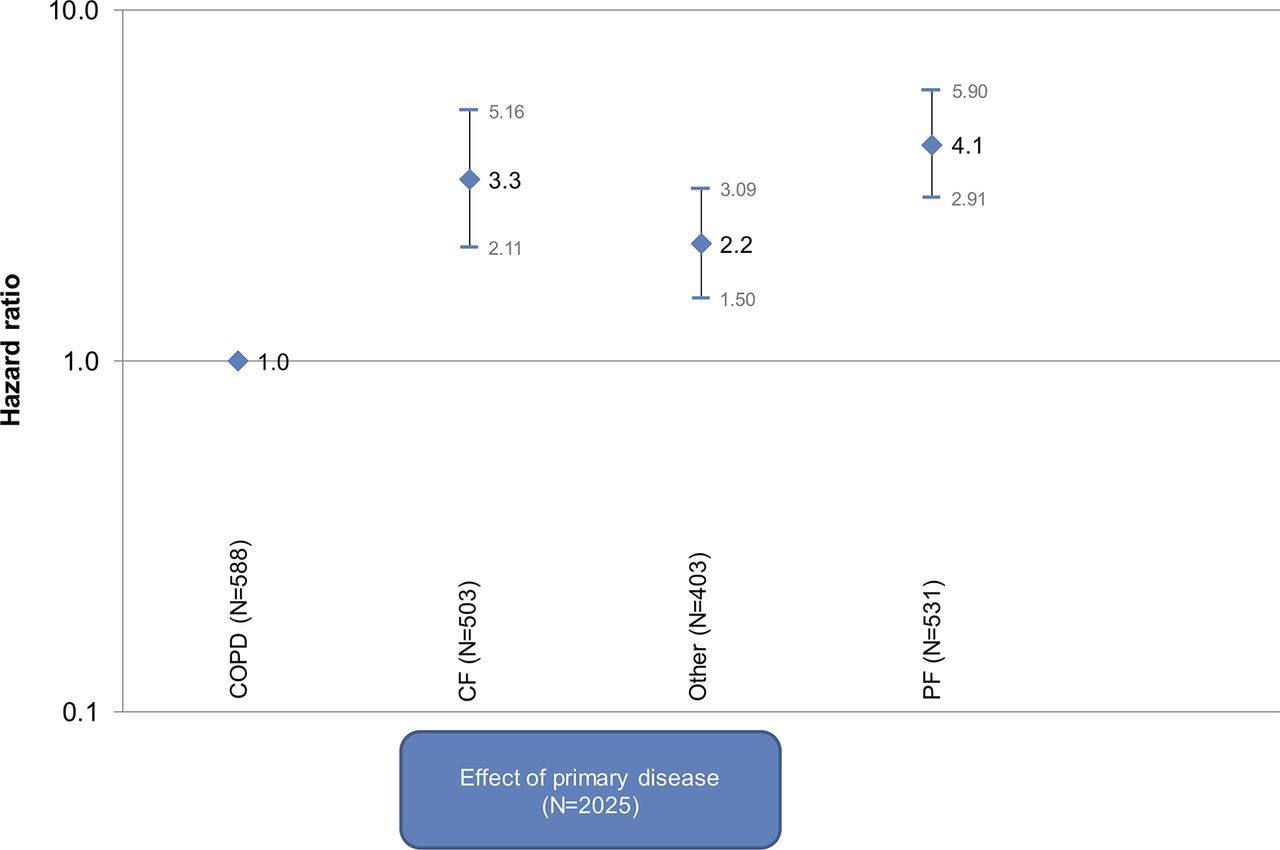
HRs for time to death on the list for each disease group. CF, cystic fibrosis; PF, pulmonary fibrosis.
One-year post-transplant survival
Applying the existing NHSBT post-transplant survival model, 1-year post-transplant survival was analysed using data from 1071 patients (76% of all 1402 patients transplanted within the study period), where there were no missing data for all the explanatory variables. After adjusting for these factors, an interaction term allowing different effects of disease group depending on transplant centre was tested but was found not to be significant (LRT: p=0.10). An interaction term between transplant type (single vs bilateral lung transplant) and primary disease was however not found to be significant at the 5% level but was found to have some association (LRT: p=0.065) and is shown graphically in figure 9. There appears to be little difference between patients with COPD and PF in terms of 1-year post-transplant survival.

HRs for 1-year post-transplant survival for each disease category by transplant type (single lung vs bilateral lung transplant). CF, cystic fibrosis; PF, pulmonary fibrosis.
Discussion
Lung transplantation offers prognostic and quality of life benefit for carefully selected patients. Duration on the waiting list, waiting list mortality and post-transplant survival are some of the quality metrics for lung allocation schemes.5 In this study, we examined how disease-specific and certain patient-specific factors influenced waiting list and transplant outcomes in a 10-year UK cohort.
Our study shows that patients with COPD were the largest group to be registered on the lung transplant waiting list (28.4%) followed by PF (26.2%) and CF (26.2%). Height influenced the likelihood of transplantation. Patients with small stature were the most vulnerable group and had the highest waiting list mortality. As height and lung pathology are the main determinants of TLC and thus of the suitable donor size range, it was expected that recipients who fell below the distribution around the median donor predicted TLC (5.6 L (IQR: 5.0–6.9), according to data held by NHSBT) were less likely to be offered an organ. Indeed, for small patients with PF (height <161 cm), only 17% were transplanted at 6 months after registration compared with 86% of patients with COPD with height ≥174 cm. To address this disparity, a new UK donor lung offering scheme was introduced in May 2017 to prioritise all patients on the lung transplant waiting list who are ≥16 years of age and ≤155 cm, ahead of the standard adult group in the urgent tier.6 Strategies to reduce donor lung size to allow transplantation have been widely advocated, especially for the PF group. However, this is only practised by a small number of surgeons in selected centres. The alternative option of lobar transplantation remains an underused approach.7
Consistently across all parameters analysed, patients with PF and CF had the highest waiting list mortality with COPD the lowest, and yet the patients with COPD had the greatest opportunity of a transplant. This difference was most apparent for blood group A patients with COPD who had the shortest waiting times. For example, 54% of blood group O candidates with CF and 45% of candidates with PF were transplanted 3 years after listing compared with 84% of blood group A patients with COPD. At 3 years, blood group AB and B patients with PF had a waiting list mortality of 41% (Χ2: p<0.001). This is an undesirable situation and donor lung allocation to various diagnosis groups in the UK requires further consideration. Despite O recipients having the lowest probability of transplantation and the highest waiting list mortality, 18% of blood group O donor lungs were accepted and transplanted into non-blood group O recipients (12% to A, 6% to B or AB). This has been addressed by the 2017 UK lung allocation scheme, which ensures that the ABO identical recipients are offered organs before ABO compatible recipients.6
Our data suggest that the distribution of transplants according to disease group was also influenced by the transplant centre with some units performing significantly more transplants for a specific disease category. Although this led to discrepancies in duration on the waiting list of certain disease groups (mainly patients with PF) in specific transplant centres, this was not reflected by a significant increase in waiting list or post-transplant mortality among different units. During the time period over which these data relate to, offering of donor lungs in the UK was based on a zonal system with the transplant centres having final discretion on which recipients were transplanted. With the recent introduction of a super urgent lung allocation scheme and the urgent lung allocation scheme in the UK, patients at high risk of death without a lung transplant are prioritised at a national level.6 Despite prioritising for urgency, height and blood group, the current UK allocation policy still does not control for lung disease type or for the individual transplant candidate’s risk profile derived from the combination of these variables.
Many other countries have adopted different lung allocation systems that are based on the ethical principles of equity of access, justice, beneficence and utility. The longest established is the Lung Allocation Score (LAS) developed in the USA. This system gives the recipient a score based on the patient’s predicted waiting list mortality and their predicted post-transplant survival.8 This system aims to prioritise the allocation of organs to patients with the highest LAS score within a geographical area. One of the prime objectives of the LAS was to reduce waiting list mortality. The LAS has achieved its primary objective of reducing waiting list mortality but in doing so some other groups have been less well served. For instance, patients with idiopathic pulmonary arterial hypertension may be less likely to receive transplantation than those with PF and CF.8 In addition, it has not been successful in improving post-transplant survival and, in some cases, survival outcomes are worse than in the pre-LAS era, irrespective of risk profile.9 As the LAS increases, the complexity of the post-transplant course is affected with worsening outcomes.10 This is particularly apparent in cases of acute deterioration, with an associated increase of LAS and preferential access to transplant but with the downside of higher postoperative mortality.11
While lung offering systems can influence which patients are transplanted from the available donor organs, it is important to note that they do not introduce any extra organs into the pool and as such are only tools for redistribution. In this redistribution, some patients will be favoured while others will inevitably be disadvantaged. Initiatives that increase consent rate for organ donation and donor organ utilisation rates should have equal prominence. These initiatives, if successful, should reduce the need for elaborate organ offering systems, as they should allow for greater number of transplants to be performed, thereby reducing both waiting times and waiting list mortality for all patient subgroups.
Organ offering systems should evolve to reflect the changing dynamics of the patient cohort, donor pool and the available resources following critical data analysis. A revision of the LAS has already taken place and the effects of this change will be evident in time.9 Likewise, the results of this study were pivotal in the evolution of the lung offering scheme in the UK to its current format6 aiming to mitigate some of the identified discrepancies and improve equity and efficiency in donor lung utilisation in the UK.
Acknowledgments
The authors are grateful to all the transplant centres in the UK who contributed data on which this article is based.
Footnotes
Contributors JP and ST were responsible for the conception and design of the study and its critical review. RH and JM contributed to the design, conduct and statistical analysis of the study. MA-A, MC, JL and RT contributed in the acquisition and interpretation of data, and critical review of the study. AK was responsible for data reporting, drafted the work and revised it to its current format following contribution from all coauthors. All coauthors reviewed and approved the final version of the manuscript.
Funding The authors have not declared a specific grant for this research from any funding agency in the public, commercial or not-for-profit sectors.
Competing interests None declared.
Patient consent Not required.
Provenance and peer review Not commissioned; externally peer reviewed.