Article Text

Abstract
Purpose New nodules after baseline are regularly found in low-dose CT lung cancer screening and have a high lung cancer probability. It is unknown whether morphological and location characteristics can improve new nodule risk stratification by size.
Methods Solid non-calcified nodules detected during incidence screening rounds of the randomised controlled Dutch-Belgian lung cancer screening (NELSON) trial and registered as new or previously below detection limit (15 mm3) were included. A multivariate logistic regression analysis with lung cancer as outcome was performed, including previously established volume cut-offs (<30 mm3, 30–<200 mm3 and ≥200 mm3) and nodule characteristics (location, distribution, shape, margin and visibility <15 mm3 in retrospect).
Results Overall, 1280 new nodules were included with 73 (6%) being lung cancer. Of nodules ≥30 mm3 at detection and visible <15 mm3 in retrospect, 22% (6/27) were lung cancer. Discrimination based on volume cut-offs (area under the receiver operating characteristic curve (AUC): 0.80, 95% CI 0.75 to 0.84) and continuous volume (AUC: 0.82, 95% CI 0.77 to 0.87) was similar. After adjustment for volume cut-offs, only location in the right upper lobe (OR 2.0, P=0.012), central distribution (OR 2.4, P=0.001) and visibility <15 mm3 in retrospect (OR 4.7, P=0.003) remained significant predictors for lung cancer. The Hosmer-Lemeshow test (P=0.75) and assessment of bootstrap calibration curves indicated adequate model fit. Discrimination based on the continuous model probability (AUC: 0.85, 95% CI 0.81 to 0.89) was superior to volume cut-offs alone, but when stratified into three risk groups (AUC: 0.82, 95% CI 0.78 to 0.86), discrimination was similar.
Conclusion Contrary to morphological nodule characteristics, growth-independent characteristics may further improve volume-based new nodule lung cancer prediction, but in a three-category stratification approach, this is limited.
Trial registration number ISRCTN63545820; pre-results.
- lung cancer
Statistics from Altmetric.com
Key messages
What is the key question?
Can morphological and location characteristics improve the currently endorsed size-based risk stratification of new nodules detected after baseline low-dose CT screening lung cancer screening?
What is the bottom line?
In contrast to morphological characteristics, growth-independent characteristics such as location may further improve volume-based new nodule lung cancer prediction, but in the currently advocated stratification approach, this is limited.
Why read on?
Management of new nodules determines the success of a lung cancer screening programme, and this is the first study to investigate the incremental value of morphological and location nodule characteristics to nodule volume cut-offs for lung cancer prediction in new nodules after baseline screening.
Introduction
Lung cancer remains as a leading cause of cancer-related death worldwide, and US guidelines recommend lung cancer screening by low-dose CT (LDCT) for high-risk individuals.1–5 Presently, lung cancer screening guidelines and nodule management protocols primarily focus on size and nodule growth for risk stratification, but the potential incremental value of morphological and location nodule characteristics has been underlined.6–11 It has been reported that nodules smaller than 5–6 mm (roughly 65–113 mm3) have a very low likelihood of being lung cancer.8 10 12 13 However, current knowledge concerning nodule management in lung cancer screening is mainly based on baseline nodules that may have been present for years before their detection.14 15 New nodules after baseline develop within a known timeframe and entail a group of young and potentially fast-growing nodules. Recently, the Dutch-Belgian lung cancer screening trial (NELSON) published a more detailed analysis on new nodules detected in incidence screening rounds.14 It was shown that compared with baseline nodules, new solid nodules possess a greater lung cancer probability already at smaller size,13 14 and subsequent data from the National Lung Cancer Screening Trial indicated similar findings.16 Furthermore, it has been suggested that participants with new nodule lung cancer have poorer survival outcomes compared with participants who had at least one positive screen prior to cancer diagnosis.17 Based on the results in the NELSON trial, it was proposed in an European position statement on lung cancer screening that new solid nodules identified at an incidence screen and <30 mm3 volume (adapted from 27 mm3, <1% lung cancer probability) or <4 mm (simulated mean) diameter (adapted from 3.7 mm, <1% lung cancer probability) comprise low risk nodules, new solid nodules 30–<200 mm3 (adapted from 206 mm³, around 3% lung cancer probability) or 4–8 mm (simulated mean) diameter (adapted from 8.2 mm, around 3% lung cancer probability) represent indeterminate risk nodules and new solid nodules ≥200 mm3 (around 17% lung cancer probability) or ≥8 mm (simulated mean) diameter (around 14% lung cancer probability) are high-risk nodules, which was also adopted in the British Thoracic Society Guidelines for the Investigation and Management of Pulmonary Nodules.11 14
In the clinical setting, physicians evaluate solid pulmonary nodules based on their size and based on their morphological and location characteristics, and likewise in lung cancer screening, the expertise of a radiologist was shown to decrease false-positive screen results.9 18 19 Nodule location in the upper lung and right upper lung in particular as well as marginal spiculation have been typically identified as risk factor for lung cancer in screening studies.10 16 20–22 Nevertheless, consistent characterisation of very small nodules can be challenging and evidence concerning the discriminative value of new nodule morphology and location for lung cancer in new nodules in incidence screening rounds of LDCT screening is lacking.
The aim of this study was to assess whether addition of morphological and location characteristics to currently proposed volume-based three-category risk stratification can improve management of new solid nodules in LDCT lung cancer screening.
Methods
Study population
The NELSON trial was authorised by the Dutch Health Care Committee. All participants provided written informed consent. The recruitment process and study design were published before.7 23 24 Summarised, eligible patients were adults aged 50–75 years, who had smoked >15 cigarettes per day for >25 years or >10 cigarettes per day for >30 years and were still smoking or stopped smoking <10 years previously. Between April 2004 and December 2006, 7557 participants underwent baseline screening in four centres in the Netherlands and Belgium. The incidence screening rounds took place 1 year, 3 years and 5.5 years after baseline screening. In this study, participants with a solid non-calcified nodule detected during the incidence screening rounds and registered by the NELSON radiologists as new or <15 mm3 (study detection limit) at previous screens were included.
CT scanning protocol
The CT protocol was published before.7 24 The four screening sites used 16-MDCT scanners or 64-MDCT scanners (Sensation-16, Siemens Medical Solutions, Forchheim, Germany, or Mx8000 IDT or Brilliance 16P, Philips Medical Systems, Best, The Netherlands). Scans of the entire chest were performed without contrast in spiral mode in caudio-cranial direction with 16×0.75 mm collimation and 1.5 pitch. Low dose settings (80–90 kVp, 120 kVp and 140 kVp) were adjusted depending on body weight (<50 kg, 50–80 kg or >80 kg), matching a CT dose index volume of 0.8 mGy, 1.6 mGy or 3.2 mGy, respectively. Datasets were derived from images of the thorax with 1.0 mm slice width and a 0.7 mm reconstruction interval. Screening conditions and data acquisition were standard across screening sites.7 24
Image reading
In the first two rounds, two independent radiologists with experience in thoracic CT reading ranging between 1 year and 20 years evaluated each CT scan individually, and in case of discrepancy, a third reader made the final decision.7 24 In the third and fourth screening rounds, single read was performed by radiologists with at least 6 years of experience in thoracic imaging after it was shown that double reading consensus has no benefit when using semiautomated software.25 CT data analysis was performed on digital workstations (Leonardo, Siemens Medical Solutions) using software for semiautomated volume measurements (LungCare, version Somaris/5 VA70C-W, Siemens Medical Solutions). Lung windows were assessed at a width of 1600 HU and a level of −700 HU. All images were interpreted both in lung window and mediastinal settings.
A non-calcified nodule was considered solid if the underlying structures were completely obscured by its lung opacity (8). A nodule’s shape was classified as spherical, polygonal or irregular.19 The nodule margin was classified as smooth, lobulated, spiculated or irregular.21 26 Additional to the nodule location in the lung, the distribution (peripheral and central) within the lung parenchyma was characterised based on the distance to the costal pleura. If the distance to costal pleura was less than one-third of the total distance to hilum-costal pleura, the nodule was defined as peripheral and if it was more than one-third, the nodule was defined as central.19 27 After detection, the software’s matching algorithm matched nodules individually (depending on consistency, size and location) with previous scans and the radiologists visually confirmed the matching. In this analysis, a nodule was considered new if it was registered by the radiologist as new or below the study detection limit of 15 mm3 on the previous scan. Radiologists could overrule protocol-based screening result (done for 195 (6%) of 3318 participants at the baseline screening round) in case of high suspicion of malignancy (eg, enlarged mediastinal lymph nodes) or benignity (eg, benign calcification patterns) and to adjust the volume measurement in case of inappropriate segmentation.18 Data obtained during CT evaluation were directly uploaded to the NELSON management system.7 For this study, nodule information as reported by the radiologists in the NELSON management system was used, and no retrospective measurements was performed.
Nodule management protocol
The NELSON nodule management protocol has been described in detail previously.7 Summarised, solid nodules detected within the NELSON trial were classified into four categories (NODCAT I–IV) according to their size and benign characteristics. After baseline screening, calcified nodules or nodules with other benign characteristics were considered benign (NODCAT I), new solid nodules without benign characteristics measuring 15–50 mm3 (NODCAT II, follow-up LDCT within 1 year) and new solid nodules 50–500 mm3 (NODCAT III, follow-up LDCT within 6–8 weeks) were defined indeterminate, whereas nodules measuring ≥500 mm3 (NODCAT IV, immediate referral to pulmonologist) were considered positive. After initial detection, a nodule’s subsequent evaluation was based on volume doubling time.7 A volume doubling time <400 days led to referral to a pulmonologist for further diagnosis.
Outcomes
For this study, a nodule was classified as lung cancer when it was diagnosed as lung cancer during diagnostic workup according to national and international guidelines including histological examination.7 Nodules were classified as benign when either: (A) the nodule was benign at histological examination; (B) extensive diagnostic evaluation had a negative finding; (C) the nodule was ruled negative during the participant’s last follow-up screening of the NELSON trial and the participant did not present with postscreening lung cancer according to the Dutch and Belgian national cancer registries and medical file review.7 13 28
Previously established volume cut-offs for new nodules at initial detection
Considering a previous analysis of the first two incidence screening rounds of the NELSON trial concerning optimal new nodule volume cut-offs at initial detection,14 nodules were classified as <30 mm3 (low risk), 30–<200 mm3 (intermediate risk) or ≥200 mm3 (high risk) based on their semiautomated volume measurements (continuous volume) or the radiologist’s nodule classification (<50 mm3, 50–500 mm3, >500 mm3; performed for 4% (50/1280) of the included nodules).11
Statistical analysis
The normality assumption was tested using the Kolmogorov-Smirnov test as well as visual assessment. Continuous variables are presented as median and IQR, and categorical variables are presented as frequencies and respective percentages. CIs of proportions were calculated using the Agresti-Coull method. The Mann-Whitney U test was used to compare the nodule volume of benign nodules and lung cancers at initial detection. Nominal variables were analysed with Fisher’s exact test. Logistic regression analysis with new nodule lung cancer as outcome was performed to assess morphological and location nodule characteristics together with the previously established new nodule volume cut-offs (<30 mm³, 30–<200 mm³ and ≥200 mm³11 14). The final parsimonious model included nodule characteristics that were significant (P<0.05) for new nodule lung cancer when adjusted for the volume cut-offs. The model calibration was assessed using the Hosmer-Lemeshow goodness-of-fit test and bootstrap calibration plots of actual probability versus predicted probability, with ideal, apparent and bias-corrected curves. The model probability was stratified through assessment of Youden Indices to maximise the area under the receiver operating characteristic curve (AUC) for three categories (termed low risk, intermediate risk and high risk) and provide at least 95% sensitivity, analogous to the previously established volume cut-offs.14 The performance for discriminating new nodule lung cancer was quantified by the AUC. The model performance was internally validated using 10-fold cross-validation. AUC comparison was performed with the method described by DeLong et al.29 Decision curve analysis was used to estimate clinical usefulness of the model by plotting the net benefit (y-axis) over a continuum of potential decision probability thresholds (x-axis).30 31 The net benefit represents the sum of true-positive minus false-positive classifications weighted by the respective probability threshold (eg, a decision threshold of 10% would imply that for every true-positive classification nine false-positive classifications are clinically acceptable). Missing data were excluded from the respective analyses. Statistical analyses were performed with SPSS V.25.0 (IBM, Armonk, USA), R V.3.3.3 (R Foundation for Statistical Computing, Vienna, Austria) and Microsoft Excel 2010 (Microsoft Corporation, Redmond, Washington, USA).
Results
In total, 1280 new solid nodules detected in 809 participants during the three incidence rounds were included (figure 1). Median participant age at baseline screening was 59 years (IQR 55–63 years), and 77% (622/809) were male. Of the included nodules, 20% (255/1280) were visible as small nodule <15 mm3 in retrospect.
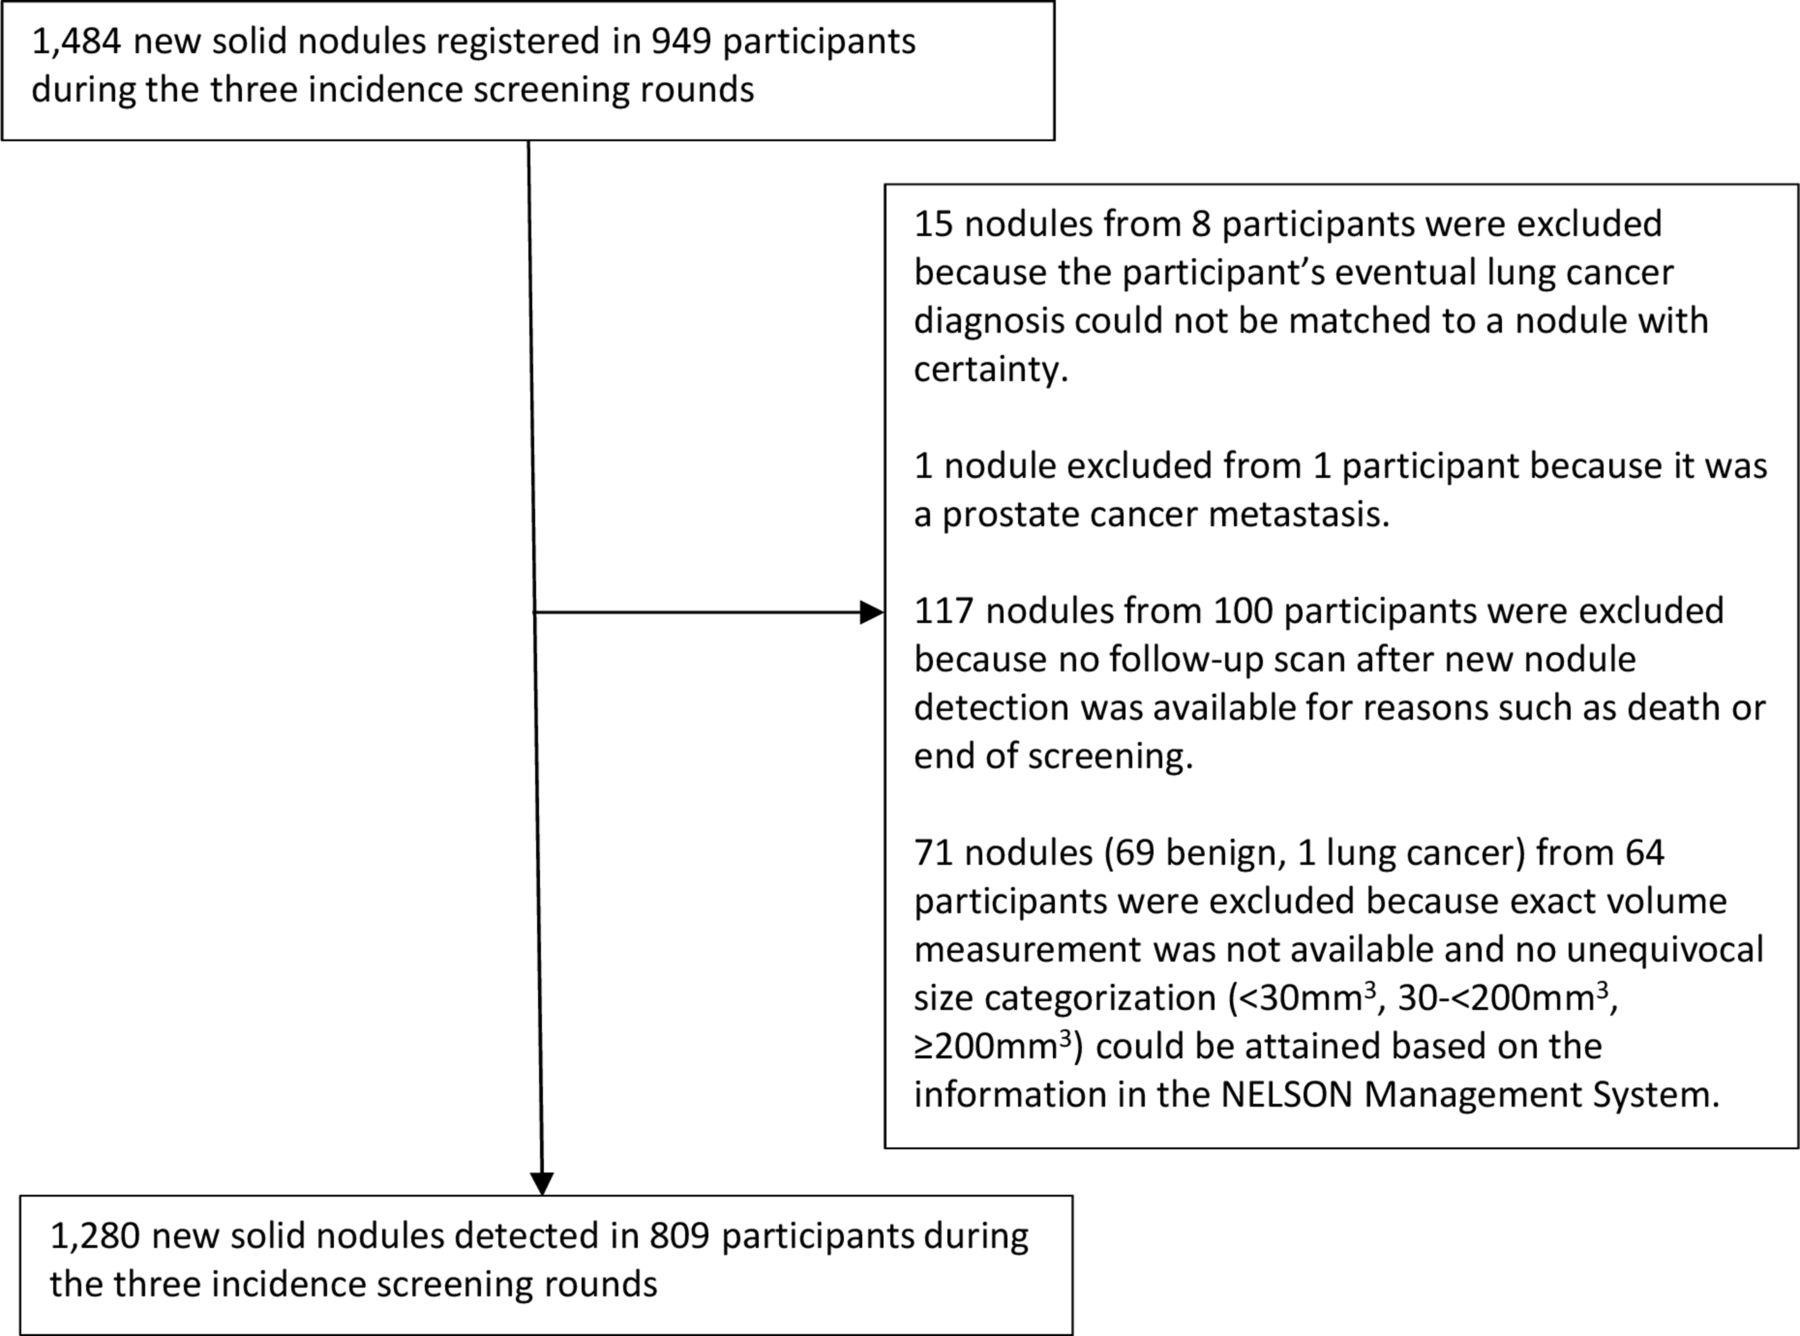
Flow chart of new solid nodules included in this analysis.
Eventually, 6% (73/1280) of the new solid nodules were diagnosed as lung cancer. At initial detection, median nodule volume was 50 mm3 (IQR 23–156 mm3) with 34% (429/1280) being <30 mm3, 43% (547/1280) being 30–<200 mm3 and 24% (304/1280) being ≥200 mm3.
Table 1 presents the nodule characteristics of benign new solid nodules and lung cancers at initial nodule detection and the proportion of lung cancers stratified by the volume cut-offs.
Frequency of nodule characteristics stratified by lung cancer diagnosis and size
Overall, new solid nodules visible in retrospect <15 mm3 were smaller and less often lung cancer compared with new solid nodules not visible in retrospect (3% (8/255) vs 6% (65/1025)). However, of new solid nodules ≥30 mm3 at detection and visible <15 mm3 in retrospect, 22% (6/27) were lung cancer compared with 8% (65/824) of new solid nodules ≥30 mm3 and not visible in retrospect.
Table 2 displays the results of the logistic regression analysis.
Logistic regression analysis of nodule characteristics and volume cut-offs with lung cancer as outcome
Larger volume, location in the right upper lung, central distribution, irregular shape and a lobulated or spiculated margin were associated with lung cancer in univariate analysis. After addition of the volume cut-off categories to the selected nodule characteristics by multivariate logistic regression, only location in the right upper lung and central distribution significantly improved lung cancer prediction. Furthermore, after addition of the volume cut-offs, visibility in retrospect as small nodule <15 mm3 was significantly associated with lung cancer. In other words, at equivalent size a new solid nodule visible in retrospect <15 mm3 was more likely lung cancer than a new nodule not visible at all. The full model included the nodule volume cut-offs, location in the lung, distribution in the lung and visibility in retrospect.
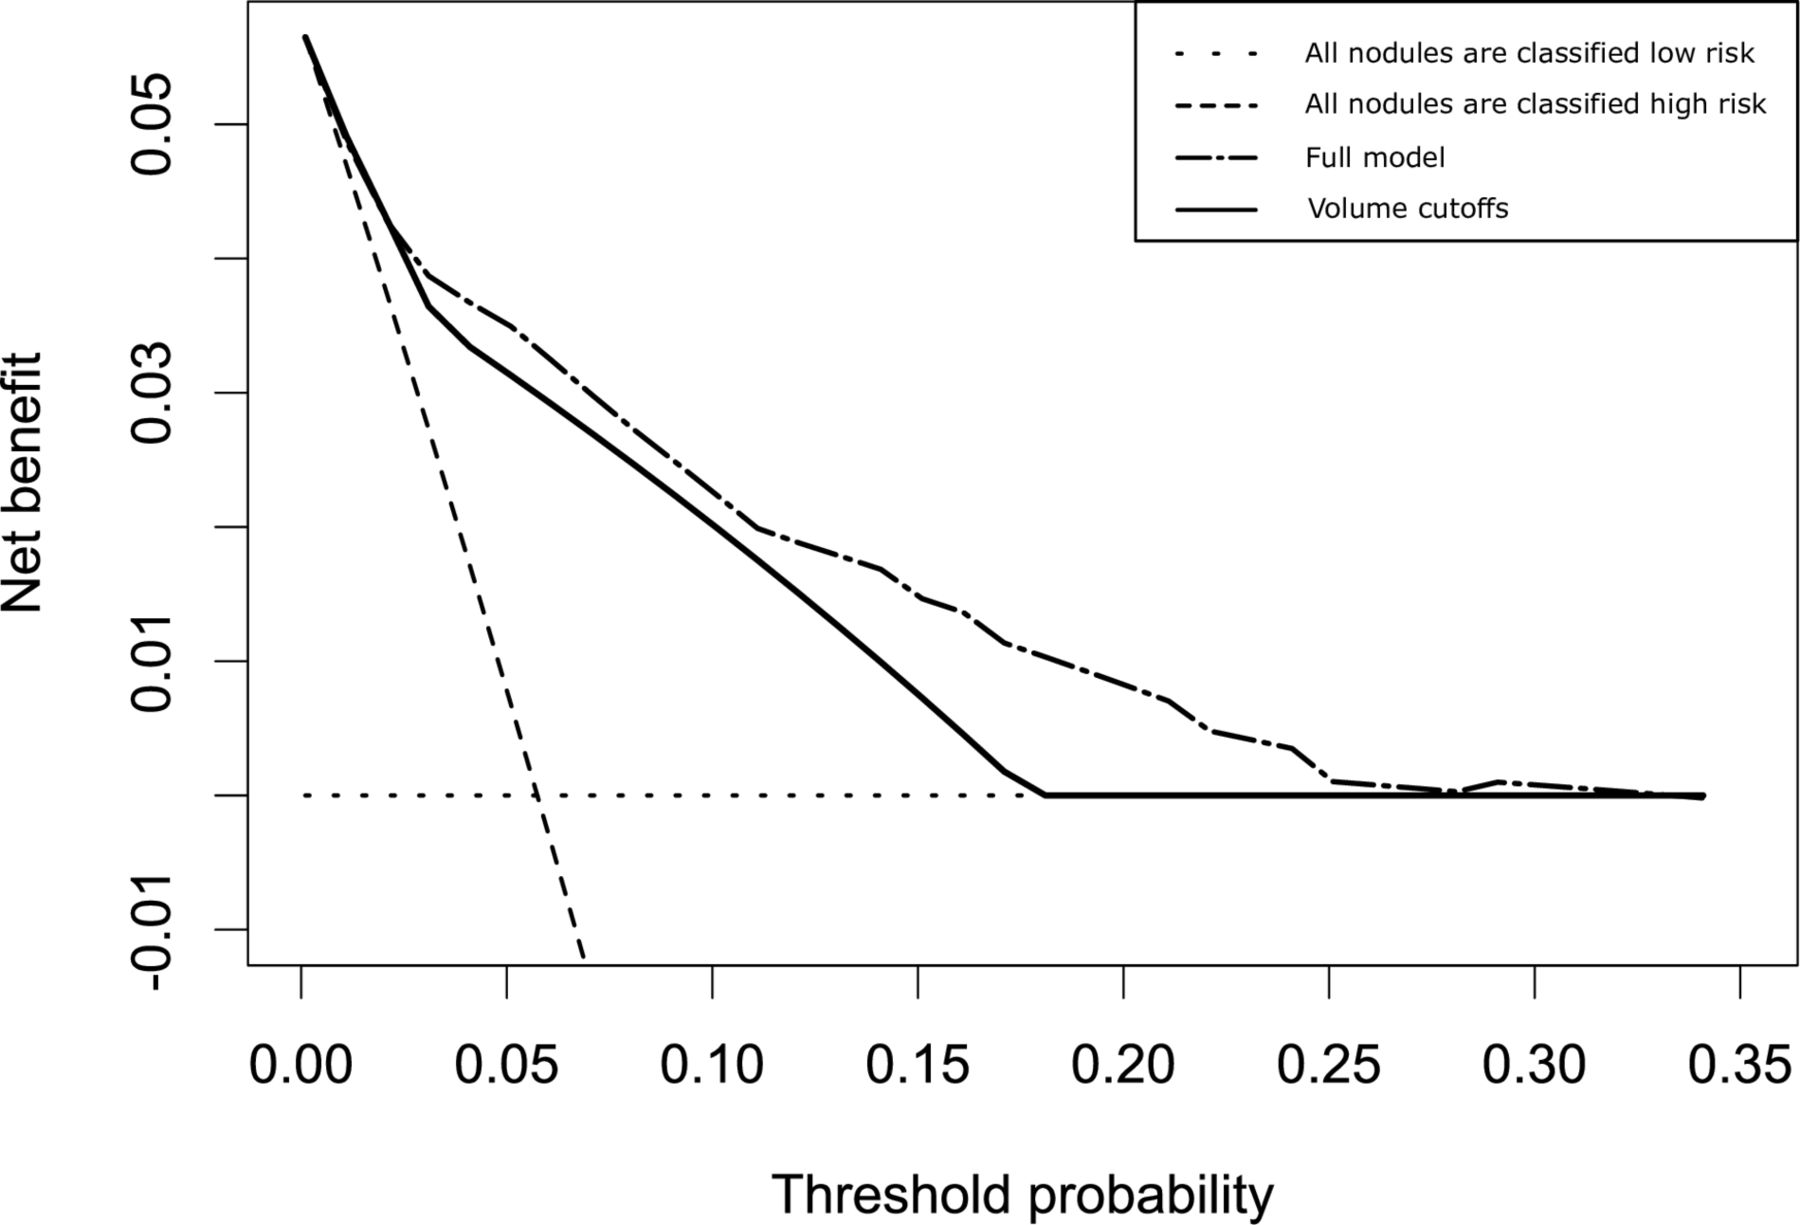
Figure 2 displays the ROC curves of the volume cut-off values, the full model and the model stratified into three risk categories. Discrimination based on volume cut-offs (AUC: 0.80, 95% CI 0.75–0.84) and continuous volume (AUC: 0.82, 95% CI 0.77 to 0.87) was similar. The full model (AUC: 0.85, 95% CI 0.81 to 0.89) provided superior discriminative performance compared with the volume cut-offs alone. The 10-fold cross-validated mean AUC was similar (0.846±0.050). The Hosmer-Lemeshow test was non-significant (P=0.75) suggesting a good overall fit (online supplementary figure 1). The clinical utility of the model in terms of an increased number of true positive predictions without increase in the false-positive rate (net benefit) was assessed over a continuum of potential risk thresholds using decision curve analysis (figure 3). The model displayed consistent positive and larger net benefit for risk thresholds above 2% (intermediate and high-risk nodule thresholds) when compared with the volume cut-offs alone. Nevertheless, when stratifying nodules into three categories based on model cut-off values for a maximal AUC (AUC: 0.82, 95% CI 0.78 to 0.86), thereby reflecting a three risk-group stratification (low risk, intermediate risk and high risk), there was no significant difference in discriminatory performance compared with the volume cut-offs.
Supplemental material

ROC curves of the volume cut-off values, the full model and the full model stratified into three categories for discrimination of lung cancer. AUC, area under the curve; ROC, receiver operating characteristic curve.

Decision curve analysis of the full model and volume cut-offs alone. Net benefit: sum of true-positive minus false-positive classifications weighted by the respective risk threshold. For a specific threshold probability, a larger net benefit indicates a greater number of true positive predictions without increase in the rate of false positives. Not using a model would assume that all nodules have the same risk and is illustrated by the two alternatives of either assuming that all nodules are low risk or that all nodules are high risk. This figure illustrates that, when compared with the volume cut-offs, clinical utility of the model is pronounced at higher risk thresholds.
Discussion
This study aimed to evaluate the potential incremental value of morphological and location characteristics to volume-based lung cancer risk stratification of new solid nodules identified after baseline LDCT lung cancer screening. Overall, 1280 new solid nodules detected in 809 participants during the incidence screening rounds of the NELSON trial were included, with 6% (73/1280) being diagnosed as lung cancer. Studies on new nodules detected in incidence screening rounds of LDCT screening are sparse, and only limited evidence concerning management of these nodules exist.8 14 32 To our knowledge, this is the first study to investigate the incremental value of morphological and location nodule characteristics to nodule volume cut-offs for lung cancer prediction in new nodules after baseline screening.
We report five central findings. First, at initial detection new solid nodule volume and, therefore, its growth speed was the strongest predictor for malignancy. Second, nodule features traditionally attributed to lung cancer, such as location in the upper lung, central distribution, irregular shape and a lobulated or spiculated margin, were associated with lung cancer in new solid nodules in univariate logistic regression analysis. This is consistent with previous findings, mainly in baseline nodules.16 19–21 Third, when added to the previously established new solid nodule volume cut-off values (<30 mm3, 30–<200 mm3 and ≥200 mm3),11 14 only location in the right upper lung and central distribution provided incremental value, while nodule shape and margin did not improve lung cancer discrimination. This contrasts findings in baseline nodules, where aside of location, nodule morphology remained significantly associated with lung cancer when corrected for nodule size.19–21 This discrepancy may be caused by the augmented predictive information of nodule size in new solid nodules, which developed in a short and known timeframe, as compared with baseline nodules, that could have been present for years before detection. The volume of a baseline nodule primarily represents its current size, whereas the volume of a new nodule more directly translates to its growth rate. This is supported by the observation that only morphological characteristics forfeit their predictive association through addition of nodule volume, while growth independent features remain significant predictors. Next to that, new solid nodules tend to be smaller than baseline nodules at initial detection,14 which could hamper classification of morphology. Fourth, visibility as very small nodule in retrospect was significantly associated with lung cancer when combined with the volume cut-offs. While this finding could have implications for new nodules ≥30 mm3 at detection where 22% (6/27) of those visible in retrospect as small nodule were lung cancer as compared with 8% (65/824) of those not visible in retrospect (P=0.02), implications for nodules <30 mm3 seem redundant considering the respective comparison of <1% (2/228) versus 0% (0/201, p=0.501) being lung cancer. Nodules visible in retrospect likely are persisting nodules that could explain their higher cancer risk when further growing. Fifth, the identified new solid nodule characteristics did not significantly improve risk stratification by volume when considering a three category (low risk, intermediate risk and high risk) stratification approach such as advocated in current guidelines.8 11 14 Although some of the selected nodule characteristics provided incremental discriminatory information and clinical utility in decision curve analysis, it was limited compared with the volume cut-offs.
This study has limitations. Nodules that remained <15 mm3 could not be included as they were below the NELSON trial’s detection limit and were not registered by radiologists. Another possible limitation may be observer variation that was not considered. However, single read was only performed by radiologists with at least 6 years of experience in thoracic imaging. Next, only solid nodules were included, with exclusion of part-solid and pure ground glass nodules. Furthermore, nodules without an additional follow-up scan within the NELSON trial were excluded from the analysis to provide the most consistent appreciation of benign and malignant nodules. Because these nodules likely were benign, the proportion of lung cancers may be slightly overrepresented. The overall occurrence and lung cancer probability of new solid nodules within the NELSON trial were reported before.14
In new solid nodules detected during incidence screening rounds of LDCT lung cancer screening, morphological and location characteristics only have limited incremental discriminatory value for lung cancer additional to volume cut-offs. Nodule characteristics not influenced by nodule growth, such as location in the right upper lung and a central distribution, can potentially improve volume-based risk stratification, but in a three category (low, intermediate and high risk) stratification approach, this is negligible. Newly detected nodules ≥30 mm3 and visible as small nodule (<15 mm3) in retrospect have a high lung cancer probability. Overall, new solid nodule volume and, therefore, speed of growth is the strongest predictor for lung cancer.
References
Footnotes
Contributors JEW, MAH, RV and MO were involved in the conception, hypotheses delineation and design of the study. All authors acquired the data or analysed and interpreted the data. All authors wrote the article or were substantially involved in its revision before submission.
Funding The NELSON-trial was sponsored by: Netherlands Organisation for Health Research and Development (ZonMw); Dutch Cancer Society Koningin Wilhelmina Fonds (KWF); Stichting Centraal Fonds Reserves van Voormalig Vrijwillige Ziekenfondsverzekeringen (RvvZ); Siemens Germany; Rotterdam Oncologic Thoracic Steering committee (ROTS); G. Ph. Verhagen Trust; Flemish League Against Cancer; Foundation Against Cancer; and Erasmus Trust Fund.
Disclaimer The funders had no role in study design, data collection and analysis, decision to publish or preparation of the manuscript.
Competing interests CMvdA reports grants from Symposium Thoracic Oncology, grants from American Thoracic Society, grants from Lancet Respiratory Medicine, outside the submitted work. KN reports grants from Flemish League against Cancer, grants from the Belgian Foundation against Cancer, during the conduct of the study. HJMG reports grants from Eli Lilly, Roche, MSD, BMS and Novartis, outside the submitted work. HJdK took part in a 1-day advisory meeting on biomarkers organised by M.D. Anderson/Health Sciences during the 16th World Conference on Lung Cancer, outside the submitted work.
Patient consent Not required.
Ethics approval The NELSON trial (trial registration number, ISRCTN63545820) was approved by Ethics Committees of all participating centres in the Netherlands and Belgium.
Provenance and peer review Not commissioned; externally peer reviewed.