Article Text

Abstract
Background All lung cancer CT screening trials used fixed follow-up intervals, which may not be optimal. We developed new lung cancer risk models for personalising screening intervals to 1 year or 2 years, and compared these with existing models.
Methods We included participants in the CT arm of the National Lung Screening Trial (2002–2010) who underwent a baseline scan and a first annual follow-up scan and were not diagnosed with lung cancer in the first year. True and false positives and the area under the curve of each model were calculated. Internal validation was performed using bootstrapping.
Results Data from 24 542 participants were included in the analysis. The accuracy was 0.785, 0.693, 0.697, 0.666 and 0.727 for the polynomial, patient characteristics, diameter, Patz and PanCan models, respectively. Of the 24 542 participants included, 174 (0.71%) were diagnosed with lung cancer between the first and the second annual follow-ups. Using the polynomial model, 2558 (10.4%, 95% CI 10.0% to 10.8%), 7544 (30.7%, 30.2% to 31.3%), 10 947 (44.6%, 44.0% to 45.2%), 16 710 (68.1%, 67.5% to 68.7%) and 20 023 (81.6%, 81.1% to 92.1%) of the 24 368 participants who did not develop lung cancer in the year following the first follow-up screening round could have safely skipped it, at the expense of delayed diagnosis of 0 (0.0%, 0.0% to 2.7%), 8 (4.6%, 2.2% to 9.2%), 17 (9.8%, 6.0% to 15.4%), 44 (25.3%, 19.2% to 32.5%) and 70 (40.2%, 33.0% to 47.9%) of the 174 lung cancers, respectively.
Conclusions The polynomial model, using both patient characteristics and baseline scan morphology, was significantly superior in assigning participants to 1-year or 2-year screening intervals. Implementing personalised follow-up intervals would enable hundreds of participants to skip a screening round per lung cancer diagnosis delayed.
- lung cancer
- clinical epidemiology
Statistics from Altmetric.com
Key messages
What is the key question?
In a lung cancer CT screening setting, who should be allowed to safely skip the first annual follow-up screening round?
What is the bottom line?
Implementation of personalised follow-up intervals could noticeably reduce screening programme costs, radiation exposure and radiologist workload.
Why read on?
Besides demonstrating the superiority of new risk prediction models based on 24 542 National Lung Screening Trial participants, the potential trade-offs between allowing many cancer-free participants to skip a screening round and delaying the lung cancer diagnosis in some is discussed.
Introduction
The US National Lung Screening Trial (NLST) is the only lung cancer screening trial to date which has shown a significant decrease in lung cancer mortality using CT compared with chest radiography.1 In the CT arm of the trial, participants underwent three CT scans at 1-year intervals. However, only 0.7% of the CT arm participants screened in the first follow-up round of the study were diagnosed with cancer within a year, as compared with 1.0% for the baseline CT screening. In fact, there is currently no strong evidence to promote annual over biennial follow-up screening intervals; the latter would substantially reduce costs, radiation burden and radiologists' workload.2 However, considering the large intraparticipant variation and lung cancer heterogeneity, a one-size-fits-all strategy is likely to be suboptimal.3
There are currently published models which attempt to determine the most efficient screening eligibility criteria or the chance that a nodule is cancerous.4–6 However, to the best of our knowledge, only Patz and colleagues attempted to procure the ideal follow-up interval per participant following a baseline scan, though their model was simple and only had one risk threshold.7 Using their model, 18 059 unnecessary scans at the first annual follow-up screening round (T1) could have been avoided at the expense of delaying the diagnosis of lung cancer in 62 participants.
We therefore developed a model to predict the individual risk for participants not diagnosed with lung cancer in the year following a baseline scan, to be diagnosed with lung cancer between 1 year and 2 years after the baseline, that is, in the year following the first annual follow-up CT scan. With such a model, an optimal subset of screening participants could be selected for biannual screening.
Methods
A detailed report of the methods can be found in the online supplementary appendix.
Supplementary file 1
Participant and scan data
In short, NLST was a randomised controlled trial performed at 33 centres in the USA which enrolled 53 454 people with a high lung cancer risk, of which 26 722 were assigned to the spiral low-dose CT arm and 26 732 to the chest radiography (control) arm.1 The primary outcomes were lung cancer mortality and overall mortality. The main inclusion criteria were an age between 55 years and 74 years, a minimum of 30 pack-years of smoking, and, if applicable, had quit smoking less than 15 years previously. The trial took place between 2002 and 2010: the participants were screened in three annual rounds—one baseline (T0) and two annual follow-ups (T1 and T2, respectively)—and were followed for another 5 years. A participant received a ‘positive’ screening outcome if at least one non-calcified pulmonary nodule with a diameter of 4 mm or larger was detected in the CT scan. Out of the 24 715 participants screened in T1, 7191 (27.3%) tested positive of which only 168 (2.4%) had a confirmed lung cancer diagnosis.
Use of NLST data was approved by the National Cancer Institute Cancer Data Access System under study number 267. This included participant characteristics and scan outcomes. Note that some data were updated since the main results were published, resulting in slight differences.1
Data selection
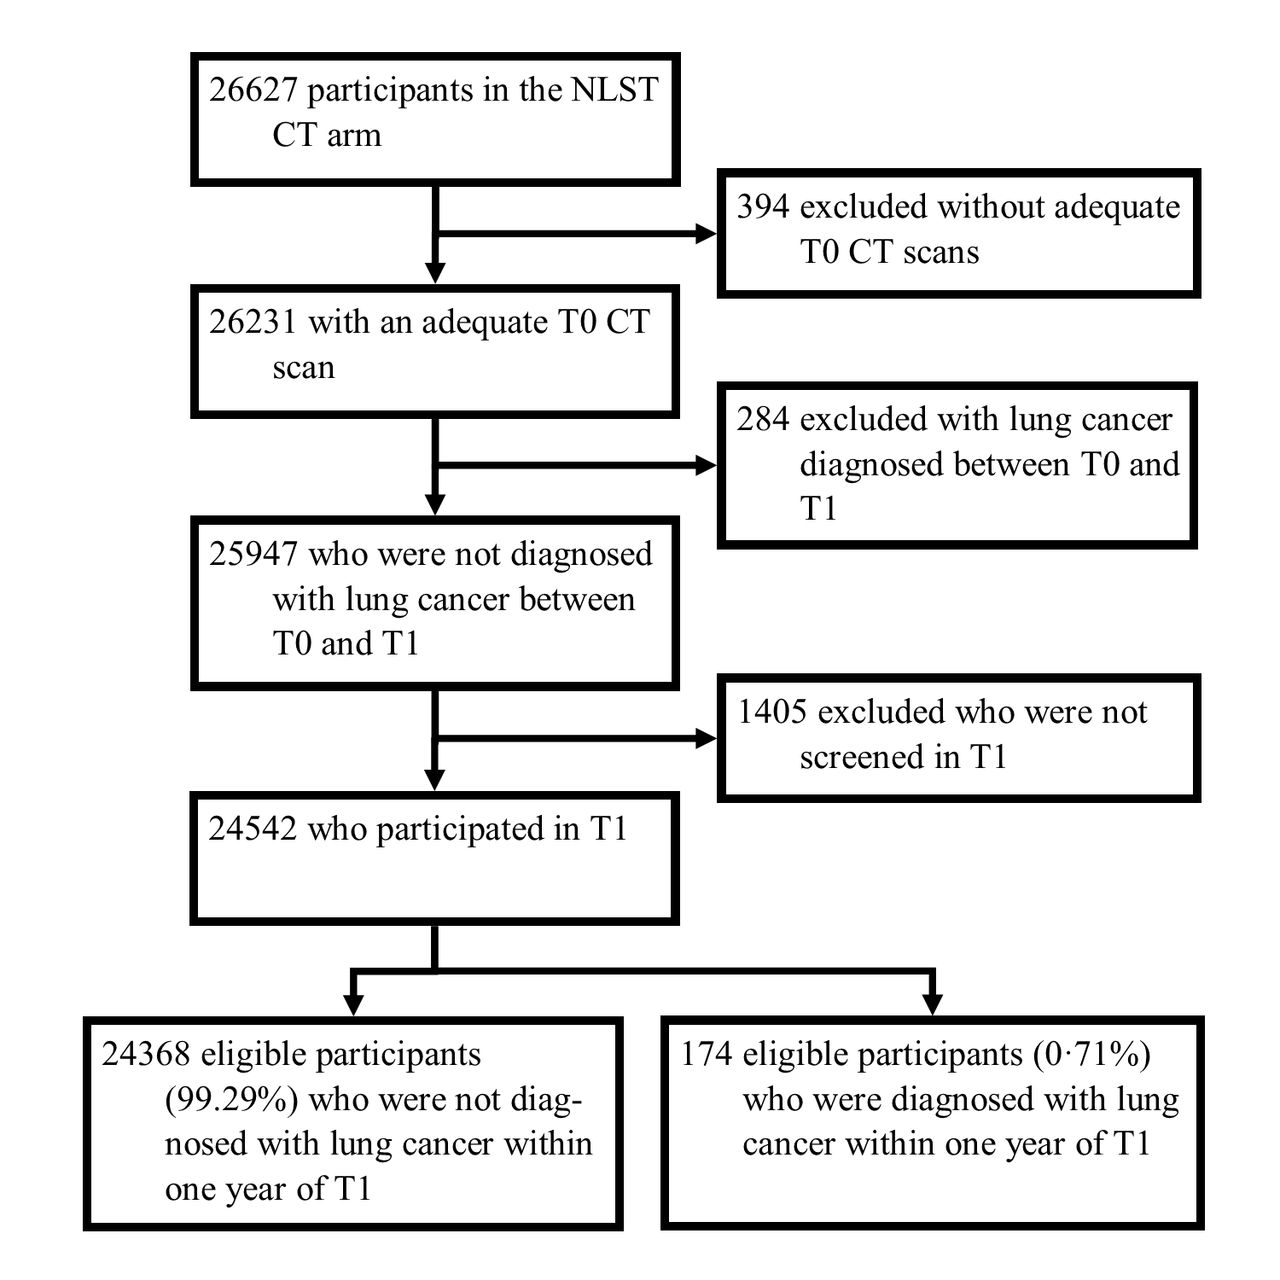
Figure 1 shows the participant inclusion process. The requirements were that the participant was part of the CT arm, had a completed baseline questionnaire, had an adequate scan at the baseline screening round (T0) and participated in the first yearly follow-up round (T1). The outcome for this study was cancer diagnosis in the year following T1. Participants who were diagnosed with lung cancer before T1 were excluded from T1 participation, namely lung cancers diagnosed on the basis of a positive T0 outcome (n=267) plus interval cancers diagnosed before T1 (n=17).

Participant selection flow chart. NLST, National Lung Screening Trial; T0, baseline screening round; T1, first 1-year follow-up screening round.
Predictor variables
Most variables used were left as originally provided in the NLST data set; some new variables were created with the purpose of isolating the most relevant variables (online supplementary appendix table 1). For one, when multiple nodules were recorded in one scan, only the longest diameter and perpendicular diameter of the longest nodule were considered. Also, a nodule characteristic (ie, part solid, non-solid, upper lobe location and spiculation) was considered present when any of the nodules in the scan had that characteristic. Patient characteristics variables were obtained from participant questionnaires and scan variables were reported by individual radiologists. Missing data were replaced using multiple imputations.
Statistical analysis
Multiple logistic regression was performed using the R statistical analysis package V.3.3.2; five models are reported. For the parsimonious polynomial model (subsequently referred to as the ‘polynomial model’), a bidirectional stepwise multiple logistic regression analysis was performed on 17 variables deemed important.8 The continuous variables were transformed into polynomials to the second power. Only variables which had a Pearson’s χ2 p value less than 0.20 were included in the parsimonious model. The parsimonious patient characteristics model (‘patient characteristics model’) analysis was performed on 11 patient characteristics variables. The diameter and Patz models were created using only one variable each: ‘longest nodule diameter’ and ‘negative T0 screen’, respectively. Finally, we applied the PanCan model (full model with spiculation) risk scores on our data.6 We used bootstrapping to validate the models and test for overfitting in order to use all lung cancer cases available for developing models.9 10 The 95% confidence intervals (CI) of predictive values (sensitivity, specificity, positive predictive value and negative predictive value) were calculated using the Wilson score method corrected for continuity.11 The Hosmer-Lemeshow test was used to test model calibration by determining whether the differences between the observed and expected outcomes are statistically significant (a p value <0.05 would indicate poor calibration).12 Decision curve analysis was performed as a means to evaluate the models by incorporating the consequences of false positives and negatives.13
Results
Study participants
Inclusion criteria and study set-up of NLST are described elsewhere.1
Out of 26 627 persons enrolled in the NLST CT arm, 24 542 met the inclusion criteria of this study (92.2%). Within this group, 174 (0.7%) were diagnosed with cancer within 1 year of T1 (figure 1). In more detail, 6845 (27.9%) had a positive T1 screen, of which 165 (2.4%) were diagnosed with lung cancer; 9 cancers (0.05%) out of the 17 697 negative T1 screens were interval cancers.
Variables for lung cancer prediction
Table 1 displays the distribution of all variables deemed important in lung cancer prediction.
Distribution of variables in the NLST data set
The variables included in the polynomial and patient characteristics models and their β coefficients, ORs, and p values are listed in table 2; note that the table also shows the variables which were not included in the final model (eg, sex, family history of lung cancer and prior diagnosis of pneumonia). The variables included in the diameter, Patz and PanCan models are described in the statistical analysis subsection. Out of all variables used in this study, only the variable ‘prior diagnosis of cancer’ had 57 (0.2%) missing data points, which were replaced using multiple imputations.
Parsimonious polynomial model versus patient characteristics model variables
Model performance
Table 3 shows the hypothetical effect of allowing approximately 0%, 5%, 10%, 25% and 40% of the participants who were diagnosed with lung cancer within 1 year of T1, to skip T1. The corresponding percentages of T1 scans avoided (specificity) using the polynomial model would be 10.4% (95% CI 10.0% to 10.8%), 30.7% (30.2 to 31.3%), 44.6% (44.0 to 45.2%), 68.1% (67.5 to 68.7%) and 81.6% (81.1% to 82.1%), respectively. Sensitivity, positive and negative predictive values, and number of scans needed to diagnose one lung cancer case (NND) are also reported. Furthermore, the distribution of lung cancer stages at the time of diagnosis are reported for those cases in which the diagnosis would be delayed.
Results of five models applied at several numbers of delayed diagnoses thresholds
For example, in the polynomial model, by allowing a fourth (25.3%, 19.2% to 32.5%) of the lung cancer diagnoses to be delayed (n=44), 68.1% (67.5% to 68.7%) of the participants can safely skip T1 (n=16 710). The efficiency improves more than twofold, from an NND of 126 to 60. Of the cancer diagnoses delayed, the distribution of TNM stages I through IV were 21, 5, 5 and 9, respectively (four were unclassified).
Visualisation of the models in the form of receiver operating characteristic (ROC) curves is displayed in figure 2, along with the insample area under the curve (AUC) of each model. Table 4 yields the corresponding bootstrapped AUCs calculated from the original samples with the CIs. Our polynomial model showed a relatively good predictive performance with an AUC of 0.795 (bootstrapped AUC 0.785, 95% CI 0.784 to 0.786); the patient characteristics and diameter models were significantly inferior with AUCs of 0.698 (0.693, 0.692 to 0.693) and 0.697 (0.697, 0.697 to 0.697), respectively. The Patz and PanCan models had AUCs of 0.666 (0.667, 0.667 to 0.667) and 0.727 (0.727, 0.727 to 0.727), respectively. All of the AUCs calculated from the bootstrap samples were approximate to the original sample AUCs; the insample AUCs from the polynomial and patient characteristics models were optimistic by 0.010 and 0.005, respectively. Measuring calibration using the Hosmer-Lemeshow test showed that the diameter and PanCan models were uncalibrated (p<0.001) (online supplementary appendix table 4).
- Download figure
- Open in new tab
- Download powerpoint
Logistic regression ROC curves of five risk prediction models. AUC, area under the ROC curve; ROC, receiver operating characteristics.
ROC AUC of 1000 bootstrap sample fitted models applied to the original sample
The polynomial model allowed to correctly select 10.4% (10.0 to 10.8%) of the participants who remained cancer-free 1 year after T0 to skip T1 without delaying a single cancer diagnosis; this is four times better than the PanCan model (2.7%, 2.5% to 2.9%) and eight times superior to the patient characteristics model (1.3%, 1.2% to 1.4%). Figure 3 took components from the ROC curve in the polynomial model and plotted them against the risk threshold. Here, the absolute probabilities of true positive (lung cancer diagnosis within 1 year of T1) and false positive (no lung cancer within 1 year of T1) rates across several risk thresholds are shown.
- Download figure
- Open in new tab
- Download powerpoint
True positive and false positive rate probabilities against risk threshold using the polynomial model. The two thinner lines encompassing each thicker line represent the 95% CIs.
Despite the polynomial model being superior in terms of AUC, the left side of its ROC curve (false positive rates 0.0–0.1) converges with those from the diameter and PanCan models, signifying that their predictive performance for higher risk participants are equivalent.
The Patz model, based on the binary variable ‘T0 screening outcome,’ only includes one point on the graph. We replicated this model, which resulted in avoiding 18 052 (73.6%, 72.8 to 73.9) 1-year follow-up scans at the expense of delaying 71 (40.8%, 33.5% to 48.5%) diagnoses. The disadvantage is that only one threshold exists which is inferior to the parsimonious and polynomial models.
The AUCs of the patient characteristics and diameter models were very similar despite each having peak performances at different risk levels.
Lung cancer staging
Table 3 includes the American Joint Committee on Cancer seventh edition cancer TNM staging distribution of the hypothetically delayed diagnoses. About a third of the delayed diagnoses would have been staged TNM III or IV. In other words, these participants seemingly developed a late-stage cancer within 1 year after nothing suspicious was discovered at T0.
To investigate this, an experienced radiologist, ETS, attempted to locate the cancers on the T1 scans based on the data provided. If a lesion was confidently identified as a malignancy, the same location on the corresponding T0 scan of the same participant was checked. Out of the 25 stage III and IV cancers which would have had delayed diagnoses at a 50% sensitivity threshold using the polynomial model, 18 were confidently identified in the T1 scans, of which 8 were already visible and larger than 4 mm in the T0 scan (2 more were retraceable but smaller than 4 mm). Hence, at least 32.0% of the late-stage lung cancer diagnoses could have been diagnosed a year earlier but were missed or deemed benign.
Discussion
With the aim of personalising follow-up intervals in lung cancer screening programmes, we created and compared prediction models for lung cancer diagnosis between 1 year and 2 years after a CT scan, based on a large high-risk CT screening cohort.
Our results show that there is indeed room for efficiency improvement after establishing screening programme eligibility criteria. By individualising follow-up intervals after the baseline CT scan using patient characteristics and baseline CT scan findings, the number of superfluous 1-year follow-up scans can be reduced. However, the number of saved follow-up CTs need to be balanced against the number of delayed diagnoses.
Model-specific discussion
Polynomial model
The polynomial model is the model with the best overall performance reported in this study (figure 2, table 4), with the more specific clinical consequences being displayed in figure 3 and table 3. Though not mentioned here, a base parsimonious model which did not use polynomials was also created (see online supplementary appendix). Its performance was equivalent to that of the polynomial model (online supplementary appendix tables 2–4 and figure 1). However, the polynomial model was featured because it requires fewer variables than the base parsimonious model (11 vs 14). This phenomenon is likely explained by the non-linear relationship between most continuous variables and the risk of lung cancer; polynomial transformation allows this complex relationship to be incorporated rather than using other highly collinear variables as a compensating mechanism.
The use of polynomials reintroduces the risk of overfitting, as it is possible to get increasingly good fits on the original data by increasing the power of the polynomials. To avoid this, only polynomials to the second power were used; bootstrapping showed that there was only a slight optimism of the bootstrapped AUC (0.785) compared with the insample AUC (0.795).
Patient characteristics model
There are numerous published lung cancer risk models using only patient characteristics that could be validated on this study’s data set, namely the Bach, Spitz, Liverpool Lung Project, Etzel, PLCOM2011 (prostate, lung, colorectal, and ovarian cancer screening trial 2011 model version), PLCOM2012 (PLCO 2012 model version), Kovalchik and Pittsburgh Predictor models.5 14–20 Rather than replicating each model, the patient characteristics model was created with the data at hand to show the contrast in predictive accuracy when lacking scan data. We show that omitting CT scan predictors significantly increases the NND and the number of delayed diagnoses at a given specificity.
Patz model
An important limitation of most of our models is the large number of variables required to produce a reliable risk prediction. To a general extent, more variables produce better models; the potential drawback is that the data have to first be made available. Patz and colleagues created a simple model based on the NLST definition of a positive baseline scan: Participants who had a negative screening result at T0 may skip the first follow-up annual screening round.7 We replicated this model, which resulted in avoiding 18 052 (74.1%) 1-year follow-up scans at the expense of delaying 71 (40.8%) diagnoses. The disadvantage is that only one threshold exists which is inferior to the polynomial model; its advantage is simplicity.
Diameter model
The diameter model was included to demonstrate the added value of nodule size information. It is also an extension of the Patz model. The patient characteristics model included seven variables and the diameter model only one, yet their AUCs can both be rounded to 0.70. Despite this, the curves do not overlap; rather, the patient characteristics model performance at higher risk was superior to the diameter model, and vice versa for lower risk. Actually, the poor predictive capability of the diameter model at lower risk is due to the lack of nodule data for diameters less than 4 mm; up to a false positive rate of 0.1, the ROC curve is virtually identical to that of the Patz model. This would explain why the model was uncalibrated (p<0.001).
PanCan model
The PanCan model (full model with spiculation) calculates cancer risk in individual nodules based on patient characteristics and CT scan data.6 As mentioned above and in the online supplementary appendix, some scan variables used for calculating the PanCan risk score in our study were slightly different from those originally intended. The presence of any non-solid, part solid, upper lobe located, and spiculated nodules in the entire scan were included in an individual participant’s PanCan risk score.
The PanCan model was validated in other cohorts and has become a relatively popular prediction tool incorporated, for example, in the recently published British Thoracic Society guidelines for nodule management.21–24 White and colleagues validated the PanCan model in a NLST validation data set and presented an AUC of 0.963 compared with our 0.727.25 This considerable difference can be explained by the fact that they included an unrepresentative sample of participants who had exactly one pulmonary nodule detected at T0 (n=4431). Whereas the average longest diameter in benign and malignant nodules in this study was 7.7 mm and 12.2 mm, respectively, those in White and colleagues' study were 6.3 mm and 21.2 mm, respectively. The larger average difference in nodule size between cancers and non-cancers enables the discrimination of the two to be a much easier task. Regardless, it must be kept into consideration that the models’ objectives differ: The PanCan provides a nodule malignancy risk within an unspecified period of time (validated in data sets with up to 12.6 years follow-up) whereas our models provide a lung cancer risk between 1 year and 2 years of the baseline scan. Therefore, it is not surprising that the data were not consistent with this model’s outcome distribution (p<0.001) (online supplementary appendix table 4).
The PanCan model ROC curve appears to be a combination of the peak performances of the patient characteristics or diameter models, though inferior to the polynomial model. The greatest limitation of the PanCan predictor is its necessity for at least one nodule to be present to be able to make an accurate prediction.
Existing literature
Many lung cancer risk models have been published, of which most are based solely on patient characteristics.5 26 27 Models which included genetic variables are the Expanded Spitz, Improved Liverpool Lung Project, Young and Li models.14 28–30 Clinical outcomes such as symptoms and blood test results were included in the Hippisley-Cox, Park and Iyen-Omofoman models.31–33 The Recalibrated Bach model is the only lung cancer risk model which uses both the baseline scan and functional scores.34 The NLST did not include these additional measures.
Pastorino and colleagues compared annual and biennial screenings in the Multicentric Italian Lung Detection Trial (besides the control group), but no risk model was used to assign subjects to each arm; neither group showed a statistically significant protective effect over the control group, although this is probably due to the small sample size.35
The Dutch-Belgian Randomised Lung Cancer Screening Trial included screening intervals of 1 year, 2 years and 2.5 years.36 A significant difference in the number of late-stage and interval cancers of a 2.5-year interval compared with the 1-year and 2-year intervals was shown, though no difference was found between the 1-year and 2-year intervals. Two-year lung cancer probability in participants with no detected pulmonary nodules—more than half of the sample size—was 0.4%; it was hereby suggested to apply a 2-year screening interval to these cases.
Strengths and limitations
A major limitation of this study is its retrospective character. We do not know the actual impact of delayed diagnoses on lung cancer mortality, the most relevant outcome. However, to perform a randomised controlled trial—a fixed 1-year screening interval group versus a tailored intervals group—would be extremely costly; modelling studies remain the most viable alternative.
Again, our models do not predict the immediate lung cancer risk; thus, it would be necessary to use it alongside a protocol for findings that requires a follow-up intervention within 1 year of the baseline scan. Also, as the NLST was limited to three screening time points, our models’ predictive capabilities beyond the first 2 years are unknown. The availability of at least one follow-up CT scan provides valuable novel information on nodule growth over time; our models do not take this into consideration.
Pinsky and colleagues showed that there was a large variation in inter-radiologist nodule detection rates in the NLST; it is highly likely that the same limitation applies to nodule characteristics.37 This issue hampers the creation of a perfect model, as one radiologist may systematically label each participant with a lower risk score than another radiologist.
Another limitation is that our models were not validated on an independent data set. Considering that the NLST data used in this study are by far the largest lung cancer screening data set available—with also the highest number of participating radiologists—the models created from the data are expected to have a high external validity. Despite this being the case, having ‘only’ 174 lung cancer cases can be considered a limitation for the development of risk models (see online supplementary appendix).8 Therefore, a maximum of 17 variables was preselected for each model (if applicable) as shown in table 2; this selection was mainly based on recurring variables used for other models.5 7 14–20 26–34
Age and smoking behaviour are widely accepted risk factors already used as inclusion criteria for lung cancer screening programmes. Previously having a cancer increases the risk for developing future cancers,5 16 31 and lung cancer is also known to be linked to asbestos exposure and COPD.5 12 14–17 28 30 Though previously described, gender,6 14 17 19 21 29 33 family history of lung cancer5 6 16 18 19 29 and the prior diagnosis of pneumonia were not included in any of our parsimonious models (p>0.20).4
In terms of CT features, nodule size is considered the best predictor of malignancy.6 21 34 Longest diameter and perpendicular diameter were used; automatic nodule volume measurements were not available despite this having been shown to have a better specificity and positive predictive value than diameter for deciding pulmonary nodule management.36 38 Emphysema on the scan was expected to somewhat reflect COPD diagnosis.6 19 34 As pulmonary nodules are commonly described as one of three types, the risk of part solid and non-solid nodules are referenced against the more prevalent solid nodules; however, the relationship appears to differ strongly among models.6 34 Spiculation, a phenomenon thought to be associated with unrestrained and asymmetrical tumour growth, is usually regarded as a red flag in the radiological community.6 39 The variable is only present in a minority of malignancies, but is considerably less common in benign opacities. Finally, nodule count was recently shown to have a negative parabolic relationship with malignancy risk, also confirmed by the coefficients in our polynomial model.6 38
Although other aspects such as race, educational level, socioeconomic status and second-hand smoke exposure were also deemed relevant for the prediction models, these variables lack a standardised classification system and would thus be difficult to apply to different cohorts.
Conclusion
In conclusion, we have reported five lung cancer risk models based on patient characteristics and CT scan data from the largest lung cancer CT screening data set available, with the aim of personalising the follow-up interval of individual participants to either 1 year or 2 years following the baseline scan. The patient characteristics model represents the best performance achievable without scan information. The diameter and Patz models represent simple models only using the best lung cancer predictor: pulmonary nodule size. The PanCan model is a renowned and widely used model predicting pulmonary nodule malignancy risk. We showed that the polynomial model—including both patient characteristics and scan morphology variables—is superior to all aforementioned models.
Implementation of personalised follow-up intervals could noticeably reduce screening programme costs, as well as participant radiation exposure and radiologist workload, without delaying a remarkable number of diagnoses. Using the polynomial model, 10.5% of T1 scans could be saved without delaying a single cancer diagnosis. Alternatively, a third and half of the T1 scans could be avoided at the expense of 5.2% and 12.6% delayed diagnoses, respectively.
Acknowledgments
The authors thank Rogier Donders, biostatistician at Radboudumc, for support and advice on statistical methods. The authors also thank the National Cancer Institute for access to NCI data collected by the National Lung Screening Trial.
References
Footnotes
Contributors Study concept and design: AS, BvG, CMS-P, MP. Acquisition, analysis or interpretation of data: All authors. Drafting of the manuscript: AS. Critical revision of the manuscript for important intellectual content: All authors. Statistical analysis: AS. Administrative, technical or material support: CJ, ETS. Study supervision: AS, BvG.
Funding The authors have not declared a specific grant for this research from any funding agency in the public, commercial or not-for-profit sectors.
Competing interests BvG reports other from Thirona, grants from Mevis Medical Solutions, grants from Delft Imaging Systems, all outside the submitted work. CJ reports grants from MeVis Medical Solutions AG, Bremen, Germany, outside the submitted work. MP reports personal fees from Bracco, Bayer, Canon, and Siemens, grants from Canon and Siemens, other from Thirona, all outside the submitted work. AS, CSP, and ETS have nothing to disclose.
Patient consent Not required.
Ethics approval The institutional review boards of 33 participating medical institutions.
Provenance and peer review Not commissioned; externally peer reviewed.