Article Text

Abstract
Introduction Lung cancer outcomes in England are inferior to comparable countries. Patient or disease characteristics, healthcare-seeking behaviour, diagnostic pathways, and oncology service provision may contribute. We aimed to quantify associations between geographic variations in treatment and survival of patients in England.
Methods We retrieved detailed cancer registration data to analyse the variation in survival of 176,225 lung cancer patients, diagnosed 2010-2014. We used Kaplan-Meier analysis and Cox proportional hazards regression to investigate survival in the two-year period following diagnosis.
Results Survival improved over the period studied. The use of active treatment varied between geographical areas, with inter-quintile ranges of 9%–17% for surgical resection, 4%–13% for radical radiotherapy, and 22%–35% for chemotherapy. At 2 years, there were 188 potentially avoidable deaths annually for surgical resection, and 373 for radical radiotherapy, if all treated proportions were the same as in the highest quintiles. At the 6 month time-point, 318 deaths per year could be postponed if chemotherapy use for all patients was as in the highest quintile. The results were robust to statistical adjustments for age, sex, socio-economic status, performance status and co-morbidity.
Conclusion The extent of use of different treatment modalities varies between geographical areas in England. These variations are not attributable to measurable patient and tumour characteristics, and more likely reflect differences in clinical management between local multi-disciplinary teams. The data suggest improvement over time, but there is potential for further survival gains if the use of active treatments in all areas could be increased towards the highest current regional rates.
- lung cancer
- lung cancer chemotherapy
- surgery
- radiotherapy
- survival
This is an Open Access article distributed in accordance with the Creative Commons Attribution Non Commercial (CC BY-NC 4.0) license, which permits others to distribute, remix, adapt, build upon this work non-commercially, and license their derivative works on different terms, provided the original work is properly cited and the use is non-commercial. See: http://creativecommons.org/licenses/by-nc/4.0/
Statistics from Altmetric.com
Key messages
What is the key question?
Is the local variation in lung cancer treatment in England associated with patient survival?
What is the bottom line?
Variations in the use of surgical resection, radical radiotherapy and chemotherapy are each associated with the survival of patients in the relevant stage groups.
Why read on?
If these results are appreciated among clinicians in lung cancer multi-disciplinary teams, and treatment rates are increased towards the currently highest levels, more than 800 lung cancer patients each year could have a clinically relevant extension of their lives.
Introduction
Lung cancer is a major burden of cancer morbidity and mortality in England.1 Survival from lung cancer has been lower in England than in comparable countries,2 3 but there are indications of improving survival in recent years, possibly linked to more active treatment.3–7
Early diagnosis of lung cancer is important and patients with localised cancers have a much greater chance of radical treatment and long-term survival.8 Recent papers have shown that the use of the fast-track 2 week referral route from the general practitioner to the diagnostic and oncology services is associated with favourable stage distribution and with higher survival of cancer patients.9–11 Conversely, long waiting times for treatment are associated with stage progression.12 13
There remain important variations in lung cancer outcomes linked to region of residence, hospital of first attendance, socio-economic position, co-morbidity, tumour stage, histological type, and biological markers of prognosis, and there are separate variations in relation to local patterns of oncology treatment and care provision.14–17
The aim of this study was to assess the magnitude of variation in the use of active treatments for lung cancer, and to identify potential opportunities to reduce variation and improve outcomes.
Data and methods
From the Cancer Analysis System in Public Health England, we extracted cancer registration data on patients with primary lung cancer, diagnosed between 2005 and 2014. If a person had more than one primary lung cancer, only the first record was considered.
Age at diagnosis, sex, topography (the anatomic location of the primary tumour), histology (the cell type of the cancer), performance status and tumour stage were retrieved from the cancer registration records. Socio-economic status was taken as the quintile of the index of multiple deprivation 2010, based on the local area of residence at the time of cancer diagnosis.18 Co-morbidity was assessed by the Charlson co-morbidity index, derived from hospital discharge diagnosis from in-patient hospital admissions in the 2 year period from 27 months to 3 months before cancer diagnosis.19–21
Unspecified codes for performance status, topography, histology and stage were retained as separate categories in the analysis. Performance status data were only available in the period 2010–2012. Persons with no in-patient hospital activity in the relevant period were assigned a co-morbidity score of zero.
At the level of the individual patient, the initial active cancer treatments (surgical resection; radical radiotherapy; chemotherapy) were derived from surgical procedure codes in Hospital Episode Statistics data, or from treatment tables in the Cancer Analysis System (radiotherapy; chemotherapy). The periods of treatment were from the month before cancer diagnosis to 6 months after for surgery and chemotherapy, and from 3 months before diagnosis to 12 months after for radiotherapy.
We used Primary Care Trust (PCT) organisation areas for the geographical analysis of treatment rates (the proportion of patients given particular treatments). There were 151 PCT organisations operating in England in the period 2006–2013 with an average population of 3 42 000 people.
The proportions of patients with different initial treatments were computed for each PCT area, and patients were thereafter grouped into quintiles based on PCT-level treatment rates.
Radiotherapy data were not available in 2014 and patients diagnosed in this year were assigned ‘not known’ codes for radiotherapy. Radical radiotherapy was assigned to patients in whom there was evidence from administration of 15 or more fractions of radiation.
We used Kaplan-Meier survival analysis to compute the cumulative risk of death from any cause at one, two and 5 year time-points after diagnosis for patients diagnosed in the period 2005–2014.
We did a cohort analysis to compute relative rates of death from any cause in the person-years experience from lung cancer diagnosis to death or censoring at 2 years of follow-up. This was implemented with Cox regression models. In models of chemotherapy, the HR was not constant over the 2 year follow-up period, and we therefore present hazard ratios computed over the initial 6 month period.
In the geographical analysis, the survival outcome was estimated for the entire patient population, regardless of individual treatments. The geographical treatment rate hereby serves as an ‘instrumental variable’22 and this has the potential to avoid the strong selection bias (‘confounding by indication’) that is inevitable if comparison is made directly between treated and untreated patients. Regression models were stratified by cancer stage, and in subsequent sensitivity analyses we did further adjustments for socio-economic status, performance status, co-morbidity, topography and histology. Sensitivity analyses of performance status were restricted to the period 2010–2012.
For selected models we used a shared frailty random effects model in order to account for the hierarchical nature of the data, with groups of patients belonging to the same PCT area. The results from the shared frailty models were in all cases virtually identical to the single-level models and results are, therefore, presented for the single-level models only.
To give an appreciation of the absolute magnitude of effects, we did a Kaplan-Meier analysis of patients in the relevant stage categories and compared survival of these patients in the quintiles of the geographical treatment rates. From the cumulative survival to the 2 year time point (surgery and radical radiotherapy) or the 6 month time-point (chemotherapy), we computed the approximate number of ‘avoidable deaths’, that is the number of deaths that could potentially be postponed beyond the 2 year or the 6 month time-point, if all patients had the same survival as those in the highest quintile of treatment rate.
In order to visualise the shapes of the relationships between the geographical treatment rates and the survival of patients in the relevant stage groups, we extended the five categories (quintiles) to 15 categories, and fitted quadratic functions to the resulting hazard ratios.
Results
We retrieved data on 3 44 825 persons who were resident in England with a first record of lung cancer (ICD10 C33 or C34) in the period 2005–2014 (figure 1). Data cleaning eliminated 9327 death-certificate-only registrations (2.7%) and small numbers of records with unknown vital status or date-sequence errors (for example when the recorded date of diagnosis was after the date of death). More detailed analyses were restricted to the period 2010–2014 (1 76 225 persons). At the time when these data were retrieved and prepared for analysis, radiotherapy data were not available for the year 2014, and persons diagnosed in 2014 (36 516) were assigned a missing value for radiotherapy. Similarly, performance status was only available for 2010–2012, and patients diagnosed in 2013–2014 were assigned a missing value for performance status.
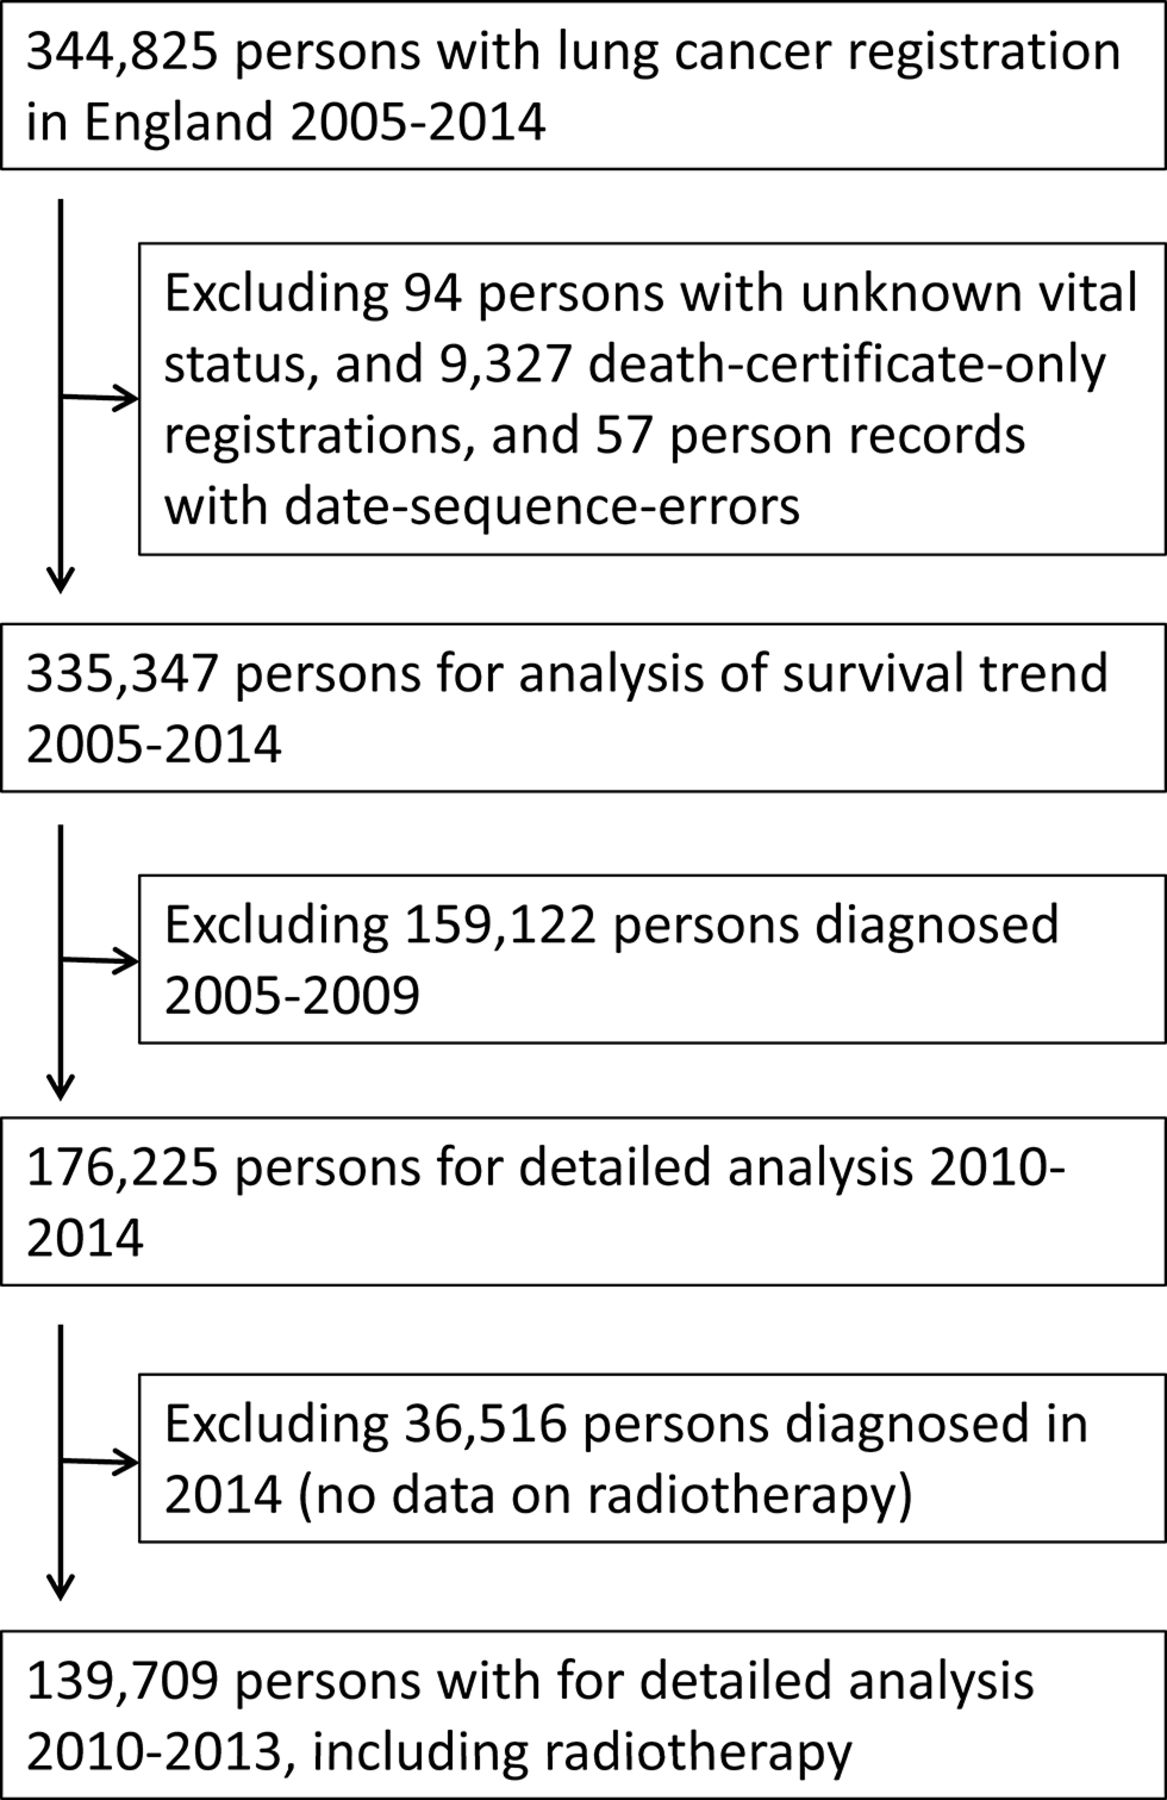
Inclusions and exclusions in lung cancer datasets 2005–2014, 2010–2014 and 2010–2013.
Figure 2 shows the trend in 1 year, 2 year and 5 year survival of lung cancer patients in England. The 1 year survival estimate increased by one percentage point per year, from 26% in 2005 to 36% in 2014.
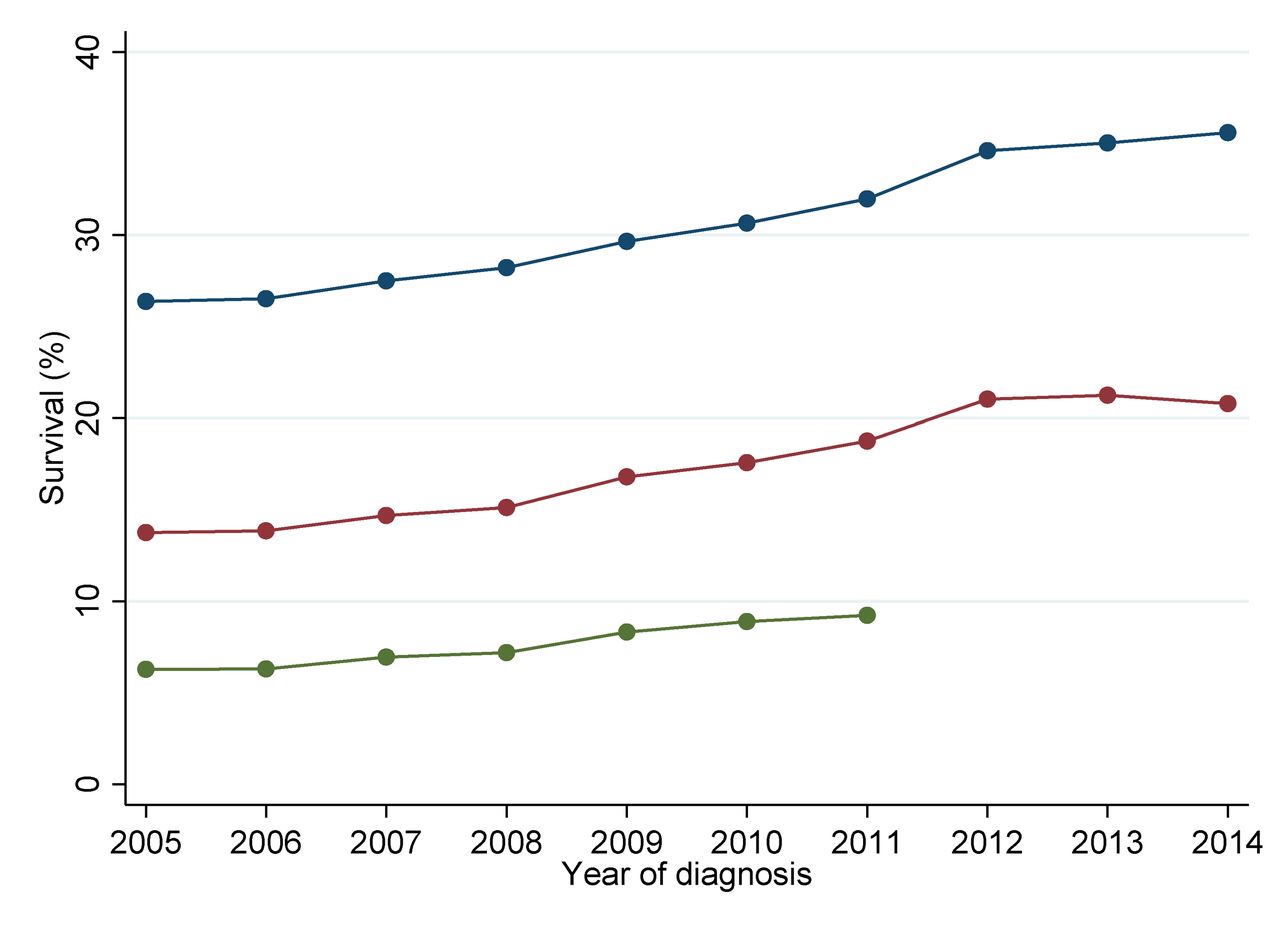
One-year (blue), 2 year (red) and 5 year (green) survival of lung cancer patients in England, diagnosed 2005–2014.
Table 1 gives an overview of the person and tumour characteristics of the 1 76 225 persons diagnosed in 2010–2014. In these recent data, tumour stage was recorded in 77% of the cases. The table also shows the tabulation of the individual cancer treatments administered at the time of diagnosis: surgical resection (13.1%), radical radiotherapy (8.1% of cases diagnosed in 2010–2013), and chemotherapy (28.7%). Of note, 48% of patients receiving radical radiotherapy also had chemotherapy, and 23% of the surgically resected patients also had chemotherapy.
Overview of person and tumour characteristics in lung cancer dataset, England 2010 – 2014 (n = 1 76 225), and the number of deaths during follow-up
Table 2 shows the geographical variation in the use of treatment modalities, represented by the quintiles of the distributions. Surgical resection varied from 9.3% of patients in the lowest quintile to 17.2% in the highest. Radical radiotherapy varied similarly between 4.0% and 12.9%, and chemotherapy varied between 21.6% and 34.5%.
Overview of geographically based treatment rates in lung cancer patients, England 2010–2014 (n=1 76 225)
Table 3A shows the analysis of all-cause mortality in relation to the geographical quintile of the PCT-level distribution of the use of surgical resection. The basic model was adjusted for age and sex (these adjustments did not change the estimates importantly, compared with the crude model). The HR was 0.84 (0.83–0.86) in the highest quintile compared with the lowest, and the statistical trend over the five quintiles was highly statistically significant. Exclusion of small-cell cancers from the analysis did not change this result. An analysis stratified by stage showed that the association between surgical resection and survival was largely restricted to patients with Stage I or II lung cancer (HR 0.80 (0.75–0.84) in highest vs lowest quintile). Further analyses showed that the association in Stage I and II patients was not confounded by socio-economic status, performance status, co-morbidity or the anatomic site of the cancer, but there was a small degree of confounding by tumour histology (fully adjusted model, HR 0.84 (0.80–0.89) between the extreme quintiles). The confounding by histology was due to a higher completeness of the recording of specific histology information in geographical areas with high surgical resection rates.
Analysis of survival of lung cancer patients in relation to the geographically based propensity to use surgical resection
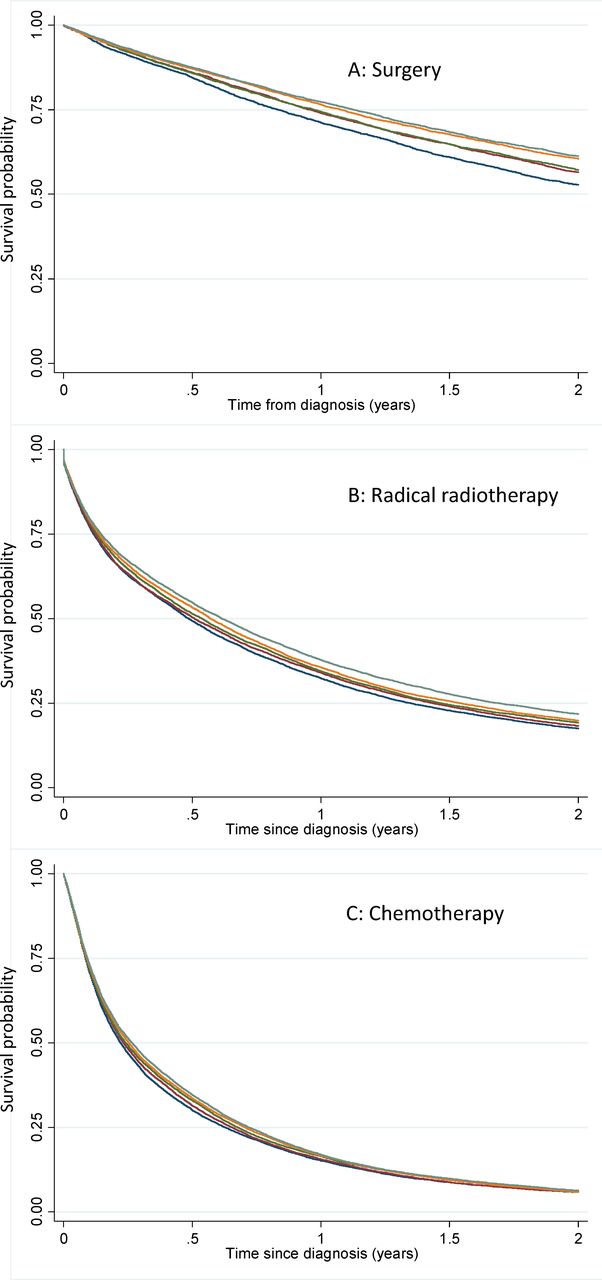
Figure 3A shows the Kaplan-Meier survival functions for Stage I and II patients in the five quintiles of resection rate. The variation in survival at the 2 year time-point was 8.5% points difference between the extreme quintiles. In absolute terms, the variability between the five quintiles corresponds to about 188 (95%CI 177 to 200) avoidable deaths per year at the 2 year survival time-point. This is the number of potentially avoidable deaths if all lung cancer patients in Stage I and II had the same survival as those in the highest quintile of surgical resection.

Kaplan-Meier survival functions for lung cancer patients, categorised by the quintiles of treatment rates in their area of residence. A: Survival of Stage I-II patients in relation to quintile of surgical resection rate. B: Survival of Stage III patients and patients with no record of stage, in relation to quintile of radical radiotherapy rate. C: Survival of Stage IV patients in relation to quintile of chemotherapy rate.
Table 3B shows the analysis of the geographical variation in radical radiotherapy. As for surgical resection, there was a statistically significant trend with higher survival in areas with high use of radical radiotherapy (HR 0.94 (0.92–0.95)) in the highest vs. the lowest quintile. Stratification by stage showed that the association was largely restricted to patients with Stage III cancer and patients with no record of stage, and these two groups were therefore combined. The estimate of 0.88 (0.85–0.90) for the highest vs. the lowest quintile was not confounded by socio-economic status, performance status, co-morbidity or tumour histology, but adjustment for the anatomic location of the tumour changed the estimate slightly to 0.92 (0.89–0.95). The confounding was due to a higher proportion of cases with unspecified anatomic site in geographical areas with low use of radical radiotherapy.
Figure 3B shows the Kaplan-Meier survival functions for patients with Stage III and patients with no record of stage in relation to the quintile of radical radiotherapy use. At the 2 year time-point, the difference between the extreme quintiles was 4.3 percentage points and the number of deaths potentially avoidable at the 2 year time-point was 373 (355-391) per year.
Table 3C shows the association between use of chemotherapy and patient survival in the 6 months following diagnosis. The HR was 0.90 (0.88–0.91) in the highest versus the lowest quintile of chemotherapy use. The survival gradient was largely due to an association with survival of stage IV patients (HR 0.90 (0.87–0.92)). This was not confounded by socio-economic group, performance status, co-morbidity or anatomic site of the primary cancer, but there was a degree of confounding (adjusted HR 0.94 (0.91–0.97)) due to less complete recording of histology in geographical areas with low use of chemotherapy.
Figure 3C shows the Kaplan-Meier survival function for Stage IV patients in the quintiles of chemotherapy use. The functions were separated by 4.6 percentage points at the 6 month time point, but converged towards the 2 year time-point. The number of potentially avoidable deaths at 6 months was 318 (302-333).
Discussion
Principal findings
We have shown a striking variation in patterns and rates of treatment for lung cancer across geographical areas in England. Surgical resection rates ranged from 9.3% for areas in the lowest quintile to 17.2% in the highest, with radical radiotherapy varying similarly from 4.0% to 12.9%. These differences are associated with outcomes including overall survival at 2 years. The proportion of patients receiving chemotherapy varied between 21.6% and 34.5%, and this was associated with survival at 6 months. Chemotherapy treatment rates did not affect 2 year survival, probably reflecting the poor longer-term prognosis for advanced lung cancer, irrespective of treatment. The data suggest important improvement in lung cancer survival over time, but there is potential for further survival gains if the use of active treatments in all areas could be increased towards the highest current regional rates.
Interpretation and caveats
It is a limitation that 57% of records in the full 2010–2014 dataset had a missing value for performance status (PS). The availability of PS information in the national cancer register changed in 2013 due to changes to the national lung cancer audit, which previously received this data from hospitals. However, a large proportion of the cohort (n=75 030) had non-missing PS data, and statistical adjustment for PS in the 2010–2012 sub-cohort did not change the estimated hazard ratios materially.
The incidence of most solid tumours increases with age, and lung cancer is, in general, a disease of the elderly. Median age at presentation in the UK is in the early 70s17 and is likely to increase in the future. This has implications for clinical management decisions relating to radical treatment, where operability and co-morbidity have a significant impact. Importantly, the heterogeneity of outcomes reported here remain significant after standardisation by age and other covariates. Although 72% of this national cohort is recorded as having a Charlson co-morbidity score of 0, this is based on in-patient activity data only, and therefore an under-estimate of the true extent of co-morbidity in the lung cancer population.
Socio-economic deprivation is associated with low cancer survival.23–25 In the case of lung cancer this effect is likely to be exaggerated by the very marked inverse association between socio-economic status and smoking prevalence.26 This is because lung cancer is one of many smoking-related diseases that may co-exist in the same patient, and these diseases may not have been recognised and recorded. The impact of socio-economic deprivation could also support the hypothesis that healthcare-seeking behaviours may contribute to the poor outcomes overall in England. However, even if systematic behavioural differences do exist between the population in England and in other European countries, the geographical variation in treatment rates reported here highlights an unsatisfactory heterogeneity in delivery of active treatment across the country, irrespective of demographics and co-morbidities.
The analysis of radiotherapy data was based on the new Radiotherapy Data Set (RTDS),27 which is in a relatively early stage of development and in need of data harmonisation and quality assurance. Although we attempted to identify patients receiving stereotactic ablative radiotherapy (SABR)28 by focusing on patients with multiple fractions of large doses of radiation, we did not succeed in distinguishing these patients from those treated with palliative intent. The numbers of patients being treated with SABR in England between 2010 and 2013 was relatively small, so this is unlikely to have materially influenced the results.
Regarding the associations between therapies, the main co-variation in these data was a gradient from little treatment towards more treatment (of each kind of treatment and of any kind of treatment). Therefore, the general message is about more active treatment, using the specific treatment modality that is appropriate in relation to the stage of the cancer in each patient. A secondary, less strong, gradient was seen between surgery and radical radiotherapy. However, as the effects on survival from surgery and from radical radiotherapy were manifest in separate strata of stage (surgery, stage I and II; radical radiotherapy, stage III), we did not pursue the analysis of surgery and radiotherapy as alternative strategies, based on these data. The next few years of data may perhaps be useful for a comparative study of surgery and radical radiotherapy (including SABR).
The present analysis is population-based, and includes all lung cancer patients nationally, regardless of hospital attendance or specialist oncology care. The survival outcomes we report are therefore expected to be inferior to patient groups seen in a lung cancer clinic setting29 or analysis restricted to those with a confirmed histological diagnosis.30 The advantage of the population-based setting is that it includes the entire lung cancer population, and avoids the selection bias that would arise from selective referral of patients into the lung cancer specialist service. As a consequence of the inclusive population-base of the study, data including stage and histology were not recorded for some patients, and we did not attempt to impute this information. The analysis showed that the completeness of recording of these variables seemed to be associated with other aspects of the local clinical treatment culture. We explored a wide range of stratifications and adjustments, and all the important findings are reported in the Results section. There was a small degree of sensitivity in some of the Cox regressions. Rather than reflecting on this as the modification of a causal effect, we think it is more likely that the causation is in the opposite direction, and that a particular treatment culture (like high use of surgical resection) is associated with the use of specific evaluation tools (like PET scanning and ultrasound guided tissue sampling), and that it hereby influences the recording of topography and histology. The association in these data was in the direction of more complete recording of topography and histology in clinical cultures with higher rates of active treatment.
The ‘instrumental variable’ analysis reported here looks at survival in combined treated and untreated cancer patients for each therapeutic modality. This avoids a direct comparison between treated and untreated patients, which would be subject to strong selection bias.31 32 The instrumental variable analysis approach can provide measures of effectiveness that are not confounded by the characteristics that would otherwise be strong confounders at the individual level (age, sex, socio-economic status, co-morbidity, performance status). Evidence of the validity of the results can be inferred from the absence of association between the potential confounder and the treatment quintiles, and from the lack of sensitivity of the estimated hazard ratios to statistical adjustment for the potential confounder.
The choice of the size of the geographical areas for derivation of the instrumental variables is somewhat arbitrary. If we chose too large an area (like Government Office Region) we get a mixture of clinical attitudes within each area, and we lose much of the potential variation between areas. If too small areas are chosen (like the full postcode) then each patient would likely have this area to themselves, and the design collapses to an individual-level analysis with its well known biases. The ideal area selection is somewhere in-between, but we are not aware of any current formal methodology to decide the best area size. Intuitively, it would seem preferable if the number of areas corresponds approximately to the number of clinical decision-making teams, and the PCT level could then be considered about right.
We used a shared frailty random effects model in order to account for the hierarchical nature of the data, with groups of patients belonging to the same PCT area. The results were in all cases virtually identical to the single-level models and results were, therefore, presented from the single-level Cox models.
We attempted to describe, in absolute terms, the number of deaths that correspond to the observed differences between the Kaplan-Meier survival functions at a selected time-point. The assumption is that the observed patients in the low-treatment culture could potentially get the same survival as the patients observed in the high-treatment culture. The support for this conjecture comes from the absence of confounding in the HR estimates in the Cox regression analyses.
In the observational setting, an analysis restricted to treated patients is likely to show that the survival of treated patients is lower when treatment rate is high. This is because a higher treatment rate is possible only by giving active treatment to a less favourable case-mix. Our analysis has focused on the overall clinical effectiveness of different treatment strategies and patterns.
Changes over time and comparison with another population
It is a limitation of this work that we have studied short-term survival, and there is no consideration of patient experience or quality of life. This short-term emphasis is appropriate for lung cancer patients, who have a poor prognosis compared with most other cancers, irrespective of treatment modality. Despite this, the increase in 1 year survival of one percentage point per calendar year is evidence of remarkable progress (figure 2). It has been shown that this improvement in survival is strongest in the early stage group.33 The geographical variability in surgical resection has increased most where it was higher already.34 It would be preferable to see over time a decrease in the geographical variation, and these trends should continue to be monitored for all the treatment modalities. Some initiatives have been taken in an effort to address this, with a recent significant increase nationally in both the number of surgical resections for lung cancer, and in the number of specialist thoracic surgeons.35 36
Results from other national registries show that the highest treatment quintiles in England are in line with international standards. The surgical resection rate in 2014 was 13.1% in England and 16.3% in Denmark.37 Overall curative intended treatment rates were 19.5% and 30.6%, respectively. The differences in treatment intensity are associated with differences in survival between the two countries. One-year survival in 2014 was 36% in England and 46% in Denmark. Similarly, 2 year survival was 20% and 29%, respectively, and 5 year survival was 9% and 13%, respectively.
Clinical and policy implications
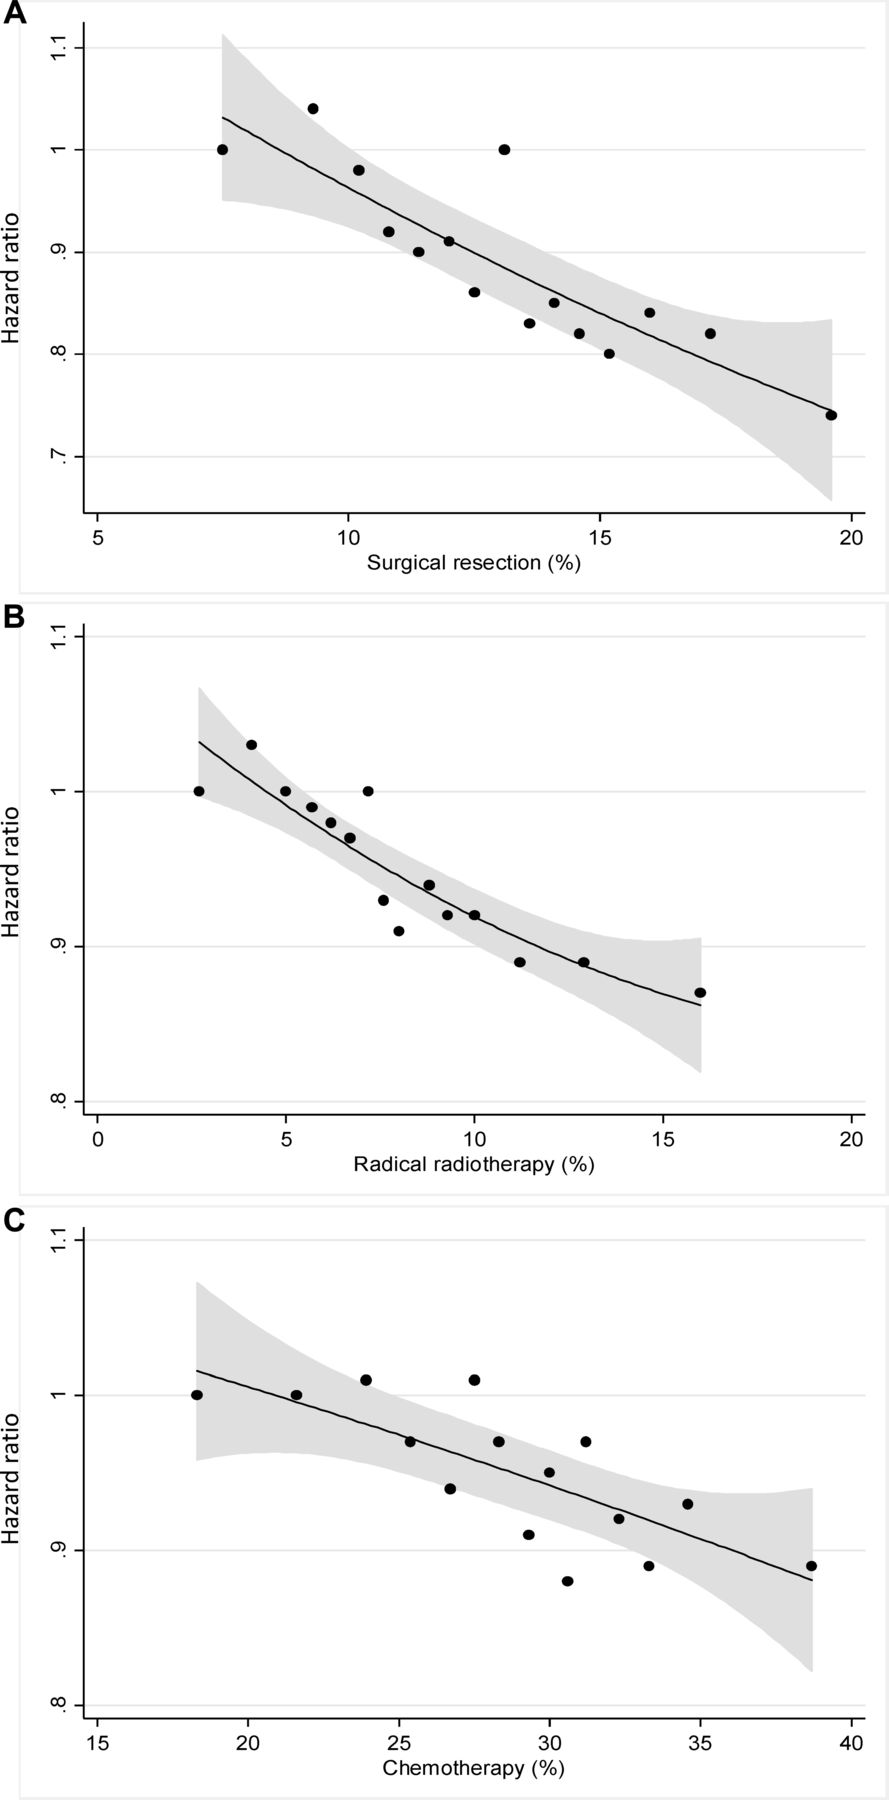
We have observed superior survival associated with higher use of active treatment in lung cancer. Therefore there is certainly room for enhanced delivery of care in some geographical areas in England. However, there must be a point beyond which further increase in treatment rates yields no further survival improvement, or may even lead to inferior outcomes. Our analyses indicate linear relationships between treatment rates and survival that extend to the highest range of treatment rates for each modality (figure 4). We conclude that even the highest treatment rates that we observe are still below the levels required for optimal survival outcomes.
Plots of the HR for death in 15 equal-sized groups of patients from geographical areas, from the lowest to the highest geographical treatment rates. A: Survival of Stage I-II patients in relation to surgical resection rate. B: Survival of Stage III patients and patients with no record of stage, in relation to radical radiotherapy rate. C: Survival of Stage IV patients in relation to chemotherapy rate. Quadratic functions were fit to the 15 data points and are presented with 95%CIs.
Regional variation in lung cancer treatment and outcomes in the UK has been examined in several previous studies,17 34 38 and it has been suggested that major outcome improvements at a population level would be achievable if all services were equivalent to the best performing clinical teams in the UK.39 Our data validates this suggestion and quantifies the absolute numbers of deaths potentially preventable by more uniform care provision. The mechanisms required to achieve this range from improving access to more specialised lung cancer multi-disciplinary teams,4 to increasing the numbers of specialist thoracic surgeons.38
The National Health Service in England has developed guidance for regional commissioning bodies based on the best lung cancer services provided at major centres. This guidance suggests local provision where possible, with support from larger centres if necessary. Implementation of these recommendations remains a demanding challenge because multiple institutions and clinical services must be coordinated in each geographical region, but our data demonstrates that the potential benefits are significant and achievable. We have established that a clinical culture that is active in its use of available therapies improves outcomes for the lung cancer patients in its community.
Supplementary file 1
References
Supplementary materials
HTML Page - index.htslp
Files in this Data Supplement:
Footnotes
Contributors HM, VHC and DT designed the study. VHC, DT and HM assembled the data set. HM analysed the data. All authors contributed to the interpretation of the results. HM and JS organised the drafting of the manuscript. All authors contributed to the writing of the manuscript and approved the final version.
Funding The study was supported by the National Cancer Registration and Analysis Service, Public Health England, and by the National Institute for Health Research (NIHR) Biomedical Research Centre at Guy’s and St Thomas’ NHS Foundation Trust.
Disclaimer The views expressed are those of the authors and not necessarily those of Public Health England, NIHR, NHS, or the Department of Health.
Competing interests TR has a personal grant from the National Institute for Health Research during the period of this work. DRB has received personal fees from Astra Zeneca, outside the submitted work. Other authors have no competing interest to declare.
Patient consent Detail has been removed from this case description/these case descriptions to ensure anonymity. The editors and reviewers have seen the detailed information available and are satisfied that the information backs up the case the authors are making.
Ethics approval The study was covered by Section 251 of the National Health Service Act 2006 which enables the collection and analysis of cancer registration data in England. Therefore, separate ethical approval was not required for this study.
Provenance and peer review Not commissioned; externally peer reviewed.
Data sharing statement This work uses data provided by patients and collected by the NHS as part of their care and support.