Article Text

Abstract
Objectives To characterise the sketetal muscle metabolic phenotype during early critical illness.
Methods Vastus lateralis muscle biopsies and serum samples (days 1 and 7) were obtained from 63 intensive care patients (59% male, 54.7±18.0 years, Acute Physiology and Chronic Health Evaluation II score 23.5±6.5).
Measurements and main results From day 1 to 7, there was a reduction in mitochondrial beta-oxidation enzyme concentrations, mitochondrial biogenesis markers (PGC1α messenger mRNA expression (−27.4CN (95% CI −123.9 to 14.3); n=23; p=0.025) and mitochondrial DNA copy number (−1859CN (IQR −5557–1325); n=35; p=0.032). Intramuscular ATP content was reduced compared tocompared with controls on day 1 (17.7mmol/kg /dry weight (dw) (95% CI 15.3 to 20.0) vs. 21.7 mmol/kg /dw (95% CI 20.4 to 22.9); p<0.001) and decreased over 7 days (−4.8 mmol/kg dw (IQR −8.0–1.2); n=33; p=0.001). In addition, the ratio of phosphorylated:total AMP-K (the bioenergetic sensor) increased (0.52 (IQR −0.09–2.6); n=31; p<0.001). There was an increase in intramuscular phosphocholine (847.2AU (IQR 232.5–1672); n=15; p=0.022), intramuscular tumour necrosis factor receptor 1 (0.66 µg (IQR −0.44–3.33); n=29; p=0.041) and IL-10 (13.6 ng (IQR 3.4–39.0); n=29; p=0.004). Serum adiponectin (10.3 µg (95% CI 6.8 to 13.7); p<0.001) and ghrelin (16.0 ng/mL (IQR −7–100); p=0.028) increased. Network analysis revealed a close and direct relationship between bioenergetic impairment and reduction in muscle mass and between intramuscular inflammation and impaired anabolic signaling. ATP content and muscle mass were unrelated to lipids delivered.
Conclusions Decreased mitochondrial biogenesis and dysregulated lipid oxidation contribute to compromised skeletal muscle bioenergetic status. In addition, intramuscular inflammation was associated with impaired anabolic recovery with lipid delivery observed as bioenergetically inert. Future clinical work will focus on these key areas to ameliorate acute skeletal muscle wasting.
Trial registration number NCT01106300.
- respiratory muscles
- ARDS
Statistics from Altmetric.com
Key messages
What is the key question?
To investigate if ATP bioavailability and lipid metabolism are drivers of the early and rapidly acute skeletal muscle wasting that occurs during critical illness.
What is the bottom line?
In this first study to investigate the relationship between bioenergetics changes and skeletal muscle wasting during early critical illness, alterations in fat metabolism and ATP abundance are associated with the severity of inflammation and altered oxygen signalling, which could be considered as targets for future therapies.
Why read on?
Skeletal muscle wasting in critical care is associated with impaired lipid oxidation and reduced ATP bioavailability, driven by intramuscular inflammation and altered hypoxic signalling, which may account for the inconsistent outcome observed in the nutrition and exercise clinical trials.
Introduction
Acute skeletal muscle wasting occurs early and rapidly in critical illness1 and is reported to be a major driver of long-term disability.2 Indeed, muscle wasting is associated with increased length of intensive care unit (ICU) stay,1 hospital stay1 and mortality.3 It is underpinned by a fall in muscle protein synthesis,1 a process which, in healthy individuals, is responsive to exercise and amino acid loading.4 However, clinical trials of enhanced nutritional support5–8 and early exercise training9–12 in acute critical illness have yielded inconsistent results in terms of amelioration of muscle wasting and improvement in physical function.
Muscle protein synthesis is ATP dependent.13 14 The observed reduction in early critical illness15 16 may be the result of decreased mitochondrial number or function, or both.15 16 These defects of metabolism may be the result of decreased substrate utilisation including glucose, a well-recognised complication of critical illness. Furthermore, the metabolic anomalies observed could be the consequence of the decreased utilisation of other energy substrates, such as fatty acids. This may, in part, account for the failure to show benefit in the previous nutrition and exercise clinical trials.5–12 17
Systemic hypoxia and inflammation are part of the phenotype of critical illness18–20 and both can impair mitochondrial function16 and muscle protein synthesis.21 22 These interactions are complex23 and, as yet, incompletely elucidated with limited data available reporting the relationship between loss in muscle mass and skeletal muscle hypoxia and inflammation.
While mitochondrial dysfunction has reported,15 16 24 these data have not investigated the relationship with skeletal muscle wasting and muscle protein turnover. We investigated the relationships between loss in muscle mass in early critical illness and skeletal muscle inflammatory, hypoxic and protein homeostatic signalling together with the bioenergetic status.
Methods
Patients were those enrolled in the previously described MUSCLE study (NCT01106300, www.clinicaltrials.gov).1 At enrolment, written assent was obtained from the next of kin with retrospective patient consent obtained when full mental capacity was regained.
Patients were recruited within 24 hours of admission to a university hospital and a community hospital ICU. All were anticipated to be invasively ventilated for >48 hours and to spend >7 days in, and survive, ICU. Patients were excluded if these criteria were not met and if they were pregnant or a lower limb amputee, or suffering primary neuromuscular disease or disseminated cancer. Vastus lateralis biopsies (days 1 and 7) were performed and snap-frozen in under 10 s. Serum samples (days 1, 3, 7 and 10) and physiological data were collected as described.1
Mitochondrial components
Electron transport chain component protein concentrations were determined, as were those of key enzymes of fatty acid transport (carnitine palmitoyltransferase-1), beta-oxidation (medium chain acyl-CoA dehydrogenase) and oxidation of unsaturated fatty acids (2,4-dienoyl-CoA reductase 1) using muscle homogenates (Luminex technology; FLEXMAP 3D, Merck Millipore; online supplementary table S1). The peroxisomal beta-oxidation enzyme multifunctional enzyme-2 was quantified as was the electron transport system electron carrier electron transferring flavoprotein.
Supplemental material
Bioenergetic quantification
Intramuscular ATP, free creatine and phosphocreatine levels were fluorometrically measured.25 These were compared against unpublished data from 31 healthy subjects comprising both those with and without stable chronic disease, as per our patient cohort (online supplementary table S7). Intracellular energy sensor AMP-K protein concentration was measured by using western blot analysis.
Muscle metabotyping
Thawed muscle tissues underwent extraction and the organic phase was used for ultra performance liquid chromatography and tandem mass spectrometry optimised for lipid profiling as previously described.26
Mitochondrial biogenesis
Mitochondrial DNA copy number (CN) and messenger RNA (mRNA) expression of members of the peroxisome proliferator-activated receptor gamma coactivator 1 family (PGC1α, PG1β and PPRC-1, central regulators of mitochondrial metabolism and biogenesis27) were independently quantified (quantitative PCR: qStandard, London, UK; online supplementary table S2) and reported as normalised CN. Expression of dynamin-related protein 1 (DRP-1; a marker of mitochondrial fission28) was determined.
Adipokine and ghrelin response
ELISA (Merck Millipore; online supplementary table S3) of serum ghrelin and adipokinin concentrations was performed.
Intramuscular hypoxia and inflammation
We measured intramuscular concentrations of hypoxia-inducible factor 1 alpha (HIF-1α, the primary hypoxia-induced transcription factor) (Luminex technology; FLEXMAP 3D) and pro-inflammatory/anti-inflammatory cytokines (high-sensitivity evidence investigator chip array, Randox Antrim).
Statistical analysis
Data were assessed for normality (D’Agostino-Pearson omnibus test), and analysed using Student’s t-test, Pearson’s coefficient, Mann-Whitney U test and Wilcoxon’s signed rank tests as appropriate. Parametric data are reported as mean (CIs) and non-parametric as median (IQR).
Metabotyping
Two forms of data reduction (principal components analysis and partial least squares discriminant analysis) were used for visualisation of untargeted profiling data. Principal component analysis (LCMS data) visualised inherent clustering and identified outliers. Partial least squares discriminant analysis was performed to maximise class differences between day 1 and day 7 samples while minimising variability unrelated to class. These were used to identify metabolites whose concentration was different between day 1 and day 7 and thus determine metabolites of importance. These were then presented as raw data to confirm the changes identified in the multivariate methods.
Network analysis
Each variable was represented as a node, and edges weighted by pairwise Pearson’s correlation coefficient (threshold r>0.4). Temporal changes (change from day 1 to day 7) in concentrations of active moieties of the anabolic/catabolic signalling pathways, physiological and nutritional data and muscle mass were included.1 Clinical variables include were those of statistical significance in our previously published multivariate analysis.1 McClust29 was implemented in Cytoscape (www.cytoscape.com)30 to reveal complex relationships otherwise hidden. As in all network analyses, multiple comparison were not corrected for as p values were not determined.31
See online supplementary file for further methodological details.
Results
The characteristics of the cohort have been previously described.1 Of the 91 patients recruited, 63 fulfilled criteria for longitudinal analysis. Serial vastus lateralis biopsy samples were available from 33 patients and serum for 59, and metabotyping performed on a subcohort of 15 (online supplementary figure S1). The characteristics of the whole cohort, patients biopsied and those metabotyped did not differ (all p>0.05), except that the proportion of males was higher among those metabotyped (80.0% vs 58.7%; p=0.047) (table 1).
Baseline characteristics of patients
Mitochondrial components
No change was observed in individual mitochondrial respiratory complex protein concentrations between day 1 and day 7 (all p>0.050, online supplementary figure S2, table S4). Mitochondrial beta-oxidation enzyme concentrations decreased (all p<0.050, online supplementary figure S3, table S5), while concentrations of multifunctional enzyme-2 (extra-mitochondrial beta-oxidation) were unchanged (p=0.666).
Bioenergetic data
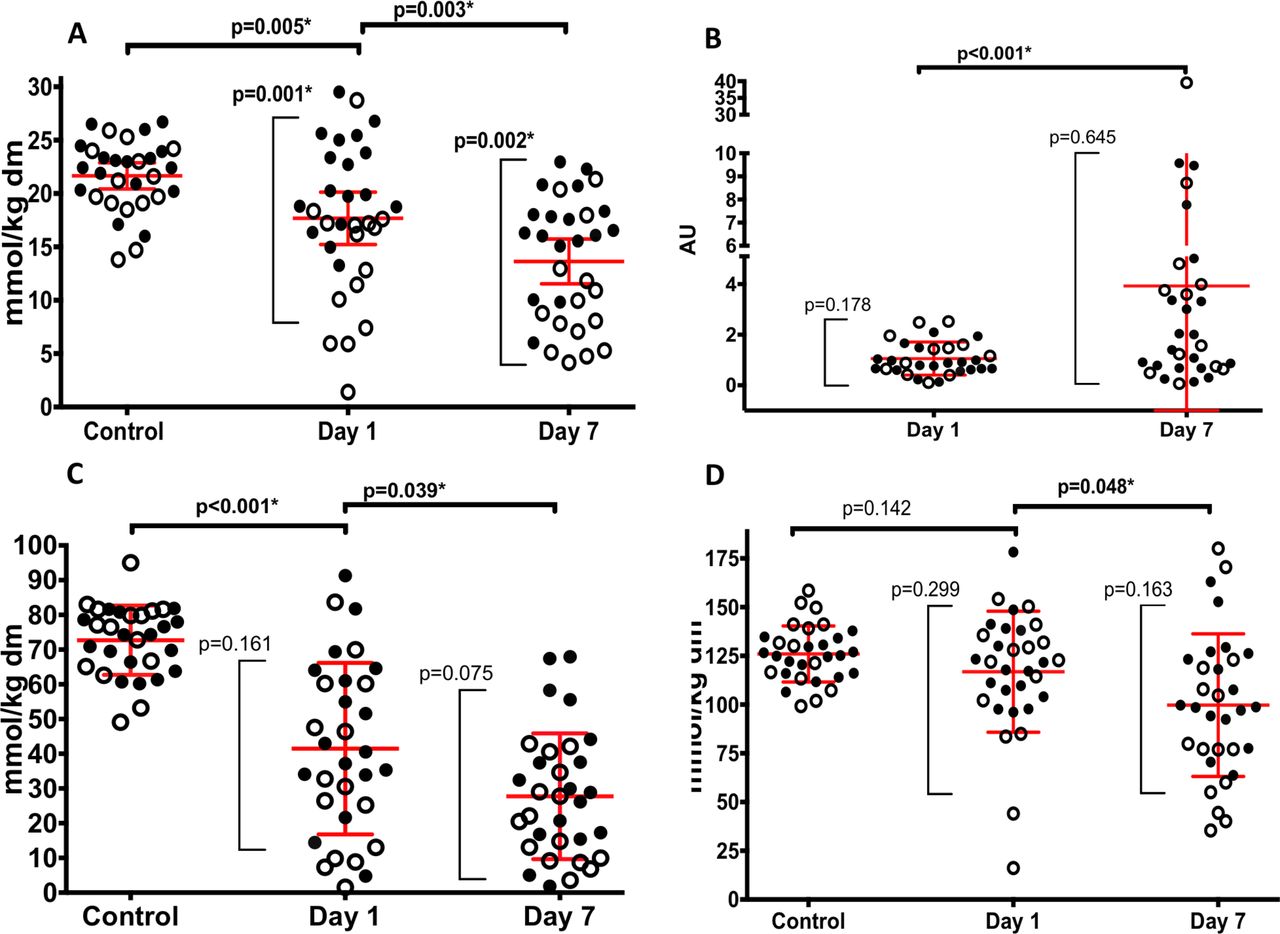
Intramuscular ATP content on day 1 in critically ill patients was lower than that of healthy subjects (17.7 mmol/kg dry weight (dw) (95% CI 15.3 to 20.0) vs 21.7 mmol/kg dw (95% CI 20.4 to 22.9); p=0.005) (figure 1A). Day 1 ATP content was lower in critically ill patients with chronic disease than in those without (13.61 mmol/kg dw (95% CI. 9.9 to 17.4) vs 21.26 mmol/kg dw (95%CI 19.0 to 23.6); p=0.001, figure 1A). Correspondingly, ATP content on day 1 was similar in healthy individuals and critically ill patients without chronic diseases (22.17 mmol/kg dw (95% CI 20.7 to 23.7) vs (21.26 mmol/kg dw (95% CI 18.9 to 23.6); p=0.383). However, critically ill patients with pre-existing chronic disease had lower ATP content on day 1 than ambulant COPD controls (13.6 mmol/kg dw (95% CI 9.9 to 17.4) vs 21.1 mmol/kg dw (95% CI 19.0 to 23.2); p<0.001).

Bioenergetic data. (A) Skeletal muscle ATP in control subjects and on day 1 and day 7 of critical illness. (B) Ratio of phosphorylated to total AMP-K on day 1 and day 7 of critical illness. (C) Phosphocreatine and (D) total creatine data in control subjects and on day 1 and day 7 of critical illness. Clear symbols represent patients with stable pre-existing chronic disease, while filled symbols represent patients without pre-existing chronic disease. Red lines represent mean and 95% CI. *P<0.05 for comparisons between time points (horizontal parentheses) and comparisons between those with and without pre-existing chronic diseases (vertical parentheses). dw, dry weight.
ATP content declined from day 1 to day 7 in the whole cohort (−4.8 mmol/kg dw (IQR −8.0–1.2); n=33; p=0.001). The difference between those with and without pre-existing chronic diseases persisted at day 7 (10.43 mmol/kg dw (95% CI 7.3 to 13.5) vs 16.47 mmol/kg dw (95% CI 14.2 to 18.8), respectively; p=0.002), although ATP content change over 7 days was no different between those with and without pre-existing chronic diseases (−3.18% (95%CI −8.1 to 1.7) vs −4.79% (95% CI −6.8 to −2.8); p=0.503). The ratio of phosphorylated to total AMP-K rose from day 1 to day 7 in the critically ill cohort (0.88 (IQR 0.62–2.52) vs 1.57 (IQR 0.68–3.99); n=31; p<0.001) (figure 1B; online supplementary table S7).
Phosphocreatine concentration was also lower in patients than in healthy subjects on day 1 (41.7 mmol/kg dw (95% CI 32.6 to 50.4) vs 72.7 mmol/kg dw (95% CI 69.0 to 76.4); p<0.001) and declined over the following 7 days (−14.7 mmol/kg dw (95% CI −23.3 to −6.1); n=33; p=0.039) (figure 1C). Total creatine content was similar to that found in healthy subjects at day 1 (116.9 mmol/kg dw (95% CI 105.7 to 128.0 vs 126.0 mmol/kg dw (95% CI 120.7 to 131.2); p=0.142 (figure 1D), but declined over 7 days (−25.39 mmol/kg dw (IQR −42.4–1.44); n=33; p<0.048). Phosphocreatine and total creatine content were independent of chronic disease status.
Metabotyping
A two-component cross-validated model had an R2Y of 0.72 and Q2 of 0.41 and area under the receiver operating characteristic of 0.95 for predicting day of muscle sampling. Following correction for multiple comparisons, a decrease in an intramuscular triglyceride(TG(12:0/13:0/22:0); −1366AU (95% CI −2605 to −127); n=15; p=0.048) and an increase in several intramuscular phosphocholine ((representative example PC (41:0)); 847.2AU (IQR 232.5–1672); n=15; p=0.022) over 7 days retained statistical significance (figure 2; online supplementary table S6).
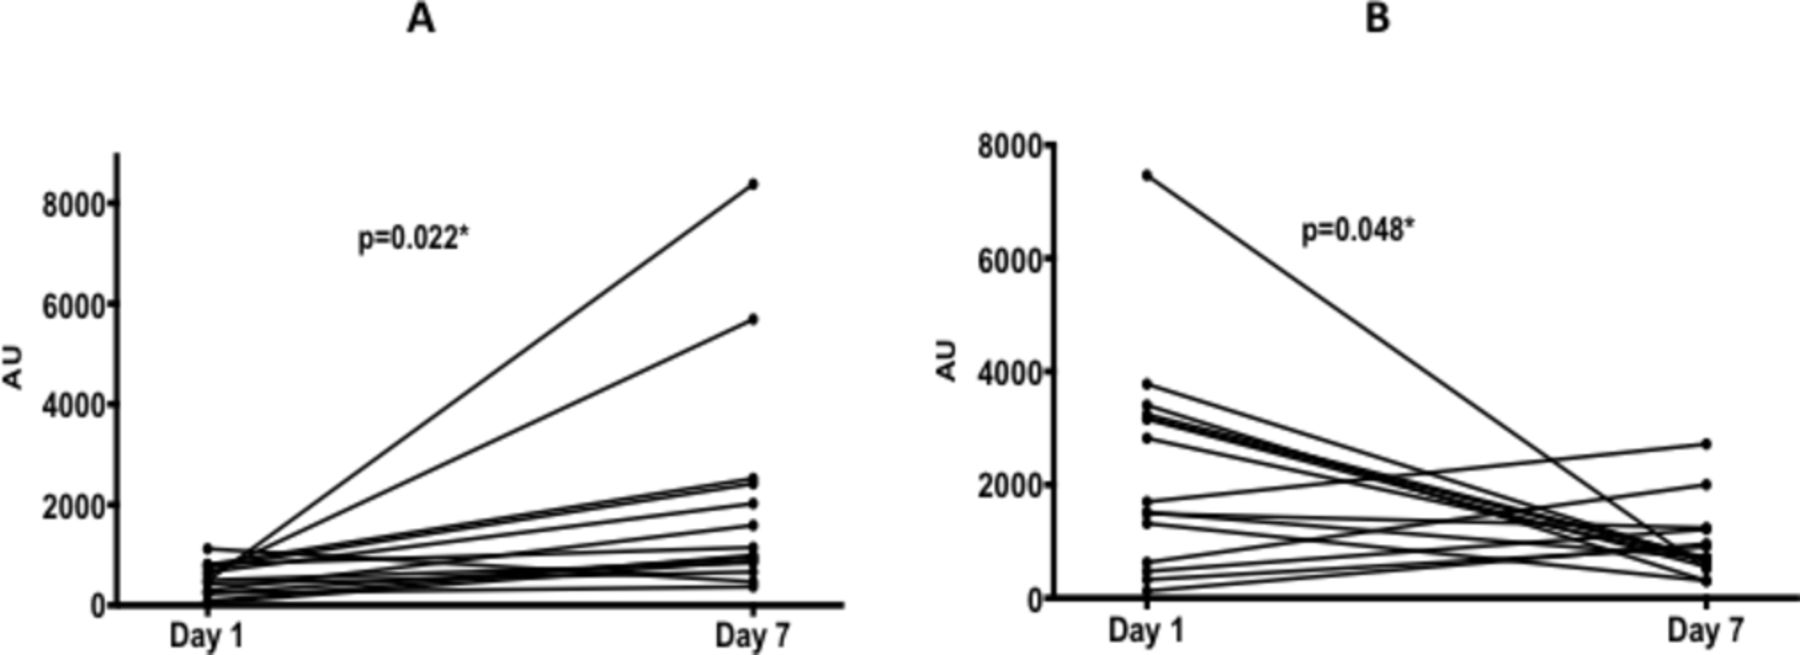
Ultra performance liquid chromatography mass spectrometry data for muscle samples on day 1 and day 7 of critical illness. (A) Phosphocholine and (B) triglyceride. *P<0.05.
Mitochondrial biogenesis
PGC1α mRNA expression decreased (−27.4CN (95% CI −123.9 to 14.3); n=23; p=0.025) between day 1 and day 7 as did that of the marker of mitochondrial fission DRP-1 (−42.7CN (95% CI −77.2 to 8.2); n=23; p=0.018, online supplementary figure S4, table S6). Mitochondrial DNA CN also decreased over the first 7 days (−1859CN (IQR −5557–1325); n=35; p=0.032). No change was observed in PGC1β or PPRC1 expression over 7 days (both p>0.05).
Adipokine and ghrelin response
Serum adiponectin concentration increased from day 1 to day 7 (10.3 μg (95% CI 6.8 to 13.7); n=59; p<0.001), as did those of ghrelin (16.0 ng/mL (IQR −7–100); n=59; p=0.028, online supplementary table S8). Both increases were sustained at day 10. Resistin concentration was unchanged (−0.75 µg (95% CI −1.6 to 0.1); n=59; p=0.918), as was leptin concentration (−0.01; n=59; p=0.113). In the obese subgroup (n=16, body mass index ≥30 kg/m2), leptin levels decreased over 10 days (26.6 ng/mL (95% CI 22.7 to 30.5) to 19.2 ng/mL (95% CI 13.6 to 24.8); n=16; p=0.048).
Hypoxic and inflammatory signalling
Intramuscular HIF-1α protein concentration increased from day 1 to day 7 (−12.0AU (IQR 2.3–47.8); n=33; p<0.001) (figure 3C). Change in HIF-1α was unrelated to changes in the PaO2 of oxygen in arterial blood, or to the saturation of arterial haemoglobin with oxygen (both r2<0.1, p>0.10; online supplementary table S9).

Change in intramuscular cytokine concentration between day 1 and day 7 of critical illness. (A) TNF-α, tumour necrosis factor alpha; TNFR1, tumour necrosis factor receptor 1; TNFR2, tumour necrosis factor receptor 2; (B) IL-4, interleukin-4, IL-10, interleukin-10; (C) HIF-1α, hypoxia-inducible factor 1 alpha; (D) IL-1α, interleukin-1 alpha; IL-1β, interleukin-1 beta; IL-6, interleukin-6; IFN-γ, interferon-gamma; EGF, epithelial growth factor. *P<0.05.
Intramuscular tumour necrosis factor receptor 1 concentration increased from day 1 to day 7 (0.66 μg (IQR −0.44–3.33); n=29; p=0.041 (figure 3A), as did intramuscular interleukin (IL)-10 concentration (13.6 ng (IQR 3.4–39.0); n=29; p=0.004 (figure 3B). Intramuscular concentrations of IL-1α, IL-1β, IL-2, IL-4, IL-6, IL-8, tumour necrosis factor-alpha, TNFR2, interferon-gamma, monocyte chemoattractant protein 1 and endothelial growth Factor did not change over 7 days (n=29; p>0.05; table 2, figure 3A,B,D).
Intramuscular cytokine concentrations on day 1 and day 7 of critical illness (n=29)
Integration of data: network analysis
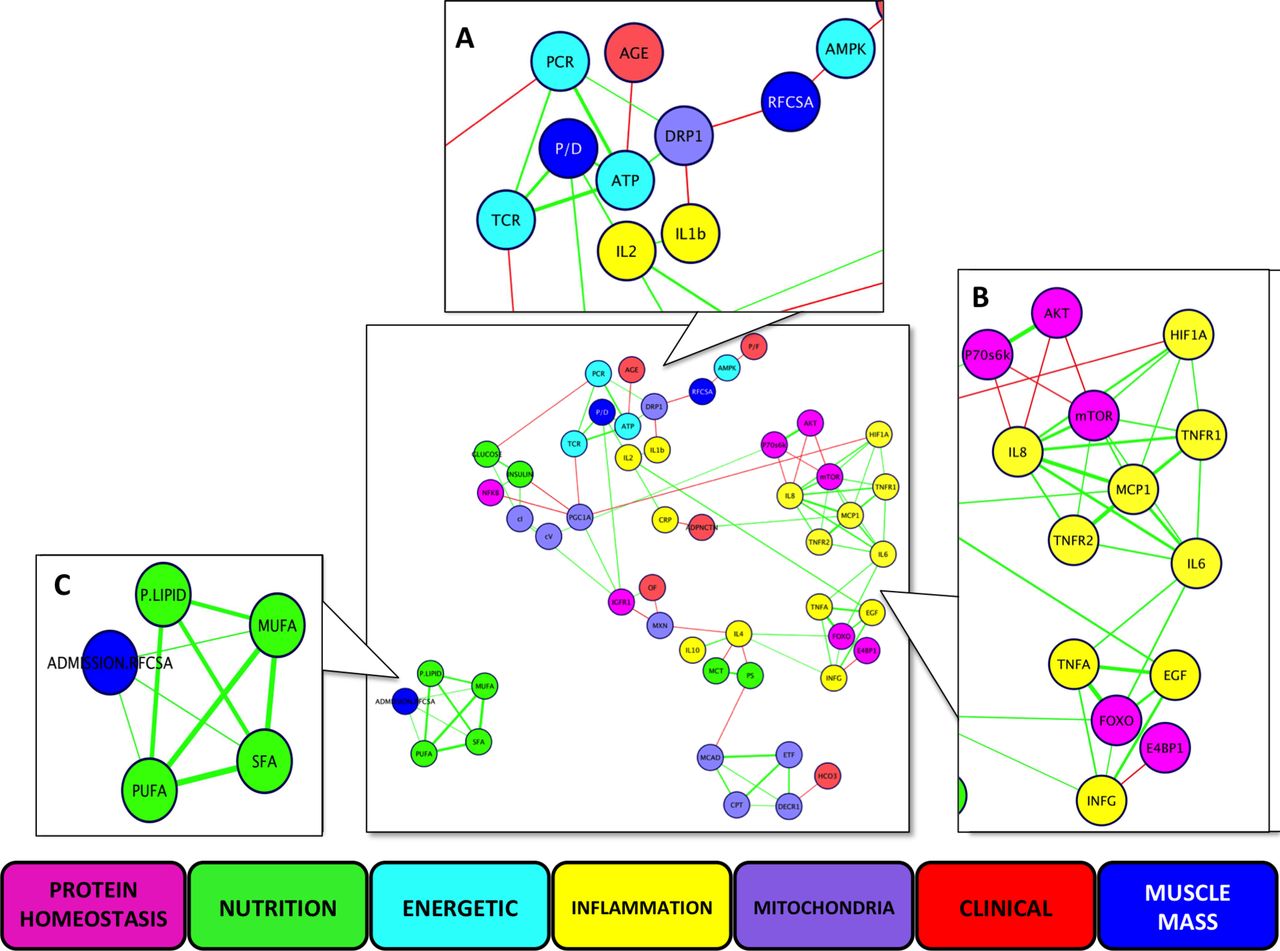
While simple linear regression analyses did not provide useful insight (online supplementary table S8, S12-14), nine data clusters were delineated, comprising 91 different interactions between longitudinal data from clinical, protein homeostatic, inflammatory, mitochondrial, bioenergetic and nutritional data (figure 4). Of these, 79 (87%) interactions have been observed previously in human tissue, and the remainder in animal tissue (online supplementary table S10-12), further validating our approach. The network revealed the close relationship between bioenergetic impairment and reductions in both rectus femoris cross-sectional area and protein/DNA ratio (figure 4A), and between intramuscular inflammation and impaired anabolic signalling (figure 4B). Bioenergetic impairment and fall in muscle mass appeared unrelated to the delivery of phospholipids, or of saturated, monounsaturated or polyunsaturated fatty acids, delivered (figure 4C).
Multidimensional network analysis of components of bioenergetics status, hypoxia and inflammatory signalling, protein homeostasis signalling molecules, measures of muscle mass, clinical physiology data and lipid and carbohydrate nutrition delivered. Data are change over 7 days except for nutritional data (total delivered over 7 days) and organ failure (cumulative). Lines represent r values, green being positive and red negative, with greater thickness representing higher values. Panels represent Markov clusters: (A) measures of muscle mass and energetic data; (B) protein homeostasis and inflammation; (C) nutritional lipid delivery. AKT, protein kinase B; CPT, carnitine palmitoyltransferase-1; CRP, Creactive protein; DECR1,2,4 dienoyl-CoA reductase 1; DRP-1, dynamin-related protein 1; E4 BP1, eukaryotic initiation factor 4E binding protein 1; EGF, epithelial growth factor; ETF, electron transferring flavoprotein; FOXO, forkhead box class O-1; HCO3-, serum bicarbonate; HIF-1 α, hypoxia-inducible factor 1 alpha; IGF-1R, insulin-like growth factor-1; IFN- γ, interferon-gamma; IL, interleukin; MCAD, medium chain acyl-CoA dehydrogenase; MCP-1, macrophage chemotactic protein-1; MCT, medium chain triglycerides; mTOR, mammalian target of rapamycin; MUFA, monounsaturated fatty acids; MXN, mitochondrial copy number; OF, organ failure; P. lipid, phospholipids; P70S6 K, 70 kDa S6 protein kinase; PCR, phosphocreatine; P/D, protein-to-DNA ratio; PS, polysaccharides; PUFA, polyunsaturated fatty acids; RFCSA, rectus femoris cross-sectional area; SFA, saturated fatty acids; TCR, total creatine; TNF-α, tumour necrosis factor alpha; TNFR1, tumour necrosis factor receptor 1; TNFR2, tumour necrosis factor receptor 2.
Further results are available in the online supplementary file.
Discussion
In this study of patients during early critical illness, we report novel data detailing the the relationships between skeletal muscle wasting and the inflammatory, hypoxic and protein homeostatic signalling together with the bioenergetic status of the muscle. A network analysis has been used to describe these relationships in the context of clinical physiological data. Three important novel findings were observed: i) decreased ATP, creatine and phosphocreatine availability are closely and directly related to acute skeletal muscle wasting (protein/DNA ratio and rectus femoris cross-sectional area); ii) activation of hypoxic and inflammatory signalling are closely and directly related to impairment of anabolic signalling pathways and iii) changes in intramuscular ATP content and skeletal muscle mass are unrelated to the quantity of lipids delivered.
Change in bioenergetic state during early critical illness
Decreases in PGC1α, markers of mitochondrial fission (DRP-1) and mitochondrial DNA CN reflect reduced mitochondrial biogenesis. Mitochondrial complex concentrations did not change over the first week of critical illness, although mitochondrial beta-oxidation enzyme concentrations fell. Although functional mitochondrial measurements could not be performed, decreases in beta-oxidation and oxidative phosphorylation explain the finding that myocellular ATP content was lower in patients than in healthy controls on day 1, and decreased further over the first week. The measured decrease in muscle ATP, along with phosphocreatine and creatine content was accompanied by an increase in AMP-K, implying a compromised bioenergetic state and potentially decreasing anabolism. Assimilating previously published data on muscle mass and protein homeostasis regulation,1 network analysis confirmed the relationship between impaired bioenergetic status, bioenergetic sensing signal and loss in muscle mass.
Neither muscle ATP content nor muscle mass was related to the quantity of fatty acids delivered as part of nutrition or sedative use. This was in keeping with both the measurements of lipid oxidation performed, and the increase in myocellular phosphocholine in a separate analysis. These data suggest that current critical care nutritional management is unable to prevent development of an impaired bioenergetics status, which may be causal in regard to acute muscle wasting.
Metabolo-inflammatory response during early critical illness
The complex relationship between inflammation, anabolism and metabolism was demonstrated in the network analysis and may impact on both skeletal muscle mass and quality. Intramuscular inflammatory mediators clustered with anabolic signalling proteins, suggesting a deleterious effect of inflammation. Previous work by Constantin et al 32 demonstrated anabolic signalling transcription upregulation with no corresponding increase in protein expression. Inflammatory signalling likely inhibits this translation of programmed anabolic restoration32 and therefore muscle mass maintenance and has been demonstrated in animal models.22 33
Myonecrosis with an associated macrophagic infiltrate has also been reported.34 Elevated intramuscular IL-10 as seen in these data may activate macrophages35 and induce phagocytosis of myofibre debris, and represent another potential mechanism of switching in macrophage phenotype.35 This may counteract the detrimental effects of the observed lipid accumulation, which may affect switching from the M1 (pro-inflammatory) to M2 (anti-inflammatory) macrophage phenotype,36 impeding autophagy37 and recovery from myonecrosis. In addition, IL-10 demonstrates a suppressive effect on the Th1 cytokine response in injured muscle, that is, decreasing the inflammatory effects of M1-associated effectors, such as IL-638 and TNF-α.39 The final macrophage phenotype remains unclear but is likely to be the result of a balance of these factors, which may be altered by interventions that either a) decrease inflammation or b) decrease lipid accumulation.
The rise in HIF-1α was unrelated to the presence of systemic hypoxia, although the presence of cellular dysoxia cannot be excluded. Measuring the totality of the balance between tissue oxygen supply and demand in muscle beds is not technically possible in the clinical context. Nor is it easy to separate the extent to which metabolic change is dependent or consequent to altered oxygen or substrate delivery. However, HIF activity can be stimulated via pro-inflammatory cytokines,40 circulating lactate41 or insulin resistance.42 Thus, the HIF-1α signalling in muscle during critical illness appears to mirror the complex relationship between hypoxic signalling and inflammation seen in solid tumours.23 Regardless, this increase in HIF-1α concentration may reflect alterations in glucose metabolism such as the Pasteur effect,43 metabolic reprogramming to allow Glucose Transporter type-4 membrane translocation42 or attempts to stimulate glycolysis.43 Additional examination of the complexity of glucose metabolism was beyond the scope of this manuscript.
The rise in adiponectin could represent a homeostatic response to lipid accumulation and/or insulin resistance,44 and increasing ghrelin concentrations may reflect the compromised bioenergetics state in skeletal muscle. However, adiponectin and ghrelin also play a role in the regulation of inflammation,45 46 and cluster analysis suggests a close relationship with the inflammatory response.
These data suggest that intramuscular inflammation is likely to prevent anabolic restoration, impeding the effects of exercise or amino acid supplementation on muscle protein synthesis. HIF-1α upregulation is associated with this inflammation and may modulate the metabolic response.
Clinical relevance
These data are the first to suggest that the lipid component of enteral and parenteral nutrition may be, in part, bioenergetically inert in the context of critical illness. This may be of substantial clinical importance, given that lipids contribute 29%–43%47 48 of the energy content in enteral, and 50% of parenteral, formulae.49 These findings thus offer a plausible explanation for the apparent conflict between data from observational studies demonstrating a clinical benefit from increased nutrition over the entire ICU stay50 and the lack of benefit observed with early targeted nutrition.5–7 In early critical illness, ATP turnover may not respond to higher calorific feed content and therefore differ little between intervention and usual care groups in clinical trials, particularly when parenteral nutrition is used.5 6 17
Likewise, a failure of ATP turnover may account for a limited response to (and thus the observed limited benefit from) exercise interventions9 10 12 with concomitant hypoxic21 and/or inflammatory stimuli additionally impairing muscle protein synthesis resulting in an attenuated response to intervention. However, as these adverse stimuli decrease with treatment and time, nutrition delivered may augment recovery.
Altering the composition of feed delivered in critical illness to exclude the lipid component may, in part, address the observed bioenergetic impairment and is an area for further research.
Future work
We consider that future clinical studies should be directed towards addressing these three core important novel findings. However, targeting a single molecule or other aspect of altered biology is unlikely to be successful. Interventions will likely need to target the whole, or multiple parts of the network (ie, the molecular signature), in the same fashion perhaps as asthma51 or breast cancer.52
From these data, we propose potential research to be targeted at: i) skeletal muscle wasting as a consequence of a reduction in ATP, creatine and phosphocreatine availability, for example, non-invasive diagnostic techniques to measure mitochondrial function; development of treatments to ameliorate mitochondrial dysfunction and/or skeletal muscle energy content including the use of supplemental creatine; ii) skeletal muscle anabolism, which is negatively affected by hypoxia and inflammation, for example, targeted anti-inflammatory treatments, which may be pharmacological, nutritional and exercise prescriptions; confirmation of timing for nutritional and exercise delivery to aid anabolic restoration; iii) lipid delivery, which has limited impact of skeletal muscle energy status, for example, the use of alternative non-fat fuel sources and removal of fatty acid supplementation.53
In addition, the low bioenergetic baseline of patients with pre-existing chronic diseases highlights the need for tailored interventions, including nutrition,50 and stratification in trials.54
Limitations
We did not directly measure mitochondrial function in snap-frozen samples, due to limitations in the validity of this approach.55 56 However, our focus was on the downstream effects of previously described alterations in mitochondrial function15 16 24 and both the fall in ATP and increases in phospholipids are in keeping with the static measurements performed. Tissue was rapidly acquired (under 10 s) and snap-frozen allowing further confidence in these data.57 Limited tissue availability precluded more granular metabophenotyping, although sufficient to test the hypothesis. The consistent and marked declines in muscle ATP and the muscle creatine pool may be contributed to by muscle tissue necrosis that has been previously observed.1 Total ghrelin was measured rather than active components such as acyl-ghrelin58 and may not reflect true activity. The network analysis allowed revelation of patterns of activity that would otherwise have been hidden by traditional analysis31 of a relatively small (although deeply phenotyped) cohort, which nevertheless represents the largest longitudinal serial muscle biopsy cohort in acute critical illness. Ideally, these findings would be replicated in a second independent sample. Given the difficulties in performing serial muscle biopsies in the critically ill, this was considered beyond the scope of the study. Our data may not be generalisable to all critically ill patients, as this cohort consisted of patients of high acuity (Acute Physiology and Chronic Health Evaluation II score of 23.5 (95% CI 21.9 to 25.2), who spent a minimum of 7 days in critical care. A validation cohort of lesser acuity may offer differing results. The patient cohort is heterogeneous in many regards, as is typical of the critically ill. However we, and others, have demonstrated that similar of patterns exist in critically ill patients with respect to acute muscle wasting in terms of muscle mass1 59 and function,54 59 60 molecular biology1 and in this current application, metabolism, despite heterogeneity in presenting disease. Moreover, the statistical approach used would reveal such heterogeneity if it existed. These data strongly support the presence of metabolic homogeneity. Of clinical importance, the mechanisms identified were present across a mixed ICU population. It is, of course, possible that the balance of such elements may vary among individual patients (eg, with differing levels of inflammation, hypoxaemia, corticosteroid and vasopressor agent exposure).
Only 5.3% of data entered into the network analysis was missing, which is within acceptable missing data threshold.61 The convergence of data from separate laboratories and techniques also increases confidence in our conclusions. The first day of ICU admission does not necessarily reflect the first day of critical illness. While unable to quantify physiological derangement prior to admission, the median time from hospital to ICU admission was only 24 hours. In addition 16/34 patients suffered major trauma or an intracranial bleed and were not exposed to antecedent decline. Due to the observational nature of our study, causal links in terms of mechanism cannot be made. While longitudinal studies remain the focus of this work, we acknowledge the need for future work accounting for alterations in inflammation and hypoxia signalling relative to healthy controls.
All control muscle ATP, phosphocreatine and free creatine concentrations represent unpublished, archived, historical data that were generated prior to the analysis performed on muscle from critically ill patients. However, all measurements were standardised as they were performed in the same laboratory, using the same techniques by the same research group. Further control muscle ATP, creatine and phospocreatine contents are noted to be within normal range.25
Conclusions
These data have shown that there is a relationship between an impaired bioenergetic status and acute muscle wasting during early critical illness. This indeed may explain the reduced clinical effectiveness of the currently employed nutritional supplementation and exercise therapy interventions used in the ICU. Dysregulated lipid oxidation and decreased mitochondrial biogenesis contribute to this compromised skeletal muscle bioenergetic status. In addition, intramuscular inflammation was associated with impaired anabolic recovery with lipid delivery during early critical illness observed as bioenergetically inert. Future clinical work will need to focus on these key areas to develop strategies to ameliorate acute acute skeletal muscle wasting during early critical illness.
References
Footnotes
SDH, NH and HEM are joint senior authors.
Contributors Concept and design: ZAP, RA, MMM, CV, PJA, KS, LME, SDH, NH, HEM. Data collection: ZAP, MMM, SS, YP, CV, SM, LC, MS, RLB, MS. Analysis: ZAP, RA, MMM,SS, YP, DB, DC, CV, SM, LC, MS, RLB, MG-R, EH, MS, PG, LME, SDH, NH, HEM. Manuscript preparation: ZAP, RA, MMM, SS, YP, DB, DC, CV, SM, LC, MS, RLB, MG-R, EH, MS, PJA, KS, PG, LME, SDH, NH, HEM.
Funding ZAP was funded by the National Institute of Health Research (UK). Additional funding has been received from the European Society of Intensive Care Medicine, Guy’s & St Thomas' and King’s College London NIHR Comprehensive Biomedical Research Centre (BRC) and the Whittington Hospital NHS Trust. SDH received support from the Research Councils UK. NH received funding from the NIHR Clinical Research Facility and BRC at Guy’s and St Thomas’ NHS Foundation Trust (GSTT) and King’s College London. HEM was funded by University College London and UCLH BRC. The Clinical Phenotyping Centre is supported by the National Institute for Health Research (NIHR) Biomedical Research Centre based at Imperial College Healthcare NHS Trust and Imperial College London. MJWM is grateful to the Wellcome Trust for support in the form of a Postdoctoral Training Fellowship for part of this work. YP is grateful to Merz Pharmaceuticals for support in the form of a training fellowship award.
Competing interests ZAP has received consultancy fees from Lyric Pharmaceuticals, and attended Specialist Advisory Boards for GlaxoSmithKline and Fresenius Kabi. Other authors have no competing interest to declare.
Ethics approval Ethical approval was obtained from University College London Ethics Committee A.
Provenance and peer review Not commissioned; externally peer reviewed.
Correction notice This article has been corrected since it was published. The footnote indicating joint senior authorship for SDH, NH and HEM was omitted.
Linked Articles
- Airwaves