Article Text

Abstract
Rationale We hypothesised that patients with acute respiratory distress syndrome (ARDS) can be clustered based on concentrations of plasma biomarkers and that the thereby identified biological phenotypes are associated with mortality.
Methods Consecutive patients with ARDS were included in this prospective observational cohort study. Cluster analysis of 20 biomarkers of inflammation, coagulation and endothelial activation provided the phenotypes in a training cohort, not taking any outcome data into account. Logistic regression with backward selection was used to select the most predictive biomarkers, and these predicted phenotypes were validated in a separate cohort. Multivariable logistic regression was used to quantify the independent association with mortality.
Results Two phenotypes were identified in 454 patients, which we named ‘uninflamed’ (N=218) and ‘reactive’ (N=236). A selection of four biomarkers (interleukin-6, interferon gamma, angiopoietin 1/2 and plasminogen activator inhibitor-1) could be used to accurately predict the phenotype in the training cohort (area under the receiver operating characteristics curve: 0.98, 95% CI 0.97 to 0.99). Mortality rates were 15.6% and 36.4% (p<0.001) in the training cohort and 13.6% and 37.5% (p<0.001) in the validation cohort (N=207). The ‘reactive phenotype’ was independent from confounders associated with intensive care unit mortality (training cohort: OR 1.13, 95% CI 1.04 to 1.23; validation cohort: OR 1.18, 95% CI 1.06 to 1.31).
Conclusions Patients with ARDS can be clustered into two biological phenotypes, with different mortality rates. Four biomarkers can be used to predict the phenotype with high accuracy. The phenotypes were very similar to those found in cohorts derived from randomised controlled trials, and these results may improve patient selection for future clinical trials targeting host response in patients with ARDS.
- ARDS
- Cytokine Biology
Statistics from Altmetric.com
Key messages
What is the key question?
Can cluster analysis of biological markers in plasma of patients with acute respiratory distress syndrome (ARDS) be used to identify phenotypes with different mortality rates?
What is the bottom line?
There are at least two phenotypes of ARDS and the ‘reactive’ phenotype is associated with mortality independent of severity of illness.
Why read on?
Pharmacological interventions in patients with ARDS have all failed so far; this study sheds light on two phenotypes of ARDS that may be targeted differently in future randomised controlled trials.
Introduction
The acute respiratory distress syndrome (ARDS) is a major complication in critically ill patients, with high morbidity and mortality.1–4 Despite promising results in preclinical experiments testing immunomodulatory interventions in animals with lung injury,5 ,6 results from clinical trials in patients with ARDS have been disappointing so far.7–9 Differences between pathological manifestations of lung injury in animals and ARDS in patients can only partly explain the discrepancies between animal studies and clinical trials.10 Furthermore, preclinical experiments have always used inbred animals in an effort to limit heterogeneity. Clinical trials, however, had to rely on clinical, radiological and physiological parameters to diagnose and stratify ARDS.11 Thus, patients with ARDS included in clinical trials are by definition more heterogeneous.12
Biological subtyping of patients could improve patient selection for clinical trials with targeted therapies, including immunomodulatory interventions, as has been shown in other pulmonary and non-pulmonary diseases.13 ,14 Phenotyping of patients with ARDS can be done using clinical characteristics, causes of lung injury,15 individual or sets of biomarkers,16 or a combination of clinical and biological variables.17 Stratification on biological responses (ie, the biological phenotype) may allow for a better selection of patients, for example, with regard to potential benefit from a certain intervention (predictive enrichment), allowing exclusion of patients that have a low chance of benefit who may even may be harmed.18–20 Indeed, post hoc analyses of randomised controlled trials (RCTs) showed that a phenotype with increased inflammatory markers and decreased plasma bicarbonate levels is associated with the response to high positive end-expiratory pressure and restrictive fluid management.17 ,21
We hypothesised that patients with ARDS can be clustered based on plasma concentration of biomarkers of inflammation, coagulation and endothelial activation, and that these clusters would be associated with clinical outcomes. Importantly, the phenotypes are identified without taking any clinical data or outcomes into account. Additionally, we hypothesised that clusters could be discriminated based on a restricted number of plasma biomarkers, which would facilitate adoption of such phenotypes in future trials with the appropriate pharmacotherapy in patients with ARDS.
Methods
Study design
This study was part of a biobank initiative called the ‘Molecular Diagnosis and Risk Stratification for Sepsis’ (MARS), a prospective cohort study performed in the intensive care units (ICUs) of two university-based tertiary care hospitals (the Academic Medical Center in Amsterdam and the University Medical Center Utrecht in Utrecht, both in the Netherlands) from 2011 to 20138 (ClinicalTrials.gov identifier NCT01905033). The Institutional Review Boards of both hospitals approved the study protocol and opt-out consent method used for this study (IRB: 10-056C). The patients or their legal representatives were presented with a brochure and opt-out form, to be completed in case of unwillingness to participate.
Setting
Both ICUs are closed-format units, in which a team of board-certified critical care physicians, fellows in critical care medicine and board-certified ICU nurses care for a mixed medical-surgical population of patients. The nurse to patient ratio was 1:1 to 1:2, depending on disease severity. Protocols that showed improved outcome of patients with ARDS were in place in both ICUs. This included lung-protective mechanical ventilation with low tidal volumes,22 ,23 higher positive end-expiratory pressure levels24 in patients with more severe forms of ARDS and prone positioning.25 Furthermore, a restrictive fluid protocol was used,26 and analgo-sedation was performed using validated sedation scales preferring bolus versus continuous sedation.27
Inclusion and exclusion criteria
Consecutive adult patients admitted to the ICU with an expected length of stay of >24 hours from January 2011 to June 2013 were eligible for participation in the MARS study. All patients with ARDS from whom plasma that was obtained on the day of diagnosis of ARDS was available in the biobank were eligible for the present study. Part of this cohort was described earlier, albeit with a different scientific question, and the definitions are equal to those used in that study.28 ARDS was defined according to the criteria stated by the American-European Consensus Conference on ARDS:29 that is, the diagnosis required an acute onset of symptoms, the presence of bilateral infiltrates on chest radiography, a pulmonary artery wedge pressure <18 mm Hg and/or the absence of signs of left ventricular dysfunction, and a pO2 in arterial blood to fraction of inspired oxygen ratio (PaO2/FiO2) ≤ 200. Patients that met the above criteria but with a PaO2/FiO2 ≤ 300, classified as acute lung injury (ALI) according to the American-European consensus conference (AECC) criteria, were also included in the analysis since the updated definition of ARDS according to the ‘Berlin’ definition11 classifies this category as mild ARDS. Henceforth in this article patients with ALI according to AECC criteria are categorised as mild ARDS. Although our study started in 2011, before the recent ‘Berlin’ update of the ARDS definition was published,11 we found that no patients would have been excluded in case we had used the latest definition for ARDS. There were no additional inclusion or exclusion criteria.
Diagnosis of ARDS
A dedicated team of researchers who were regularly trained by studying case vignettes screened for the presence of ARDS on a daily basis while patients remained in the ICU. Patients were classified as having mild, moderate or severe ARDS according to the PaO2/FiO2 at the moment of diagnosis. Patients with ARDS were separated on the basis of having indirect (ie, systemic inflammatory response syndrome-associated or sepsis-associated ARDS) or direct ARDS (ie, pneumonia-associated, aspiration-associated or in association with another pulmonary cause).
Training and validation cohort
Patients that were included in the first 18 months of the study were included in the training cohort. The patients that were included in the subsequent year were used as a validation cohort.
Blood sampling and biomarker assay
Around day of ARDS diagnosis, blood was collected from all patients in a plastic vacuum container filled with EDTA. After centrifugation (1500G for 15 min) plasma was frozen at −80°C for batch-wise analysis. Interleukin (IL)-1β, IL-6, IL-8, tumour necrosis factor α, IL-10, IL-13, interferon gamma (IFN-γ), granulocyte macrophage-colony stimulating factor, soluble E-selectin, soluble p-selectin and fractalkine were measured in all samples with a cytometric bead array (CBA) Flex Set multiplex assay according to the instructions from the manufacturer (BD Biosciences, San Jose, California, USA). Plasminogen activator inhibitor (PAI)-1, D-dimer, tissue plasminogen activator, antithrombin, soluble intercellular adhesion molecule-1, matrix metalloproteinase-8, tissue inhibitor of metalloprotease 1, angiopoietin (ANG)1 and ANG2 were measured in all samples with Luminex according to the manufacturer instructions (BioRad, Hercules, California, USA). The values that were below the lower limit of quantification were set to the lowest value that we could accurately quantify. The upper limit of detection was not reached, with the exception of two markers (IFN-γ and IL-10) in one sample; these values were set to the upper limit of quantification. These markers were selected to represent some of the major pathways that are associated with critical illness (see online supplementary table S1).
supplementary data
Statistical analyses
The analytical pipeline for analysis of biological clusters had six steps. First, biomarker data were log10 transformed to obtain normally distributed variables, which was checked by Q–Q plots. Second, Ward clustering was performed with data from the patients in the training cohort only. Ward's method minimised the variance within a cluster and thereby selects patients with homogenous characteristics, in this case biomarker concentrations. Importantly, it does not take the clinical outcome of a patient into account. The optimal number of clusters was determined using the ‘NbClust’ package in R-statistics with the default settings.30 This algorithm combines 30 indices to deduce the optimal number of clusters in a given data set (see online supplement for more details). Third, the clusters were visualised using a heatmap and dendrogram with the ‘gplots’ package. Fourth, the clinical features of the clusters were compared and the independent association (corrected for Acute Physiology and Chronic Health Evaluation (APACHE IV) score,31 Age, PaO2/FiO2 and Plateau pressure Score (APPS)32 and gender) of the biological cluster with mortality was studied by logistic regression. PaO2/FiO2 ratio and a direct cause for ARDS were studied as potential additional confounders. Missing clinical data were replaced using multiple imputation chained equations33 with the standard settings (five imputations; five iterations; see online supplementary table S2). Also, the orthogonality, or independent relation, of the biological clusters and the Berlin classification with regard to ICU mortality investigated by logistic regression were visualised with bar plots. Fifth, prediction of cluster membership was performed by multivariable logistic regression, with the 20 biomarkers as independent variables. Automated backward selection was used to identify the optimal set of predictors. This model was used to predict the phenotypes in the validation cohort. Routinely available clinical and biochemical variables were tested in the same way. Finally, step number six was a repetition of the methods described in step number four (eg, the independent association with ICU mortality) for patients that were included in the validation cohort. Importantly, the analyses in the validation cohort were completely independent from the training cohort.
A sensitivity analysis was performed in patients with a direct cause for ARDS and for patients without chronic respiratory failure and for hospital mortality instead of ICU mortality as the outcome of interest. The absolute change in the OR was evaluated to quantify sensitivity. Furthermore, the association between phenotype and steroid exposure in the ICU and timing of sample collection (day of diagnosis, day before or morning after) was evaluated with logistic regression.
Data were presented as median with IQR, mean with SD or absolute occurrence and percentage. Differences between groups were analysed by Mann-Whitney U, Kruskal-Wallis analysis of variance or χ2 test based on variable distribution and the number of groups. Receiver operating characteristics curve analysis was used to quantify the strength of discrimination. A p value < 0.05 was used to determine statistical significance for all tests and 95% CIs were given. All analyses were performed in R (V.3.2.2) using R-studio interface (R Core Team. R: A Language and Environment for Statistical Computing. 2013. http://www.r-project.org/).
Results
Included patients
Of 6994 consecutive admissions to the ICU, 873 patients met the criteria for ARDS during two and a half years in the two participating hospitals, of whom 700 (80%) had complete biomarker data and were included in the present analysis. In total, 454 patients were included in the training cohort and 246 in the validation cohort. Seventy-three per cent of patients in the training cohort and 64% of the patients in the validation cohort came from hospital 1. Patient characteristics can be found in table 1. In total, 262 (37%) patients had mild, 331 (47%) had moderate and 107 (15%) had severe ARDS. Also, 429 (61%) patients had a pulmonary cause for ARDS. ICU mortality was 26%.
Patient characteristics, stratified for the training and validation cohort
Identification of biological phenotypes
Two clusters were separated based on plasma biomarkers of inflammation, coagulation and endothelial activation without taking the clinical outcome into account (figure 1). Patients in cluster 1 were called to be from the ‘uninflamed’ phenotype. Patients in cluster 2 were called to be from the ‘reactive’ phenotype, with high plasma levels of markers of inflammation, coagulation and endothelial activation (see online supplementary figure S1).

Heatmap of phenotypes. Columns: biomarkers. Rows: patients. First column: green blocks: ‘uninflamed phenotype’; red: ‘reactive phenotype’. Second column: patients that died are indicated with black, surviving patients with grey. Heat map: a higher concentration, in comparison to the other included patients is indicated with red, while a lower concentration is indicated by blue. ANG-1, angiopoietin-1; ICAM-1, intercellular adhesion molecule-1; ICU, intensive care unit; IFN, interferon; IL, interleukin; MMP8, matrix metalloproteinase-8; PAI-1, plasminogen activator inhibitor 1; TIMP1, tissue inhibitor of metalloprotease 1; TNF, tumour necrosis factor; tPA, tissue plasminogen activator.
Association of phenotypes with clinical outcome in the training cohort
Patients with a ‘reactive’ phenotype had a higher ICU mortality (36.4%) compared with patients with an ‘uninflamed’ phenotype (15.6%, p<0.001). They also had higher APACHE IV scores, more organ failure and more frequently had an indirect cause for ARDS (table 2). A ‘reactive’ phenotype remained independently associated with ICU mortality after correction for APACHE IV (OR 1.13, 95% CI 1.04 to 1.23). The addition of other potential confounders (APPS, PaO2/FiO2 ratio, pulmonary cause for ARDS) did not change this association (OR remained 1.11). The difference in mortality between the biological phenotypes was also independent of the Berlin classification of ARDS (figure 2, OR 3.1, 95% CI 2.0 to 4.8).
Phenotypes versus clinical characteristics in training cohort
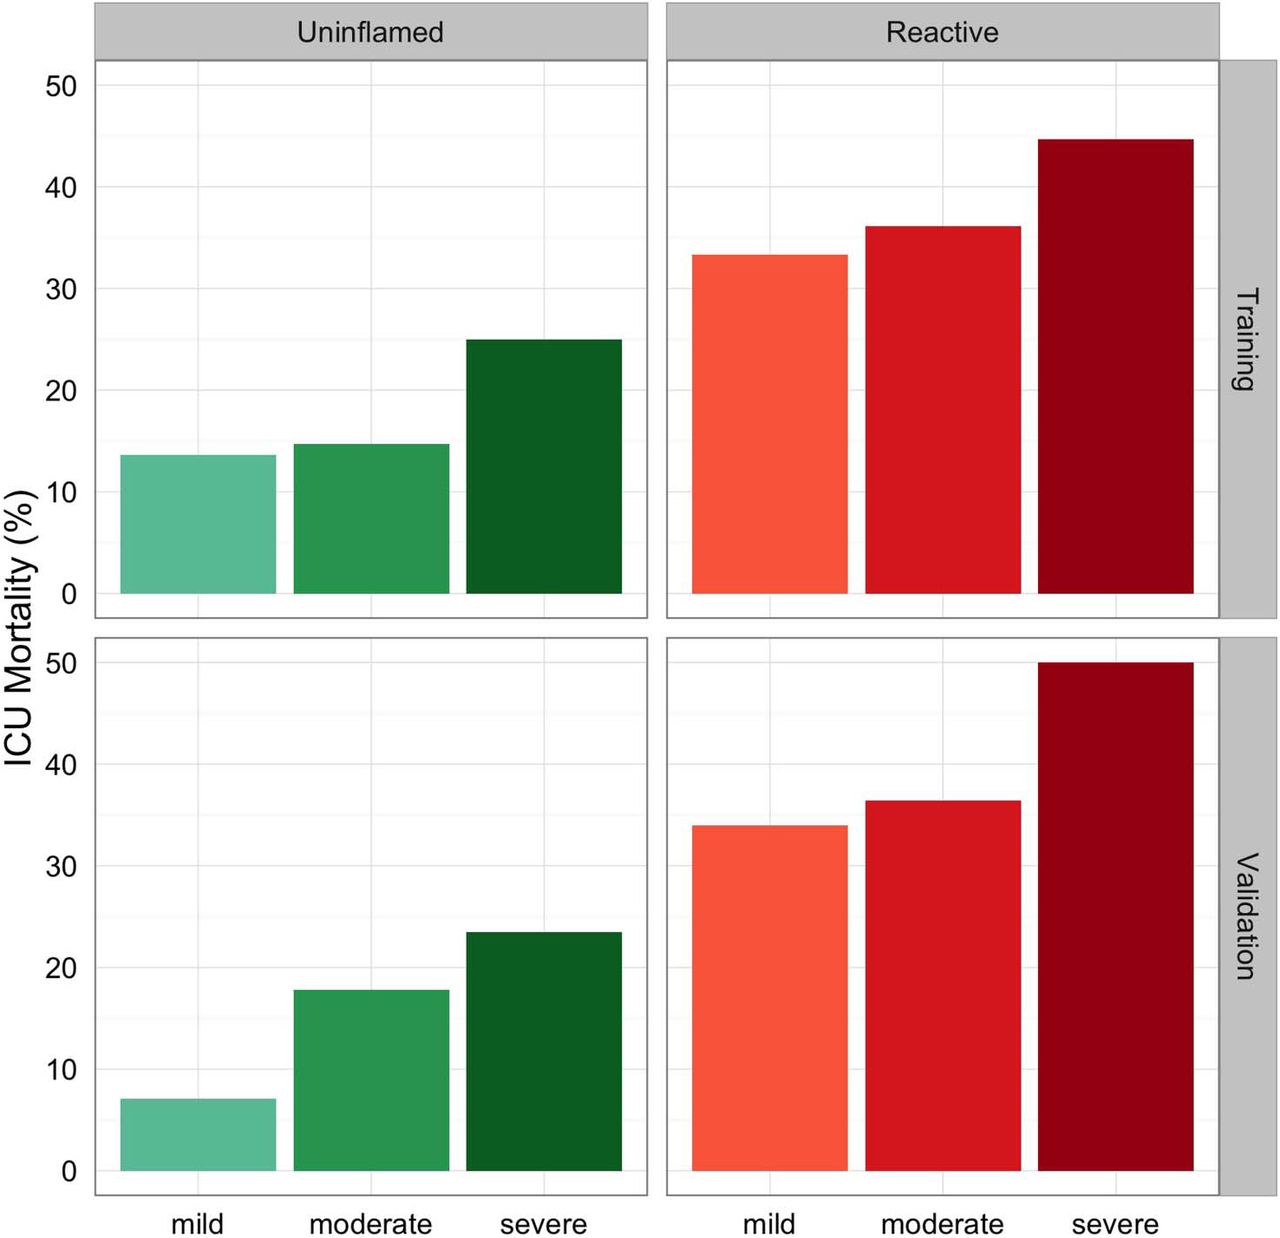
Orthogonality of phenotypes and Berlin classification. Intensive care unit (ICU) mortality per phenotype and Berlin classification. Boxes indicate phenotypes and the training or validation cohort, separate bars Berlin categories. Differences in mortality between the ‘reactive’ phenotype and ‘uninflamed’ phenotype were independent of the Berlin classification of acute respiratory distress syndrome (OR 3.1, 95% CI 2.0 to 4.8) in the training cohort and in the validation cohort (OR 3.8, 95% CI 2.0 to 7.2).
Prediction of phenotypes based on a limited set of biomarkers
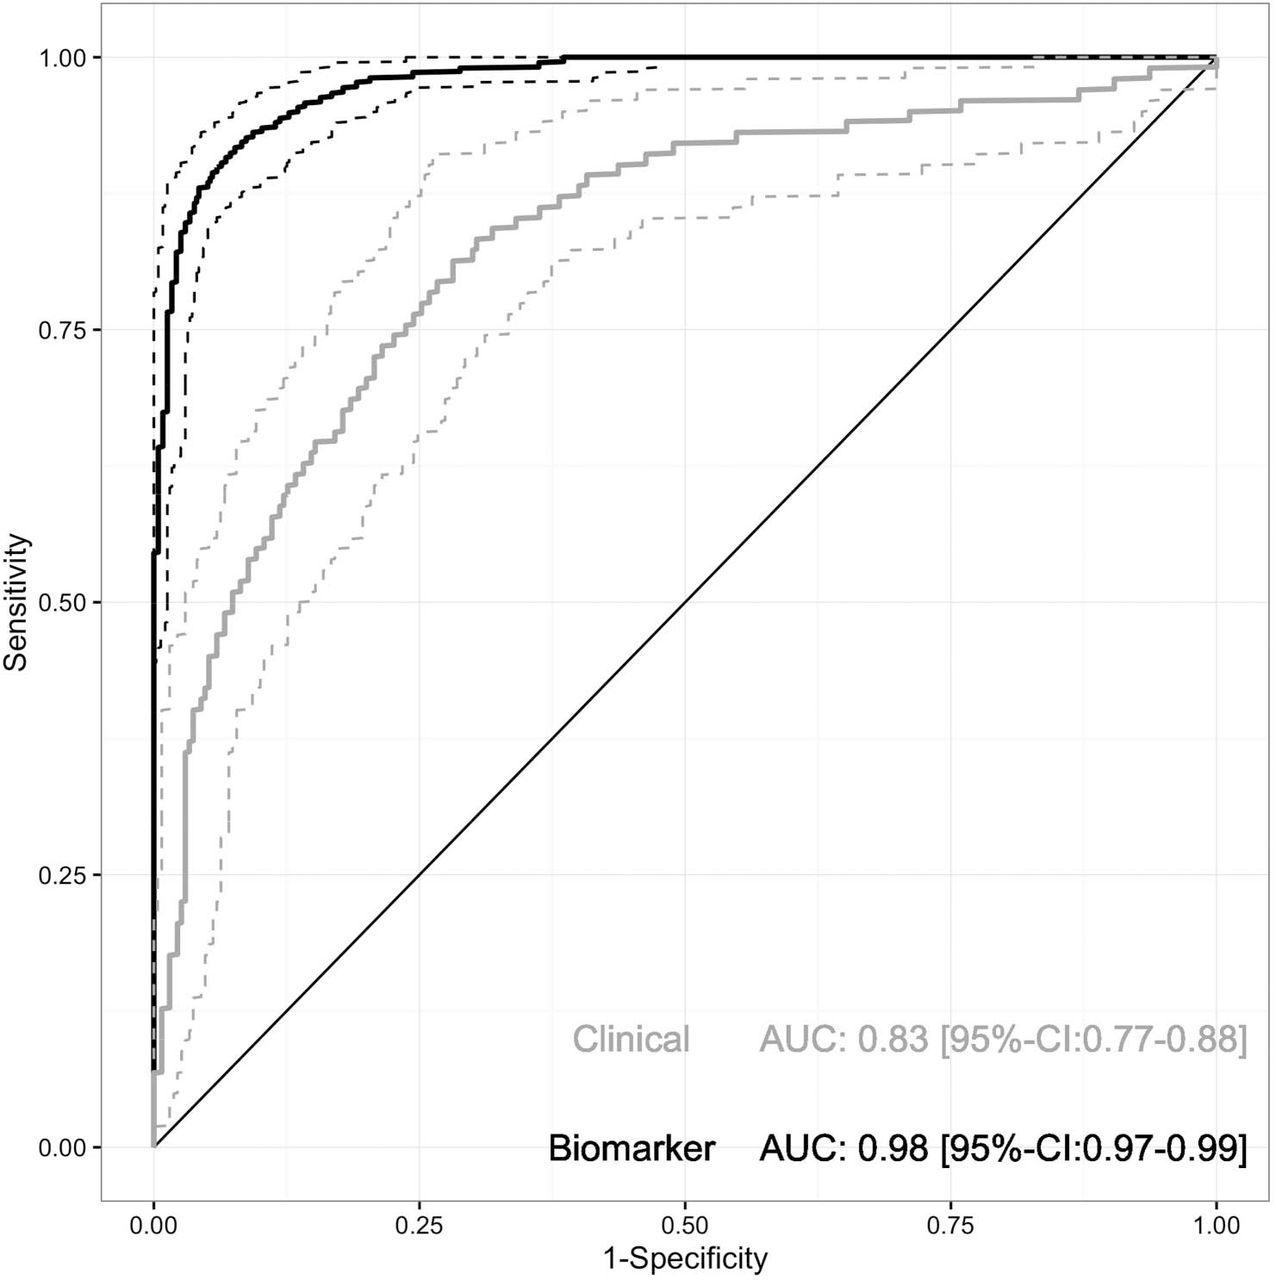
The plasma concentration of IL-6, IFN-γ, ANG1/2 and PAI-1 could be used to accurately discriminate between the two biological phenotypes in the training cohort (figure 3; area under the receiver operating characteristics curve: 0.98, 95% CI 0.97 to 0.99). The regression coefficients can be found in the online supplementary table S3. Prediction of the phenotype by routinely available variables that were significantly different between the phenotypes (APACHE IV, age, lactate, albumin, bicarbonate, mean arterial pressure, bicarbonate, platelets, C reactive protein, maximum inspiratory pressure, positive end expiratory pressure (PEEP) and PaO2/FiO2) had a significantly lower accuracy than that of the biomarkers (figure 3; p<0.001). The same discrimination could also be obtained by only using plasma albumin and bicarbonate concentration.

Discrimination of biological phenotype based on a limited set of biomarkers in the training cohort. Receiver operating characteristics curve for the biological phenotype based on (1) biomarkers depicted in black: plasma concentrations of interleukin-6, interferon-γ, angiopoietin-1/2 and plasminogen activator inhibitor-1 (see online supplementary table S3) and (2) routinely available clinical variables depicted in grey; the same accuracy could be obtained with albumin and bicarbonate only. AUC, area under the curve.
Association of phenotypes with clinical outcome in the validation cohort
In the validation cohort, the predicted ‘uninflamed’ and ‘reactive’ phenotype had a mortality rate of 13.6% and 37.5% (p<0.001), respectively. The differences in clinical characteristics were comparable to those found in the training cohort (online supplementary table S4, figures S3 and S4). A ‘reactive’ phenotype was independently associated with ICU mortality after correction for APACHE IV (OR 1.18, 95% CI 1.06 to 1.31) and for the Berlin classification for severity of ARDS (OR 3.8, 95% CI 2.0 to 7.2).
Confounding factors and association of phenotype with hospital mortality
Patients in whom the sample was taken the day before or after the diagnosis of ARDS were not more or less likely to be classified as having an ‘uninflamed’ or ‘reactive’ phenotype (p=0.34 for sample taken before and p=0.13 for taken after). A sensitivity analysis for patients with a pulmonary cause for ARDS alone and for patients without chronic respiratory failure also showed no change in OR. Sensitivity analysis on the association between the phenotypes and hospital mortality showed similar results as in the primary analysis (OR 1.10, 95% CI 1.03 to 1.18). Exposure to steroids on the ICU (147/700, 21%) was associated with a higher likelihood of a ‘reactive’ phenotype (OR 2.1, 95% CI 1.5 to 3.1).
Discussion
Two biologically distinct clusters of patients with ARDS could be identified. Outcome data were not taken into account when separating these clusters. Patients with the ‘reactive’ phenotype were approximately twice as likely to die during their stay in the ICU. Importantly, the biological phenotypes contained additional information compared with two mortality prediction scores and the Berlin classification for ARDS, and these results were validated in an independent group of patients. A ‘reactive’ phenotype could be predicted with the plasma concentration of four biomarkers and routinely available variables led to a less accurate prediction. We speculate that these biological phenotypes might be used to include patients for the appropriate pharmacological therapy in clinical trials.
To our knowledge, this is the first study to cluster patients with ARDS based on biomarker concentrations alone. Cluster analysis maximises the differences between patients, without taking the clinical outcome of a patient into account. Therefore, it is very different from, for example, logistic regression with single biomarkers.34 Calfee et al previously showed two distinct clusters of patients with ARDS within the cohorts of two large clinical trials.17 Both clinical and biomarker data were used to cluster the patients, and the clusters responded differently to randomly allocated changes in ventilator settings. Interestingly, mortality in the phenotypes that we identified was similar to that found in the phenotypes in their study (eg, ±20% vs ±45%). The phenotypes found in the Calfee study were replicated in another RCT population, in which the influence of fluid resuscitation management was tested.21 That study also revealed similar mortality rates and found that the response to randomly allocated fluid management differed per phenotype. All three studies found an increase in plasma IL-8 and PAI-1 concentration and a decrease in bicarbonate concentration in the ‘reactive’ or ‘hyperinflammatory’ phenotype. Therefore, we can speculate that the identified phenotypes could be the same between this observational study and the three RCTs, even though the prevalence of a ‘reactive’ phenotype is higher in our study. This finding would be notable because of the differences between the studies; observation and interventional, recruitment on different continents and inclusion periods spanning >15 years between the ARMA trial and this study. Furthermore, the Calfee et al and Famous et al studies used both clinical and biomarkers data while we limited the analysis to biomarker data alone. Finally, the studies used different methods of clustering. The fact that the results show the identification of very similar phenotypes suggests the underlying identified biological signal is very strong.
The ‘reactive’ phenotype had a higher ICU mortality and might be used to select more severely ill patients for clinical trials (prognostic enrichment). Importantly, this association was independent of APACHE IV score, a frequently used validated and repeatedly calibrated prognostic score for mortality in the ICU. There was also added value of the biological clusters to the Berlin definition in the prediction of mortality. The results imply that the ‘reactive’ phenotype is not just a more severe form of ARDS and most definitely not captures the same grades of severity as the Berlin classification. This finding also illustrates that phenotypic clustering provides additional information, on top of the more frequently used clinical and physiological information. The PaO2/FiO2 is, until now, the only characteristic that has been used for phenotypic inclusion into clinical trials with patients with ARDS,24 ,25 ,35 with moderate success. Several interventions had positive effects on mortality in a selected group of ARDS with a low PaO2/FiO2 ratio.24 ,25 ,35 Interestingly, these were all interventions that aimed for physiological changes to improve oxygenation. In stark contrast, pharmacological interventions aimed at the immune system have repeatedly showed no benefit when applied to unselected ARDS patient groups.7–9
We speculate that the phenotypes, derived from biological data alone, as identified in this study could be used to target pharmacological interventions to those patients that benefit most in future clinical trials. Improved patient selection and targeted intervention is the premise of this so-called ‘stratified medicine’ or ‘precision medicine’.36 The efficacy of some pharmacotherapies could potentially be improved by correctly selecting the subgroups of patients that show molecular signs of susceptibility (predictive enrichment). Simultaneously, this approach may limit exposure of patients that would not benefit, but would have side effects. Thus, stratified medicine may increase efficiency of a drug in two ways: increase benefit and decrease harm. As for the phenotypes identified in this study, we postulate that the ‘reactive’ phenotype might benefit most from immunomodulatory interventions, such as corticosteroids, macrolides or others. On the other hand, the ‘uninflamed’ phenotype may be less likely to benefit from these approaches and/or may be more likely to be harmed, as mortality is infrequent and there is little inflammatory response.
ARDS phenotyping could allow for a more targeted pharmacological intervention in clinical trials and, if shown to be beneficial, in clinical practice. There are, however, several prerequisites before that hypothesis can be tested. The first, prediction of cluster membership by a minimal number of biomarkers, is explored in this paper. IL-6, IFN-γ, ANG1/2 and PAI-1 concentrations in plasma drawn at the moment of ARDS diagnosis were sufficient to discriminate between patients with and without a ‘reactive’ phenotype. A four-biomarker assay is sufficiently small to allow for phenotyping of patients in clinical trials and clinical practice and clinical data alone do not discriminate sufficiently. A second prerequisite is rapid analyses of these biomarkers. We used CBA and Luminex to quantify the biomarker concentrations in this study. These methods are very suitable for batch-wise analysis in observational studies but would be very impractical to select patients for inclusion into clinical trials. Ideally, the result of the test would be available within several hours so that pharmacological therapy can be commenced early in the disease course.
Several limitations and strengths to our study are noticeable. First, we investigated the biological clusters only by means of a limited number of plasma biomarkers. It could be argued that we are still missing several relevant biomarkers that would disclose additional phenotypes. For example, there have been reports on soluble thrombomodulin,37 high-mobility group box 1 protein and sRAGE.38 However, even though we chose to restrict our analyses to a limited set of only 20 biomarkers, these biomarkers do represent three major pathways involved in lung injury.39 We cannot exclude that the addition of other markers would provide us with different phenotypes. The same point can be made for the size of the clusters. Therefore, we do not claim that two is the definitive number of phenotypes for ARDS, but we suggest that there are at least two phenotypes and that this should be taken into account in future research. Additionally, we were unable to associate phenotype with treatment response. This is due to the observational nature of our study. There would be additional value for identification of these phenotypes in patients that were included into RCTs that tested a pharmacological intervention targeting the immune system.
The observational nature of this study is also one of its strengths as it allowed for the inclusion of all consecutive patients with ARDS during 3 years in two university hospitals, and the results are therefore more likely representing the population as encountered on the ICU in daily practice. This is illustrated by the representative prevalence of ARDS, around 10% of ICU patients,2 ,4 although the ICU mortality was lower than in the LUNG SAFE study.2 The results were validated in a cohort that was separated over time; future studies should focus on replicating these results in an entirely independent cohort. Because biomarkers and clinical characteristics were separated completely in the analysis, we could determine that there is considerable orthogonality between the biological response within the patient and the clinical condition as observed from outside. This exemplifies that it is unpractical and may even be impossible to predict the phenotypes by clinical variables alone, as was also shown in the recent study by Famous et al.21 Finally, the physicians treating the patients were completely blind for the results of the biomarker assay as they were analysed only after completion of the study. Thereby, this study is not biased by ‘self-fulfilling prophecies’; clinical parameters that are frequently used for mortality prediction or phenotyping are also available to the treating clinician who may consciously or unconsciously adapt treatment strategies based on this information, which in turn may influence clinical outcome or the association between the variable and outcome.
In conclusion, two biologically distinct clusters of patients with ARDS could be identified with a set of 20 biomarkers of inflammation, coagulation and endothelial activation. Mortality was double in the ‘reactive’ phenotype group than in the ‘uninflamed’ phenotype group. A ‘reactive’ phenotype could be predicted with the plasma concentration of four biomarkers and was independently associated with mortality, also in a validation cohort. These results may improve patient selection for future clinical trials targeting the immune system in patients with ARDS.
DEFINITIONS
Acknowledgments
The authors sincerely thank everyone involved in the MARS project. More information on this public, private consortium can be found on http://www.ctmm.nl/en/projecten/infectie/mars?set_language=en. LB had full access to all of the data in the study and takes responsibility for the integrity of the data and the accuracy of the data analysis.
References
Footnotes
Collaborators MARS Consortium are Jos F Frencken, (Department of Intensive Care Medicine and Julius Center for Health Sciences and Primary Care, University Medical Center Utrecht, Utrecht, the Netherlands); Marc Bonten, Peter M C Klein Klouwenberg, David Ong (Department of Medical Microbiology, University Medical Center Utrecht, Utrecht, the Netherlands) and Roosmarijn T M van Hooijdonk, Mischa A Huson, Laura R A Schouten, Marleen Straat, Lonneke A van Vught, Maryse A Wiewel, Esther Witteveen, Gerie J Glas, and Luuk Wieske, (Department of Intensive Care Medicine, Academic Medical Center, University of Amsterdam); Brendon P Scicluna, Arjan J Hoogendijk, H Belkasim-Bohoudi, Tom van der Poll (Center of Experimental Molecular Medicine; CEMM, Academic Medical Center, University of Amsterdam). The list of MARS Consortium members is also available as an online supplementary appendix.
Contributors LDB, LRS and MJS: study design, data collection, data analysis, data interpretation and writing. LAV, MAW, DO OC and AJH: data collection, data analysis, data interpretation and writing. AA, IML, TvdP, JH and NF: study design, data analysis, data interpretation and writing. CSC: data analysis, data interpretation and writing.
Funding Center for Translational Molecular Medicine, 10.13039/501100006020, MARS project.
Competing interests CC was supported by the NIH (HL133390 and HL131621).
Ethics approval UMCU and AMC (IRBNo.10-056C).
Provenance and peer review Not commissioned; externally peer reviewed.