Article Text

Abstract
Introduction Cystic Fibrosis (CF) newborn screening (NBS) was implemented across the UK in 2007. It has been associated with improved clinical outcomes particularly related to nutrition. We reviewed the nutritional progress of infants diagnosed with CF by NBS in the West Midlands. Our aim was to develop a model for predicting height and weight in the first 2 years of life based on information available at the first clinic visit.
Methods Anthropometric data is recorded at each outpatient visit for children with CF. This data was reviewed in conjunction with the CF NBS data for all children diagnosed with CF in the West Midlands between November 2007 and October 2014. Cluster analysis, classification and polynomial regression modelling were used to analyse these data. Models were validated using the 5-fold cross validation method.
Results 144 children were identified with CF at a mean age of 22 days. There was no difference in birth weight z scores between pancreatic insufficient and pancreatic sufficient children (−0.05 vs −0.36, p = 0.29) however a significant difference was observed in rate of weight gain from birth to first clinic visit (−0.1 vs −0.33, p = 0.007). Time taken for children to reach a z score of 0 for weight was 65 weeks and length was 90 weeks. Cluster analysis identified two distinct groups of children. Faecal elastase (FE) being the main determinant of class, with a cut off of 212 μg/g. Our models can predict weight z score at 1 and 2 years with a mean absolute error of 0.51 and 0.67 and length z scores at 1 and 2 years with an accuracy of 0.7 and 0.85. The most important factor when predicting future nutritional parameters was birth weight z score.
Conclusions We have developed and validated models that can provide a good estimate of weight and height z scores in the first 2 years of life for children diagnosed with CF by NBS. These models only require data available at the first clinic visit. They can potentially be used by clinicians to identify children at risk of poor nutritional outcomes thus, encouraging closer monitoring and earlier intervention.
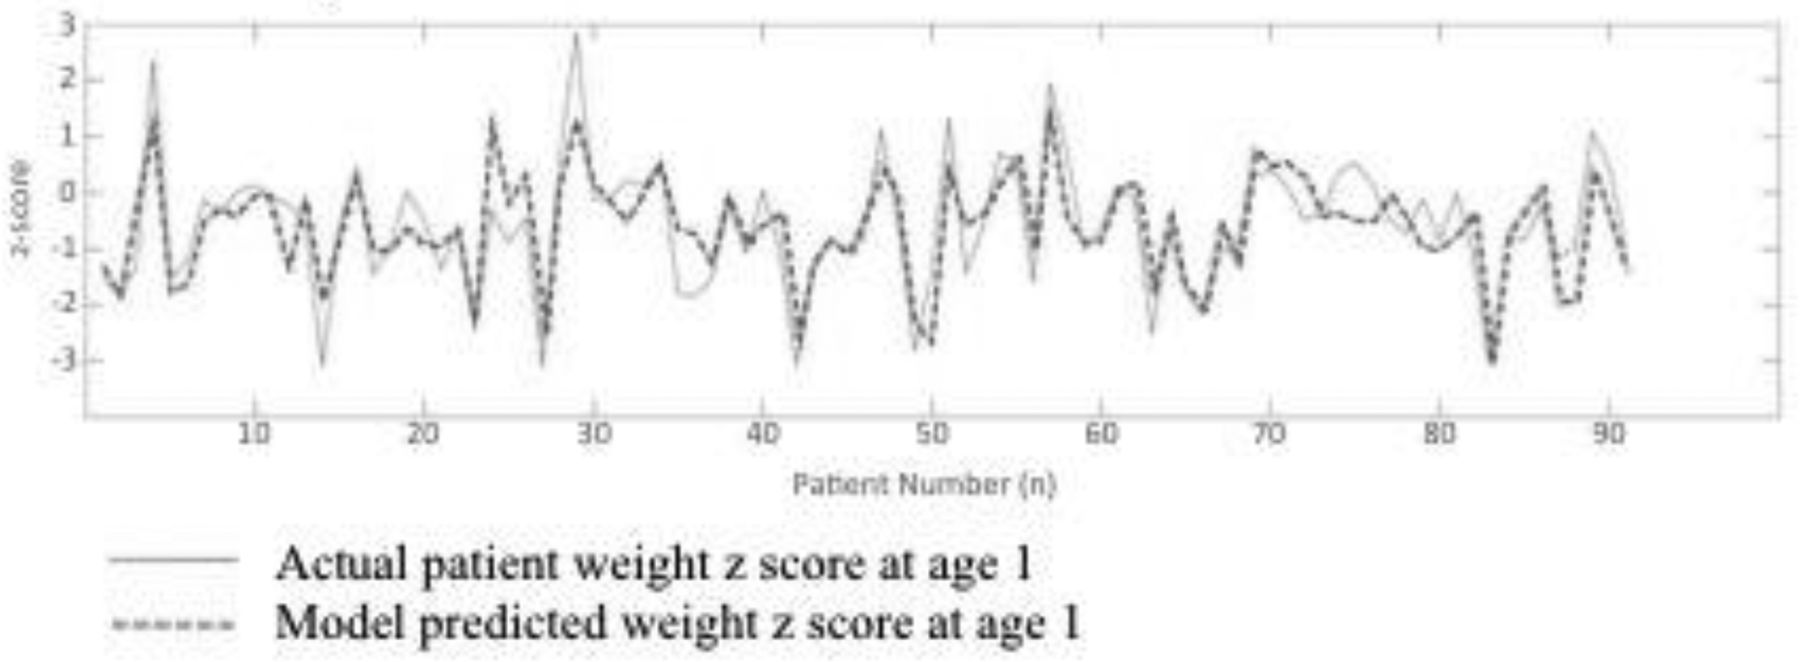
Schematic representation of the accuracy of the model predicting weight z score at age 1