Article Text

Statistics from Altmetric.com
Summary of recommendations
This guideline is based on a comprehensive review of the literature on pulmonary nodules and expert opinion. Although the management pathway for the majority of nodules detected is straightforward it is sometimes more complex and this is helped by the inclusion of detailed and specific recommendations and the 4 management algorithms below. The Guideline Development Group (GDG) wanted to highlight the new research evidence which has led to significant changes in management recommendations from previously published guidelines. These include the use of two malignancy prediction calculators (section ‘Initial assessment of the probability of malignancy in pulmonary nodules’, algorithm 1) to better characterise risk of malignancy. There are recommendations for a higher nodule size threshold for follow-up (≥5 mm or ≥80 mm3) and a reduction of the follow-up period to 1 year for solid pulmonary nodules; both of these will reduce the number of follow-up CT scans (sections ‘Initial assessment of the probability of malignancy in pulmonary nodules’ and ‘Imaging follow-up’, algorithms 1 and 2). Volumetry is recommended as the preferred measurement method and there are recommendations for the management of nodules with extended volume doubling times (section ‘Imaging follow-up’, algorithm 2). Acknowledging the good prognosis of sub-solid nodules (SSNs), there are recommendations for less aggressive options for their management (section ‘Management of SSNs’, algorithm 3).
The guidelines provide more clarity in the use of further imaging, with ordinal scale reporting for PET-CT recommended to facilitate incorporation into risk models (section ‘Further imaging in management of pulmonary nodules’) and more clarity about the place of biopsy (section ‘Non-imaging tests and non-surgical biopsy’, algorithm 4). There are recommendations for the threshold for treatment without histological confirmation (sections ‘Surgical excision biopsy’ and ‘Non-surgical treatment without pathological confirmation of malignancy’, algorithm 4).
Finally, and possibly most importantly, there are evidence-based recommendations about the information that people need and which should be provided. This document is intended to be used both as a summary in the day to day management of a person with a pulmonary nodule and a comprehensive reference text.
Recommendations
Route of detection of pulmonary nodules
Use the same diagnostic approach for nodules detected incidentally as those detected through screening. Grade D
Consider using the presence of previous malignancy as a factor in the risk assessment for further investigation. Grade D
Do not prioritise management of pulmonary nodules according to the route of presentation. Grade D
Evaluate coexistent lung nodules detected in patients with known lung cancer otherwise suitable for radical treatment in their own right; they should not be assumed to be malignant. Grade D
Initial assessment of the probability of malignancy in pulmonary nodules
Do not offer nodule follow-up or further investigation for people with nodules with diffuse, central, laminated or popcorn pattern of calcification or macroscopic fat. Grade C
Do not offer nodule follow-up or further investigation for people with typical perifissural or subpleural nodules (homogeneous, smooth, solid nodules with a lentiform or triangular shape either within 1 cm of a fissure or the pleural surface and <10 mm). Grade C
Consider follow-up of larger intrapulmonary lymph nodes, especially in the presence of a known extrapulmonary primary cancer. Grade D
Do not offer nodule follow-up for people with nodules <5 mm in maximum diameter or <80 mm3 volume. Grade C
Offer CT surveillance to people with nodules ≥5 mm to <8 mm maximum diameter or ≥80 mm3 to <300 mm3. Grade C
Use composite prediction models based on clinical and radiological factors to estimate the probability that a pulmonary nodule (≥8 mm or ≥300 mm3) is malignant. Grade C
Use the Brock model (full, with spiculation) for initial risk assessment of pulmonary nodules (≥8 mm or ≥300 mm3) at presentation in people aged ≥50 who are smokers or former smokers. Grade C
Consider the Brock model (full, with spiculation) for initial risk assessment of pulmonary nodules (≥8 mm or ≥300 mm3) in all patients at presentation. Grade D
Base the risk assessment of people with multiple pulmonary nodules on that of the largest nodule. Grade C
Nodule malignancy risk prediction models should be validated in patients with known extrapulmonary cancer. RR
Further analysis of variation in volumetry measurements by different software packages should be undertaken and methods developed for standardisation. RR
Imaging follow-up
Where initial risk stratification assigns a nodule a chance of malignancy of <10%, assess growth rate using interval CT with capability for automated volumetric analysis. Grade C
Assess growth for nodules ≥80 mm3 or ≥6 mm maximum diameter by calculating volume doubling time (VDT) on the basis of repeat CT at 3 months and 1 year. Grade C
Use a ≥25% volume change to define significant growth. Grade C
Assess growth for nodules of ≥5 to <6 mm maximum diameter by calculating VDT on the basis of repeat CT at 1 year. Grade C
Offer further diagnostic investigation (biopsy, imaging or resection) for patients with nodules showing clear growth or a VDT of <400 days (assessed after 3 months, and 1 year). Grade C
Discharge patients with solid nodules that show stability (<25% change in volume) on CT after 1 year. Grade C
If two-dimensional diameter measurements are used to assess growth, follow-up with CT for a total of 2 years. Grade D
Consider ongoing yearly surveillance or biopsy for people with nodules that have a VDT of 400–600 days, according to patient preference. Grade C
Consider discharge or ongoing CT surveillance for people who have nodules with a VDT of >600 days, taking into account patient preference and clinical factors such as fitness and age. Grade C
Where nodules are detected in association with an extrapulmonary primary cancer, consider the growth rate in the context of the primary and any treatment thereof. Grade D
Management of sub-solid nodules (SSNs)
Do not follow-up SSNs that are <5 mm in maximum diameter at baseline. Grade C
Reassess all SSNs with a repeat thin-section CT at 3 months. Grade D
Use the Brock risk prediction tool to calculate risk of malignancy in SSNs ≥5 mm that are unchanged at 3 months. Grade C
Consider using other factors to further refine the estimate of risk of malignancy, including smoking status, peripheral eosinophilia, history of lung cancer, size of solid component, bubble-like appearance and pleural indentation. Grade D
Offer repeat low-dose, thin-section CT at 1, 2 and 4 years from baseline where the risk of malignancy is approximately <10%. Grade D
Discuss the options of observation with repeat CT, CT-guided biopsy, or resection/non-surgical treatment with the patient where the risk of malignancy is approximately >10%; consider factors such as age, comorbidities and risk of surgery. Grade D
Consider using changes in mass of SSNs to accurately assess growth. Grade D
Consider resection/non-surgical treatment or observation for pure ground-glass nodules (pGGNs) that enlarge ≥2 mm in maximum diameter; if observed, repeat CT after a maximum of 6 months. Take into account patient choice, age, comorbidities and risk of surgery. Grade D
Favour resection/non-surgical treatment over observation for part-solid nodules (PSNs) that show enlargement of the solid component, or for pGGNs that develop a solid component. Take into account patient choice, age, comorbidities and risk of surgery. Grade D
Favour resection/non-surgical treatment over observation where malignancy is pathologically proven. Take into account patient choice, age, comorbidities and risk of surgery. Grade D
Further imaging in management of pulmonary nodules
Offer a PET-CT scan to patients with a pulmonary nodule with an initial risk of malignancy of >10% (Brock model) where the nodule size is greater than the local PET-CT detection threshold. Grade B
Ensure that PET-CT reports include the method of analysis. Grade D
Use qualitative assessment with an ordinal scale to define FDG uptake as absent, faint, moderate or high using the following guide:
Absent—uptake indiscernible from background lung tissue
Faint—uptake less than or equal to mediastinal blood pool
Moderate—uptake greater than mediastinal blood pool
Intense—uptake markedly greater than mediastinal blood pool. Grade D
Reassess risk after PET-CT using the Herder prediction tool. Grade B
After reassessment of risk:
Consider CT surveillance for people who have nodules with a chance of malignancy of <10%.
Consider image-guided biopsy where the risk of malignancy is assessed to be between 10 and 70%; other options are excision biopsy or CT surveillance guided by individual risk and patient preference.
Offer people surgical resection as the favoured option where the risk that the nodule is malignant is >70%; consider non-surgical treatment for people who are not fit for surgery. Grade C
Do not use MRI, single photon emission CT (SPECT) or dynamic contrast-enhanced CT to determine whether a nodule is malignant where PET-CT is an available alternative. Grade D
Further research is needed into the most effective follow-up pathway in low to medium risk patients and for those with pGGNs. RR
Further research should be undertaken into the use of PET-CT in the evaluation of pGGNs using lower standardised uptake value (SUV) cut-off values. RR
Non-imaging tests and non-surgical biopsy
Do not use biomarkers in the assessment of pulmonary nodules. Grade D
Consider bronchoscopy in the evaluation of pulmonary nodules with bronchus sign present on CT. Grade D
Consider augmenting yield from bronchoscopy using either radial endobronchial ultrasound, fluoroscopy or electromagnetic navigation. Grade D
Offer percutaneous lung biopsy where the result will alter the management plan. Grade C
Consider the use of other imaging techniques such as C-arm cone beam CT and multiplanar reconstruction to improve diagnostic accuracy. Grade D
Consider the risk of pneumothorax when deciding on a transthoracic needle biopsy. Grade C
Interpret negative lung biopsies in the context of the pre-test probability of malignancy. Grade D
Consider repeating percutaneous lung biopsies where the probability of malignancy is high. Grade D
Undertake research into the application of new and existing biomarkers in the evaluation of pulmonary nodules. RR
Surgical excision biopsy
Surgical resection of pulmonary nodules should preferentially be by video-assisted thoracoscopic surgery (VATS) rather than by an open approach. Grade C
Offer lobectomy (to patients fit enough to undergo the procedure) as definitive management of a pulmonary nodule confirmed as lung cancer preoperatively or after wedge resection and intraoperative frozen section analysis during the same anaesthetic procedure. Grade C
Consider anatomical segmentectomy where preservation of functioning lung tissue may reduce the operative risk and improve physiological outcome. Grade D
Consider a diagnostic anatomical segmentectomy for nodules <2 cm in diameter without nodal disease when there has been no pathological confirmation and frozen section analysis is not possible. Grade D
Use localisation techniques depending on local availability and expertise to facilitate limited resection of pulmonary nodules. Grade D
Consider sublobar resection for pGGNs deemed to require surgical resection owing to the excellent long-term prognosis and low risk of local relapse. Grade D
Prospective trials should compare complications and oncological outcomes from lobectomy versus anatomical segmentectomy in appropriately selected patients. RR
Non-surgical treatment without pathological confirmation of malignancy
Consider people who are unfit for surgery who have pulmonary nodule(s) with high probability of malignancy, where biopsy is non-diagnostic or not possible, for treatment with stereotactic ablative body radiotherapy (SABR) or radiofrequency ablation (RFA) if technically suitable. Grade C
Consider people who are unfit for surgery who have pulmonary nodule(s) with high probability of malignancy, where biopsy is non-diagnostic or not possible, for treatment with conventional radical radiotherapy if not suitable for SABR or RFA. Grade D
Do not use inhaled corticosteroids in the management of indeterminate pulmonary nodules. Grade B
Do not use antibiotics in the management of indeterminate pulmonary nodules. Grade D
Consider prospective randomised trials of local treatments for pathologically proven or clinically diagnosed early-stage lung cancer and pulmonary oligometastases. RR
Prospective randomised trials of interventions for pathologically proven or clinically diagnosed early-stage lung cancer should include assessment of harms. RR
Information and support
Offer accurate and understandable information to patients and carers about the probability of malignancy of the pulmonary nodule. Grade D
Ensure patients have the opportunity to discuss concerns about lung cancer and surveillance regimens. Grade D
Offer patients the choice of seeing a lung cancer nurse specialist where the probability of malignancy is high or when patients are anxious about the possibility of having lung cancer. Grade D
Ensure that clear written and verbal information is available on follow-up schedules and the number of repeat CT scans required. Grade D
Explain the risks and benefits of investigations and treatment. Where appropriate, offer a choice of management. Grade D
Inform patients who remain at high risk of developing malignancy about the warning symptoms of lung cancer at the start of observation and at discharge from follow-up. Grade D
Emphasise to patients the importance of smoking cessation and offer referral to smoking cessation services. Grade D
Technical aspects of the imaging of pulmonary nodules
Where CT scans are performed that include the chest where nodule detection is of potential importance, use a maximum section thickness of 1.25 mm. Grade C
Use low radiation dose CT with a maximum section thickness of 1.25 mm in follow-up imaging. Grade C
Use maximum intensity projection (MIP) or volume rendering (VR) to improve nodule detection and characterisation. Grade C
Use diameter measurements where volumetry is not possible or where there is clear evidence of marked growth. Grade D
When reporting on growth, take into account factors that may reduce accuracy such as nodule shape and position and interval between scans. Grade D
Ensure a radiologist or radiographer checks that the nodule has been accurately segmented. Grade D
Introduction
Pulmonary nodules are well or poorly circumscribed, approximately rounded structures that appear on imaging as focal opacities and by traditional definition are ≤3 cm in diameter and surrounded by aerated lung (table 1). They may be single or multiple and do not have associated abnormalities in the thorax, such as lymphadenopathy or pleural disease. This definition is now commonly extended to include nodules in contact with the pleura. The now widespread use of helical multi-detector row CT has made it commonplace to detect, incidentally, nodules <1 cm in diameter as well as SSNs that are partly or wholly ground-glass opacities. These smaller nodules arguably present a greater clinical challenge than their larger counterparts and are therefore included in the scope of this guideline. Where appropriate, guidance is tailored to these distinct groups although it should be noted that in the literature precise definitions are not always given and a variety of terms are used. This is highlighted in the evidence review sections where necessary. This guideline proposes to standardise definitions and terms and these are shown in table 1 and figure 5, with images of the types of nodules shown in figure 6.
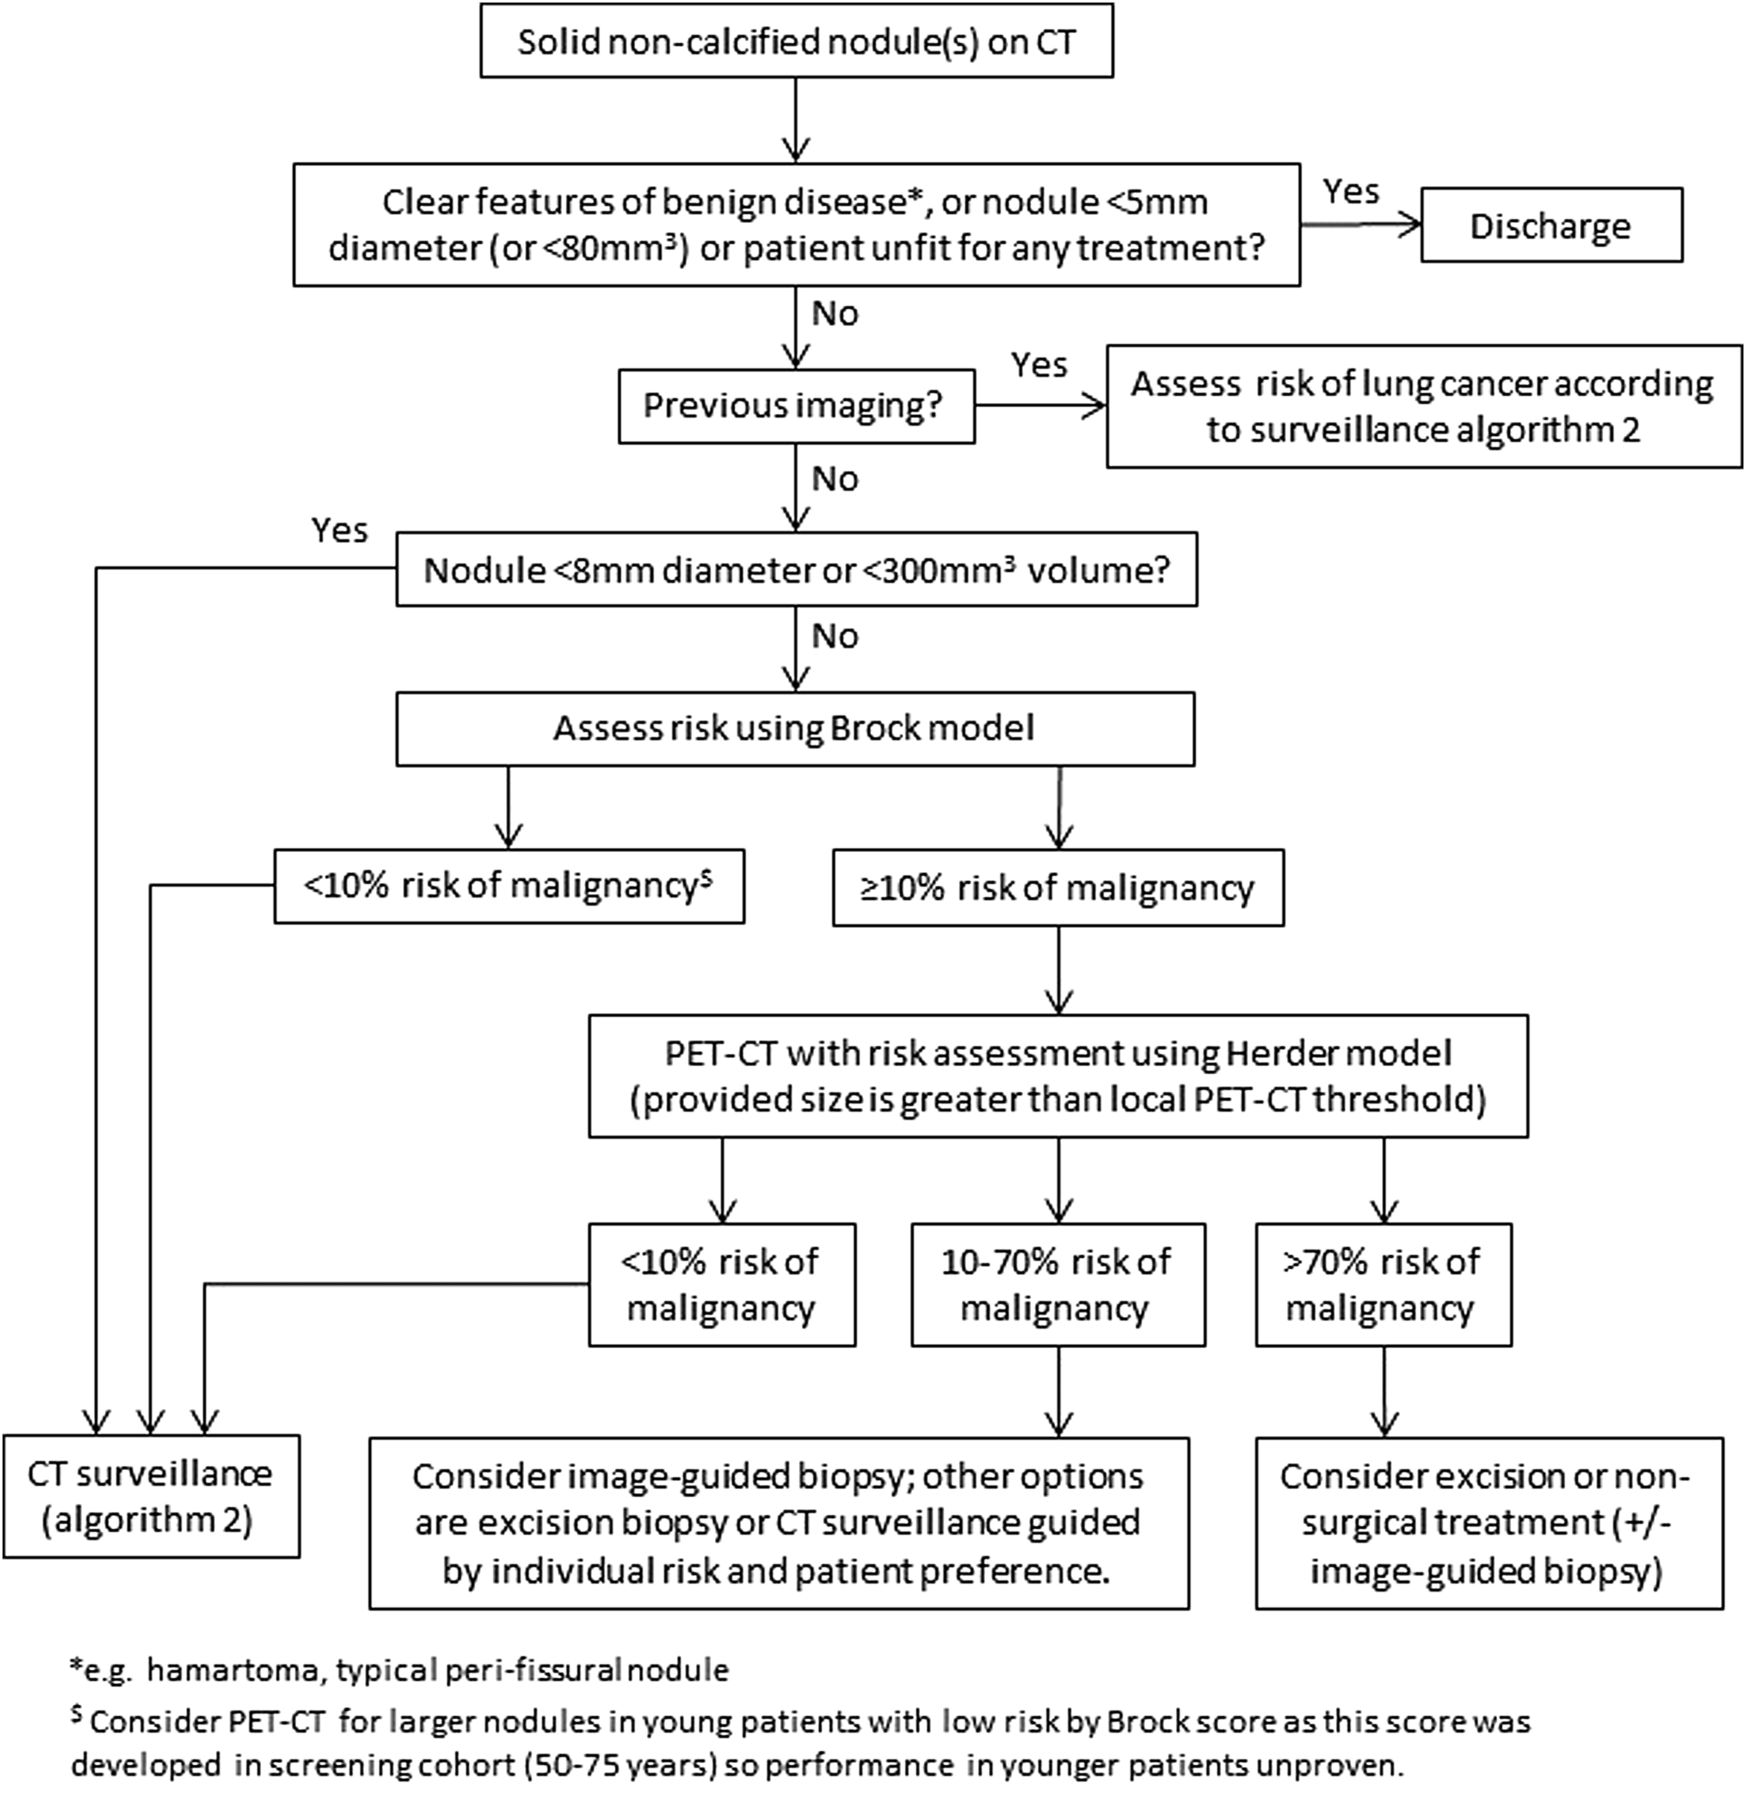
Initial approach to solid pulmonary nodules.

Solid pulmonary nodule surveillance algorithm. VDT, volume doubling time.

Sub-solid pulmonary nodules algorithm. PSNs, part solid nodules; SSN, sub-solid nodules.

Pulmonary nodule treatment algorithm. RFA, radiofrequency ablation; SABR, stereotactic ablative body radiotherapy.

Classification of pulmonary nodules.

Images of nodules.
Classification of adenocarcinoma and the relationship to nodule characteristics
In the current classification of lung adenocarcinoma,1 two preinvasive lesions and one early invasive lesion are defined (see also section ‘Management of SSNs’). Atypical adenomatous hyperplasia (AAH) is a premalignant lesion that typically measures <5 mm in diameter and may appear as a pure ground-glass nodule (pGGN) or may not be apparent on CT. Adenocarcinoma in situ (AIS) is a preinvasive lesion that may measure up to 30 mm in diameter and typically appears as a pGGN on CT. AAH is a relatively common incidental finding, present in the lung tissue adjacent to resected adenocarcinomas in up to 23% of cases. A small but unknown proportion of AAH lesions may evolve (often slowly) into AIS, and AIS may progress to become invasive adenocarcinoma. The first stage of AIS becoming invasive adenocarcinoma is termed minimally invasive adenocarcinoma (MIA). MIA is defined as a lesion of AIS within which there is an area of invasive adenocarcinoma that measures ≤5 mm in diameter. MIA may correlate with an appearance on CT as a ground-glass opacity within which there is a solid area measuring <5 mm (see table 2).
Aspects of the new classification of adenocarcinoma in relation to nodule type
Aim of the guideline
The detection of pulmonary nodules is common. In populations undergoing CT screening and at high risk of lung cancer, nodules are detected in 20–50% of individuals, depending on the size of the cut-off point for reporting a nodule. The majority of these nodules are small and benign but some will be malignant and, according to the National Lung Screening Trial (NLST), effective treatment will result in a reduction in mortality.2 It is important to have clear guidance about the most effective way to manage these nodules and an assessment of how data from screening studies can be used to guide the approach on other populations and individuals. It is acknowledged that the majority of the evidence reviewed for this guideline comes from countries outside the UK and that there are potentially important differences in populations as a result of their geographical location.
The aim of this guideline is therefore to provide comprehensive recommendations for the management of pulmonary nodules in the UK according to the definitions given above. The recommendations will apply to the UK healthcare system making clear where evidence may have limited applicability.
Target audience
The BTS guideline for the investigation and management of solitary and multiple pulmonary nodules is aimed primarily at practitioners within the UK. This will include physicians, general practitioners, nurses, radiologists, surgeons and other healthcare professionals. It may be of relevance to other healthcare systems.
Groups covered
Adults (≥18 years) with pulmonary nodules
Adults with single and multiple pulmonary nodules
Adults with nodules that are detected in the context of current or previously treated malignancy (either pulmonary or extrapulmonary)
Adults with nodules detected in routine clinical practice, as part of radiological surveillance after a previous malignancy, or by CT screening for lung cancer
Adults with nodules of different morphologies including pGGNs and part-solid nodules (PSNs)
Groups not covered
Children (younger than 18) with pulmonary nodules
Adults where the nodule in question has been pathologically shown to represent lung cancer or a pulmonary metastasis from another cancer
Topics covered
The route of detection of pulmonary nodules
Risk assessment for malignancy based on clinical and radiological factors
Imaging follow-up
SSNs
Further imaging of pulmonary nodules
Biopsy techniques, indications, interpretation and risks
Surgical excision
Indications for recommending curative treatment in the absence of a pathological diagnosis
Information and support for patients and carers
Technical aspects of imaging pulmonary nodules
Topics not covered
The guidelines will cross-reference to the NICE Guideline CG121 Lung Cancer: the diagnosis and treatment of lung cancer. Service organisation was not included as part of the literature review, but following stakeholder comments a suggested approach to service organisation is given in appendix 3.
Methodology
This guideline is based on the best available evidence. The methodology used to write the guideline adheres strictly to the criteria as set out by the AGREE collaboration, which is available online http://www.agreetrust.org/resource-centre/agree-ii/. The British Thoracic Society Standards of Care Committee guideline production manual is available at: https://www.brit-thoracic.org.uk/guidelines-and-quality-standards/.
Clinical questions and literature search
Clinical questions were structured in the PICO (Patient, Intervention, Control, Outcome) format, to define the scope of the guideline and inform the literature search (see online supplementary appendix 1).
Systematic electronic database searches were conducted to identify potentially relevant studies for inclusion in the guideline. For each topic area the following databases were searched: Ovid MEDLINE (including MEDLINE In Process), Ovid EMBASE and the Cochrane Library (including the Cochrane Database of Systematic Reviews, the Database of Abstracts of Reviews of Effects) from 1980.
The searches were first run in November 2012 and updated in June 2014, (see online supplementary appendix 2 for search strategy). Searches included a combination of indexed terms and free text terms and were limited to English language publications only. The initial search identified 6819 potential abstracts and the second search 2739.
Appraisal of literature
Appraisal was performed to be compliant with the AGREE collaboration. Two individuals (DRB and MEJC) read the title and abstract of each article retrieved by the literature searches and decided whether the paper was definitely relevant, possibly relevant or not relevant to the project. Criteria formulated for categorising the abstracts into these three groups were:
Whether the study dealt with the clinical question.
Whether the appropriate study type was used to produce the best evidence to answer the clinical question.
Review articles were excluded.
Abstract was in English.
Abstracts were reviewed irrespective of the journal of publication, country in which the research was performed or published and the date of publication.
The full paper was obtained for all relevant or possibly relevant abstracts and allocated to the relevant section(s) of the guideline.
The first screening process identified 2021 of the initial 6819 reference abstracts to be definitely or possibly relevant to the guideline. Two guideline reviewers for each section independently reviewed the abstracts to identify papers to be appraised for the guideline. The two reviewers for each section then independently appraised each paper assigned to them using the Scottish Intercollegiate Guidelines Network (SIGN) critical appraisal checklists. The reliability of the evidence in each individual study was graded using the SIGN critical appraisal check lists. The body of evidence for each recommendation was summarised into evidence statements and graded using the SIGN grading system (see table 3).
Key to evidence statements
Disagreements were resolved by discussion with the section partner. The second literature search in June 2014 yielded 2739 abstracts of which 1611 were possibly definitely or relevant. Four members of the group (DRB, MEJC, KR and IW) sorted the references into subject groups and these were forwarded to the pairs of reviewers for each group.
Considered judgement and grading of evidence
The GDG used the evidence tables to judge the body of evidence and grade recommendations for this guideline. Evidence tables are available in online supplementary appendix 3. Where evidence was lacking to answer the formulated clinical questions, expert opinions were obtained through consensus. The following were considered in grading of the recommendations:
The available volume of the body of evidence.
How applicable the obtained evidence was in making recommendations for the defined target audience of this guideline.
Whether the evidence was generalisable to the target population for the guideline.
Whether there was clear consistency in the evidence obtained to support recommendations.
What the implications of recommendations would be on clinical practice in terms of resources and skilled expertise.
Cost-effectiveness was not reviewed in detail as in-depth economic analysis of recommendations fell beyond the scope of this guideline.
Recommendations were graded from A to D according to the strength of the evidence as shown in table 4. In line with SIGN guidance, ‘minus’ evidence was considered in context but in the absence of other ‘plus’ supporting evidence, it was discussed by the GDG and any recommendation hence made was grade D. Important practical points lacking any research evidence, and not likely to be obtained by research evidence were highlighted as ‘good practice points’. Recommendations for further research are designated ‘RR’.
Grades of recommendations
Drafting the guideline
The GDG corresponded regularly by email, and meetings of the full group were held in February, May and November 2012, February, April, June and October 2013, February and June 2014. The BTS Standards of Care Committee (SOCC) reviewed the draft guideline in September 2014. The draft guideline was made available online in January 2015 for public consultation. A draft guideline document was circulated to all the relevant stakeholders for consultation in January 2015. The BTS SOCC re-reviewed the revised draft guideline and granted final approval in March 2015.
Updating the guideline
It is intended that the recommendations in this guideline will remain valid for 5 years. The need for an update will be reviewed 3 years after publication and an update planned if important new evidence emerges. The GDG also has a specific recommendation to clinicians in respect of managing pulmonary nodules. This is to maintain a database of patients with nodules for at least the life of this guideline. This is required because some of the recommendations state that patients can be discharged from follow-up on the basis of current evidence and UK policy on screening. If longer surveillance periods are recommended in the future, a database will allow identification of patients who may be offered extended follow-up.
✓Good practice point: Maintain a database of patients with pulmonary nodules for the purpose of monitoring outcomes and facilitating recall for further surveillance if required.
Declaration of interests
The GDG members adhered to the BTS policy for the declaration of interests (available on the BTS website or by contacting BTS head office).
Guideline development group members
The GDG would also like to acknowledge Dr Anand Devaraj and Dr Sue Copley for their extensive and very helpful comments as stakeholders on behalf of the British Society of Thoracic Imaging.
Stakeholder organisations
The draft guideline was made available for public consultation in January 2015 and feedback was invited from the following organisations:
Royal College of Physicians, London
Royal College of Physicians, Edinburgh
Royal College of Physicians and Surgeons of Glasgow
Royal College of Radiologists
Royal College of Pathologists
Royal College of General Practitioners
The Society for Cardiothoracic Surgery in Great Britain and Ireland (SCTS)
British Thoracic Oncology Group
British Society of Thoracic Imaging
British Nuclear Medicine Society (BNMS)
National Lung Cancer Forum for Nursing (NLCFN)
Primary Care Respiratory Society—UK
Association of Respiratory Nurse Specialist
Association for Chartered Physiotherapists in Respiratory Care
The pulmonary nodule pathway
In developing the PICO questions, the GDG considered the pathway that patients take from detection through diagnosis, treatment and follow-up. Figure 7 shows the pathway used with the PICO questions (modified from the original after a revision following the initial literature review).
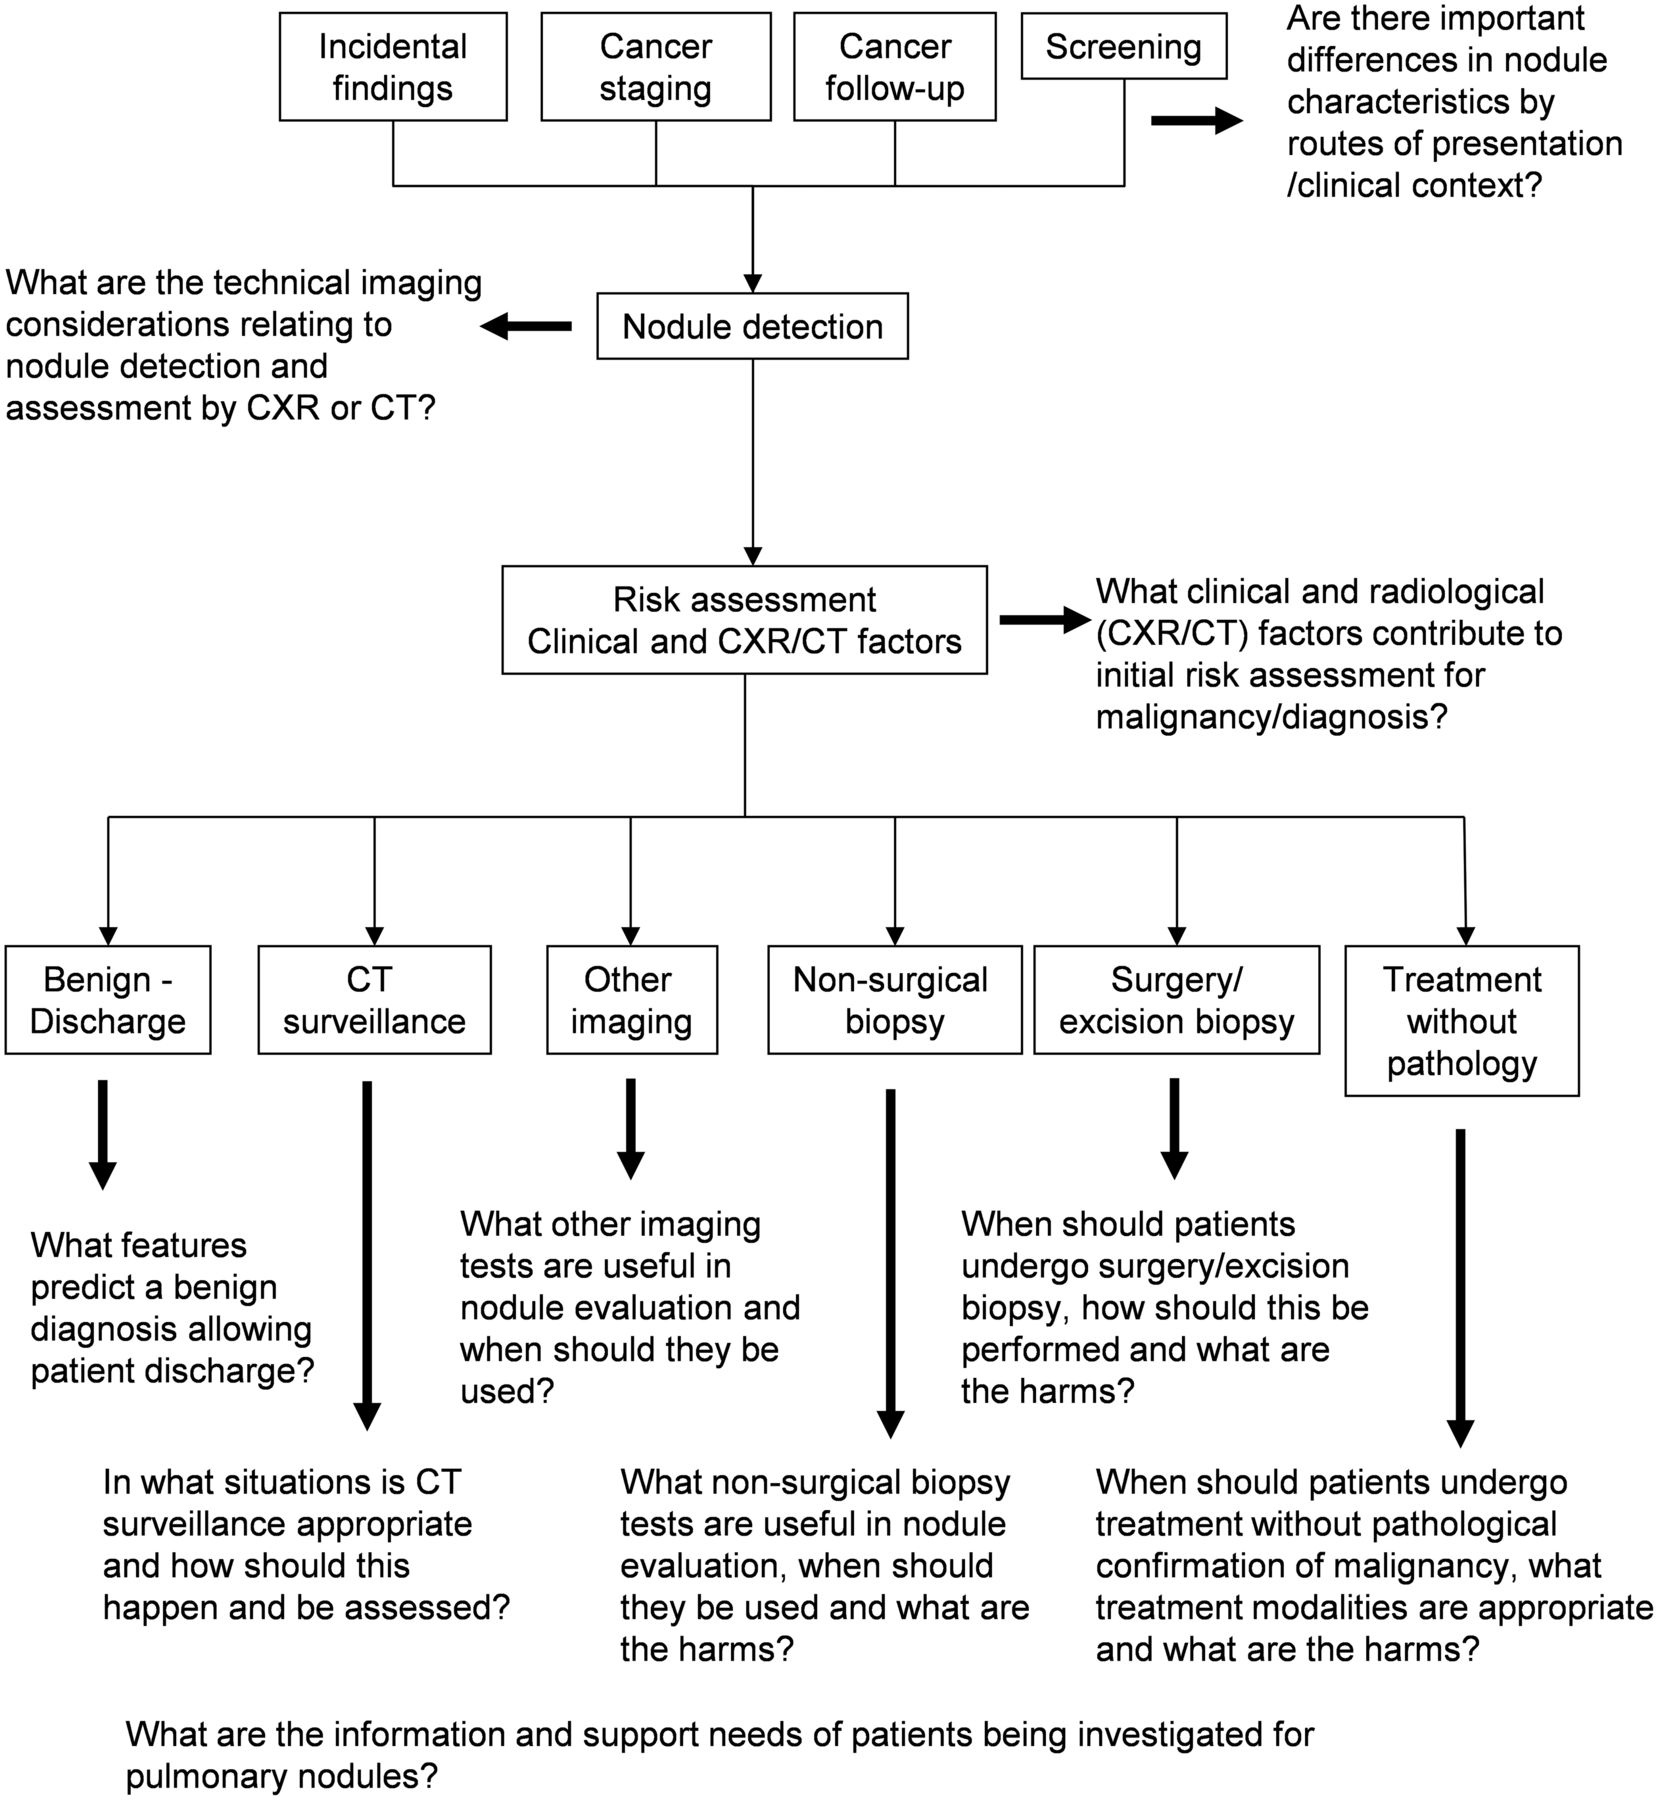
Nodule pathway use to generate key questions, with modified PICO (Patient, Intervention, Control, Outcome) questions after literature review.
Route of detection of pulmonary nodules
Key question: Are there important differences in nodule characteristics according to the route of presentation and clinical context?
The detection of lung nodules and the subsequent risk of malignancy may be influenced by the route of presentation and clinical context. The routes to presentation can be broadly divided into:
Patients with respiratory symptoms referred for chest X-ray (CXR) examination or CT chest scan.
Incidental finding on CXR, CT chest scan, or cross-sectional imaging for other purposes.
Patients participating in lung cancer screening studies or programmes.
Patients with known cancer undergoing staging investigations or follow-up imaging.
Evidence review
No studies directly comparing lung nodules by the route of presentation/clinical context were found. The prevalence and aetiology of lung nodules in different contexts have been described in a number of case series. There were no studies of sufficient size in patients with respiratory symptoms referred for chest imaging (group 1 above). Eleven case series were identified reporting incidental findings on thoracic imaging performed for other purposes (five cardiac CT, three CT angiogram, two trauma CT, one CT abdomen). There were 21 case series of lung cancer screening (17 population based and four occupational studies), and eight case series reporting pulmonary nodules diagnosed on CT to stage a known cancer (two studies relating to lung cancer, six to extra-thoracic cancers). For the purposes of the evidence review, series of incidental and screen-detected nodules were considered together.
Incidental finding of pulmonary nodules and lung cancer screening studies
Only one study was undertaken in the UK (incidental findings on CT angiogram).3 Sixteen studies were from North America and Canada,4–19 13 from Europe20–32 and two from Korea and Japan.33 ,34 Nodule and lung cancer prevalence by country/continent in which the study was performed is shown in table 5.
Prevalence of lung nodules and cancer by geographical area
Nodule prevalence in the largest screening study of 53 439 participants aged 55–74 years, with a history of at least 30 pack-years of smoking2 was 25.9% with a lung cancer prevalence of 1.1%. The prevalence of nodules and lung cancer in the screening and incidental finding studies are shown in table 6. Screening studies recruit asymptomatic people at higher risk of lung cancer, whereas studies of the incidental finding of pulmonary nodules include a mixture of younger patients at low risk of lung cancer (trauma studies) and people at higher risk who may have similar risk factors for lung cancer (cardiac CT).
Lung nodule and cancer prevalence in series of incidentally detected nodules and screening trials
Studies in patients with known cancer
A number of case series have examined the prevalence of malignant nodules in patients with known cancer. Interpretation of these studies is limited by their heterogeneous nature—in particular, reporting of the stage of the primary tumour, the time from diagnosis of the primary tumour in relation to the CT scan demonstrating nodules, the definition of nodule size and selection criteria for further investigation or follow-up.
Three studies grouped the primary sites according to predicted likelihood of metastasising to the lung based on the following groups:
Patients with squamous cell cancers of the head and neck.
Patients with lymphoma or leukaemia.
Patients with carcinomas of the urinary bladder, breast, uterine cervix, biliary tree, oesophagus, ovary, prostate or stomach.
Patients with carcinomas of the salivary glands, adrenal gland, colon, parotid gland, kidney, thyroid gland, thymus or uterus.
Patients with melanoma, sarcoma or testicular carcinoma.
Using multivariate analysis, one study36 found an association between the type of extrapulmonary cancer and the proportion of lung cancer/metastatic nodules. Groups 1–3 were more likely to have a lung primary and group 5 more likely to be metastatic, although numbers in each group were small. Another study37 did not find this association or an association with stage (III or IV) of the primary tumour. A third study38 found that group 4 patients were more likely to have a malignant nodule. A further study39 of patients with known extrapulmonary cancer referred for resection of a lung nodule found that 68% of resected nodules were malignant, of which 58% were non-small cell lung cancer (NSCLC); 113 nodules (10%) were metastases. Logistic regression analysis suggested that nodules were more likely to be NSCLC in patients aged >55 years, smokers and if the known cancer was breast or prostate.
Two case series reported subcentimetre lung nodules detected preoperatively on CT in patients who had undergone curative surgery for lung cancer in Asia. One study40 of 223 patients found that 26% of patients had nodules, of which 6% were malignant. Half of the malignant nodules were found in the primary tumour lobe. The second study41 reported nodule prevalence in 582 patients in the non-primary lobe which was not resected at the time of surgery. This study group included only patients with 24 months’ follow-up CT data (141 of 582 undergoing resection); 62 (44%) patients had a nodule and 3% were malignant. A study from the UK42 included 551 patients with lung cancer who had a staging CT scan and who were considered operable. Eighty-eight patients (16%) were found to have small non-calcified pulmonary nodules (size range 4–12 mm). Adequate follow-up (histological confirmation or CT follow-up for 24–48 months) was possible only in 25 patients who had a total of 36 nodules. Twenty-five nodules (70%) were subsequently confirmed to be benign, four (11%) were malignant and the nature of seven (19%) could not be determined.
Smyth et al43 reported histological findings from biopsy of suspicious lesions in 229 patients with previous malignant melanoma. They found that 88% of the biopsies were malignant; 69% were metastatic melanoma, 14% were new primary NSCLC and 5% were recurrent metastatic non-melanoma cancer. Multivariate analysis of predictive factors for melanoma metastases demonstrated ORs of 9.0 for stage III/IV disease, 3.44 for multiple nodules, 0.21 for smoking and 0.26 for previous non-melanoma cancer. Margolis et al44 retrospectively reviewed 116 patients with oesophageal cancer and found that 19% had solitary nodules and 3% had multiple nodules. Diagnosis was established in 19 of the 22 solitary pulmonary nodules (SPNs). None were metastases but 4 of 22 were lung cancer. All four cases of multiple nodules were classed as metastases without biopsy.
Summary
No studies were found that compared the features of pulmonary nodules according to the route of presentation. Thus the differences found will be influenced by selection bias and study protocol. The best evidence came from extrapolated evidence from CT screening trials where entry criteria were clearly defined. Thus the overall conclusion has to be that the route of presentation should not be an important factor in the management of pulmonary nodules.
Evidence statement
The reported prevalence of non-calcified lung nodules is higher in screening studies than in studies reporting nodules as incidental findings on non-staging CT scans, but these differences are likely to reflect selection bias and protocol differences. Evidence level 3
The reported prevalence of malignant nodules is similar in screening studies and in studies reporting nodules as incidental findings. Evidence level 3
In screening studies, the prevalence of malignant nodules varies according to the screened population. Evidence level 2+
The prevalence of malignant nodules may be higher in patients with extrapulmonary cancer, but studies are small and subject to selection bias. The relationship between the risk of nodule malignancy and the time from diagnosis of the primary tumour is not known owing to inconsistent reporting of this variable. Evidence level 3
In patients with known extrapulmonary cancer there is conflicting evidence as to whether the primary site predicts whether the lung nodule is malignant or whether it is a metastasis or lung primary. Evidence level 3
There is limited evidence relating to the aetiology of coexistent lung nodules in patients with known primary lung cancer. The reported prevalence of malignancy in sub-12 mm coexistent nodules in patients selected to undergo curative surgery is 3–11%. Evidence level 3
Recommendations
Use the same diagnostic approach for nodules detected incidentally as those detected through screening. Grade D
Consider using the presence of previous malignancy as a factor in the risk assessment for further investigation. Grade D
Do not prioritise management of pulmonary nodules according to the route of presentation. Grade D
Evaluate coexistent lung nodules detected in patients with known lung cancer otherwise suitable for radical treatment in their own right; these nodules should not be assumed to be malignant. Grade D
Initial assessment of the probability of malignancy in pulmonary nodules
Key question: What clinical and radiological factors contribute to the initial risk assessment for malignancy?
Management strategies can be guided by an accurate assessment of the risk of a nodule being malignant with the lowest risk favouring the least invasive approach and vice versa. This section relates to individual nodule risk assessment rather than population risk.
Evidence review
Thirty studies were identified that evaluated clinical and radiological characteristics of nodules in relation to probability of malignancy.4 ,36–39 ,43 ,45–68 Twenty-eight were retrospective case series, one was a screening study and one was based on a retrospective literature review. Eleven studies included patients with multiple pulmonary nodules.36–39 ,43 ,46 ,48 ,53 ,60 ,66 ,68 Only one study was conducted and validated in a UK population.68 Six studies included patients with known extrapulmonary cancer.36–39 43 68
The studies can be grouped into four categories:
Studies that evaluated clinical and radiological characteristics and/or described prediction models (n=18).
Studies that externally validated prediction models from category 1 (n=5).
Studies that compared prediction models with clinical judgement (n=2).
Studies that evaluated predictors of metastases versus primary lung cancer (n=5).
Studies that evaluated clinical and radiological characteristics and/or described prediction models
These studies had a wide range of inclusion criteria, differing demographic profiles, different criteria for labelling nodules as benign or malignant, and a wide variation in the prevalence of malignancy (1.8–75%).4 ,37 ,45–48 ,50 ,53 ,54 ,56–61 ,64–66 Overall these studies identified:
Eight clinical predictors of malignancy: age, current or ever smokers, time since quitting smoking, pack-years, family history of lung cancer, history of cancer >5 years before nodule detection, any history of previous cancer and haemoptysis.
Thirteen radiological predictors of malignancy: diameter, distance from pleura >10 mm, spiculation, ground-glass appearance, pleural indentation, vascular convergence, circumference diameter ratio, upper lobe location, volume, growth, air bronchogram, lymphadenopathy and cavity wall thickness.
Five radiological predictors for benign aetiology: calcification, smooth border, cavitation, satellite lesions and perifissural location.
Two biochemical predictors of malignancy (C reactive protein (CRP) and carcinoembryonic antigen (CEA))
Of these, nine predictors of malignancy (four clinical and five radiological) were identified consistently in two or more studies which reported multivariate analysis:
Age (OR=1.04–2.2 for every 10-year increment)
Current or former smoking status (OR=2.2–7.9)
Pack-years of smoking
Previous history of extrapulmonary cancer
Nodule diameter (OR approximately 1.1 for each 1 mm increment)
Spiculation (OR=2.1–5.7)
Upper lobe location
Pleural indentation
Volume doubling time <400 days.
Predictors of a benign aetiology included presence of a diffuse, central, laminated or popcorn pattern of calcification (OR=0.07–0.20) and perifissural location.
de Hoop et al45 specifically assessed perifissural nodules (PFNs) detected on CT screening in the NELSON study. These are homogeneous solid nodules, attached to a fissure with a lentiform or triangular shape and may be subpleural (figure 8). Seven hundred and ninety-four of the 4026 nodules (19.7%) detected at baseline screening were classified as PFNs, and were followed up according to the standard protocol. At first follow-up 66 PFNs (8.3% of all PFNs) grew with a volume doubling time (VDT) <400 days. One was resected and was proved to be a lymph node. None of the other PFNs turned out to be malignant after 5 years of follow-up. In a similar retrospective review, Ahn et al47 found 234 PFNs (28% of all non-calcified nodules) in 98 subjects participating in a CT screening study. None of the PFNs developed into cancer during the study 2-year follow-up period, or during 7½ years of follow-up thereafter. PFNs are thought to be intrapulmonary lymph nodes on the basis of their CT features and histological correlates. Four studies examined histologically confirmed intrapulmonary lymph nodes (n=38, 19, 18 and 11, respectively) and characterised their CT features.69–72 In all these studies and that of de Hoop, the nodules were relatively small (<10 mm). Caution may be required in larger PFNs (>10 mm) in the presence of known non-lung primary cancers as there is anecdotal evidence of malignancy in these nodules.

Appearance of perifissural nodules (PFN) as defined in de Hoop et al. (Reproduced with permission.)
Gurney (Bayesian method)50 performed a retrospective literature review and applied the odds-likelihood ratio form of the Bayes theorem to calculate the probability of a nodule being benign or malignant. Only studies that included >100 patients were analysed but there was a wide variation in average nodule size and prevalence of malignancy, and studies were subject to methodological bias. A total of 15 malignant and 19 benign findings were identified for nodules. The most important predictors of malignancy were spiculation, diameter and cavity wall thickness, while predictors of a benign aetiology were VDT >465 days and calcification.
Five studies derived composite prediction models based on a combination of clinical and radiological factors using multivariate logistic regression analysis:
Swensen et al64 (Mayo Clinic model) evaluated, at a single centre in the USA, the probability of malignancy in 419 radiologically indeterminate SPNs that measured between 4 and 30 mm in diameter on CXR. Patients with a diagnosis of cancer within 5 years before the discovery of the nodule, and any history of lung cancer were excluded. Mean age of the patients was 62 years, 51% were male and 67% were current or past smokers. Sixty-five per cent of nodules were benign, 23% malignant and 12% were indeterminate. Three clinical characteristics (age, smoking status and history of cancer more than 5 years previously) and three radiological characteristics (diameter, spiculation and upper lobe location) were independent predictors of malignancy. The area under the receiver operating characteristic (ROC) curve (±SE) for the prediction model was 0.83 (±0.02). The model was validated on data from a separate group of 210 patients. The area under the ROC curve (±SE) for the validation set was 0.80 (±0.03). Calibration curves for the derivation and validation sets showed a good agreement between the predicted probability and the observed frequency of malignant SPNs.
Gould et al49 (Veterans Administration (VA) model) studied 375 patients enrolled from multiple centres in USA with SPNs measuring between 7 and 30 mm on CXR. Patients with a history of cancer, including lung cancer within 5 years were included but the authors were unable to identify patients who had a history of cancer more than 5 years before nodule detection. Mean (±SD) age of the patients was 65.9 (±10.7) years, 98% were male and 94% were current smokers or former smokers. Fifty-four per cent of SPNs were malignant and 46% benign. Independent predictors of malignant SPNs included a positive smoking history (OR=7.9; 95% CI 2.6 to 23.6), older age (OR=2.2 per 10-year increment; 95% CI 1.7 to 2.8), larger nodule diameter (OR=1.1 per 1 mm increment; 95% CI 1.1 to 1.2) and time since quitting smoking (OR=0.6 per 10-year increment; 95% CI 0.5 to 0.7). The area under the ROC curve (±SE) was 0.79 (±0.05) and the model was well calibrated.
Li et al59 studied 371 surgically resected SPNs ≤30 mm in diameter at a single centre in China. Median patient age was 57.1 years, 53% were male and 42% had a history of smoking. Patients with a diagnosis of cancer within 5 years before the discovery of the nodule were excluded. Fifty-three per cent of the nodules were malignant and 46% were benign. Independent predictors of malignancy included age (OR=1.07; 95% CI 1.05 to 1.09), diameter (OR=1.96; 95% CI 1.38 to 2.60), clear border (OR=0.25; 95% CI 0.13 to 0.45), calcification (OR=0.20; 95% CI 0.07 to 0.59), spiculation (OR=2.09; 95% CI 1.06 to 4.14) and family history of cancer (OR=3.55; 95% CI 1.26 to 9.97). The area under the ROC curve for the model (0.89; 95% CI, 0.78 to 0.99) was higher than those derived by Swensen et al and Gould et al. Although a history of smoking was a significant predictor of malignancy on univariate analysis, this was not significant on multivariate analysis. The authors hypothesised that this might have been owing to the high prevalence of adenocarcinoma in their population (67% of all malignant SPNs were adenocarcinomas). Data from an additional 62 patients were used to validate this model but the authors did not give any further details about ROC curves in the validation set. In addition, calibration curves were not reported for either the development or validation sets.
Yonemori et al65 studied 452 surgically resected SPNs ≤30 mm in diameter at a single centre in Japan. Mean patient age was 62 years, 55% were male and 49% had a history of current or past smoking. Any SPN diagnosed as metastatic extrapulmonary cancer was excluded. Patients with a history of cancer more than 5 years previously were included, but it was unclear if those with cancer within 5 years of nodule detection were also included. Seventy-five per cent of the nodules were malignant and 25% were benign. Independent predictors of malignancy identified were level of serum CRP, level of CEA, presence of spiculation, the CT bronchus sign (where a bronchus is seen to enter the nodule) and the absence of calcification; ORs and 95% CIs were not reported. The area under the ROC curve for the prediction model was 0.96, and 0.94 if biochemical variables (CRP and CEA) were not included. The model was validated on data from a separate group of 148 patients. The area under the ROC curve for the validation set was 0.84. CIs for the development and validation sets were not reported.
McWilliams et al46 (Brock University model) analysed data from two cohorts of participants undergoing low-dose CT screening. The development dataset included participants in the Pan-Canadian Early Detection of Lung Cancer Study (PanCan) while the validation dataset included participants involved in chemoprevention trials at the British Columbia Cancer Agency (BCCA). All participants were current or former smokers between 50 and 75 years of age without a history of lung cancer. The final outcomes of all nodules of any size that were detected on baseline low-dose CT scans were tracked. Parsimonious and fuller multivariate logistic regression models were prepared to estimate the probability of lung cancer. In the PanCan dataset, 1871 people had 7008 nodules, of which 102 were malignant, and in the BCCA dataset, 1090 people had 5021 nodules, of which 42 were malignant. Among those with nodules, the rates of cancer in the two datasets were 5.5% and 3.7%, respectively. Predictors of cancer in the model included older age, female sex, family history of lung cancer, emphysema, larger nodule size, location of the nodule in the upper lobe, PSN type, lower nodule count and spiculation. The final parsimonious and full models demonstrated areas under the ROC curve of more than 0.91 to 0.98 with good calibration, even for nodules that were ≤10 mm.
Herder et al55 performed an external validation of the Mayo clinic model and quantified the potential added value of fluorodeoxyglucose-positron emission tomography (FDG-PET) scanning in a population of patients with radiologically indeterminate pulmonary nodules. They demonstrated improved accuracy of the Mayo model by addition of a factor relating to a four-point intensity scale of FDG avidity. This model is described in greater detail in the section ‘FDG PET-CT and clinical risk prediction models’.
Studies that externally validated prediction models
Four studies externally validated the Mayo model, two validated the Bayesian method,50 two validated the VA model, and one study validated the Brock and Herder models. Three studies included patients referred for PET scan, and one included patients who had surgically resected nodules. The prevalence of malignancy varied from 40.6% to 73%. The area under the ROC curve (AUC) results for the Mayo model were 0.79–0.90, for the VA model 0.73 to 0.74 and for the Bayesian method 0.80 (one study did not quote the AUC for the Bayesian method).
Dewan et al52 compared the accuracy of predicting the probability of cancer in 52 patients with SPNs using Bayesian analysis and PET. Three patients with extrapulmonary malignancy were included. PET, as a stand-alone test, was better at classifying nodules as malignant or benign than either Bayesian analysis alone or Bayesian analysis plus PET scan.
Herder et al55 validated the Mayo model in conjunction with PET scanning in 106 patients referred for PET evaluation of an indeterminate lung nodule. Patients with prior malignancy within the past 5 years were excluded. The addition of PET scan findings (classified using a four-point scale) increased the AUC by 13% from 0.79 to 0.92.
Schultz et al62 compared the Mayo and VA models in 151 patients undergoing PET evaluation of lung nodules (maximum one on CXR and six on CT). The area under the ROC curve for the Mayo Clinic model (0.80; 95% CI 0.72 to 0.88) was higher than that of the VA model (0.73; 95% CI 0.64 to 0.82), but this difference was not statistically significant. Calibration curves showed that the Mayo model underestimated, while the VA model overestimated, the probability of malignancy.
Isbell et al67 evaluated the Mayo and Bayesian models in patients with pulmonary nodules referred for surgical resection. Area under the ROC curve was 0.78 (95% CI 0.70 to 0.85) for the Mayo model, and 0.80 (95% CI 0.73 to 0.87) for the Bayesian model. The Mayo model was well calibrated for the two highest quintiles of probabilities but underestimated the probability of malignancy for the lower quintiles. The Bayesian model underestimated probability for the lower quintiles and overestimated for the higher quintiles.
Al-Ameri et al68 compared the performance of four prediction models (Mayo, VA, Brock University and the model described by Herder et al) in a cohort of 244 patients with pulmonary nodules detected in routine clinical practice in a UK teaching hospital. Of the three CT based scores, the Mayo and Brock models performed similarly, and both were significantly more accurate than the VA model. The AUCs were 0.89 (95% CI 0.85 to 0.94) for the Mayo model, 0.90 (95% CI 0.86 to 0.95) for the Brock model, and 0.74 (95% CI 0.67 to 0.80) for the VA model. In patients undergoing FDG PET-CT, the Herder model had significantly higher accuracy than the other three models (AUC 0.92; 95% CI 0.87 to 0.97). When analysis was extended to include patients outside the original described inclusion criteria for each model, the accuracy remained high, especially for the Herder score (AUC 0.92). For subcentimetre nodules, AUC values for Mayo and Brock models were 0.79 (95% CI 0.63 to 0.95) and 0.85 (95% CI 0.77 to 0.94), respectively.
Studies that compared prediction models with clinical judgement
Swensen et al63 compared four physicians’ clinical judgements with the Mayo model in 100 patients with indeterminate pulmonary nodules. Although ROC analysis showed no statistically significant difference between the two, calibration curves revealed that physicians overestimated the probability of malignancy in patients with a low risk of malignant disease. Gurney compared the accuracy of four expert radiologists using clinical judgement with two other radiologists using Bayesian analysis in 66 patients with pulmonary nodules.51 The latter performed significantly better than the former (p<0.05) and misclassified fewer malignant nodules as benign.
Studies that specifically evaluated predictors of metastases versus primary lung cancer
A number of case series have examined the prevalence of malignant nodules in patients with known extrapulmonary cancer—these are described in the section on route of detection of pulmonary nodules.36–44 Because of their heterogeneous nature, these studies provide conflicting evidence as to whether the primary site predicts whether the lung nodule is malignant or whether it is a metastasis or lung primary.
Patients with multiple pulmonary nodules
The Brock model is the only multivariate model that included an analysis of multiple pulmonary nodules.46 In this model the presence of multiple nodules had a small negative effect on the likelihood of malignancy in any one nodule. The remaining studies were small case series48 ,53 ,60 ,66 which did not report multivariable analysis, and were based on specific patient populations which can broadly be divided into three groups:
Immunosuppressed patients including those with AIDS and post-transplant settings.
Nodules in patients with suspected or proven pulmonary infections (eg, TB, histoplasmosis and other fungal diseases).
Nodules in the setting of known diffuse parenchymal disease.
In the NELSON trial the nodule management algorithm was determined according to the largest nodule when more than one nodule was present. This is the best evidence for the effectiveness of this approach.29
Limitations and choice of predictive models
The accuracy and clinical utility of predictive models depend on the case mix of the population in which it was derived and the prevalence of malignancy in that population. The applicability of the predictors identified will depend on the methods used to identify the events (ie, nodules) and the method of evaluation (essentially CT or CXR). The clinical characteristics and results of the studies that developed predictive models are summarised in table 7.
Summary of studies that developed composite prediction models
The Mayo model was developed in a cohort of patients with lung nodules who were originally managed in the 1980s at a single tertiary care centre in the USA.64 The investigators excluded patients with a history of lung cancer or a history of extrathoracic cancer within 5 years, and 12% of the patients did not have a final diagnosis. The VA model did include patients with a history of lung cancer or a history of extrathoracic cancer within 5 years but evaluated a relatively smaller number of clinical predictors.49 The population in the VA model comprised mainly older male smokers, and nodule size range was 7–30 mm, hence the accuracy of this model is unknown in nodules that are smaller than 7 mm in diameter.
Herder et al55 validated the Mayo model in 106 patients referred for PET evaluation of an indeterminate lung nodule. Patients with prior malignancy within the past 5 years were excluded. The addition of PET scans findings (classified using a four-point scale) increased the AUC by 13% from 0.79 to 0.92. In a non-screening population, this score demonstrates the highest accuracy.
The Brock model has the highest AUC but was based on a screening population.46 All participants were current or former smokers, hence smoking status was not included as a variable in the final predictive models. In addition, this model did not incorporate PET scan findings as an additional predictive variable. The prevalence of malignancy (5.5% in the PanCan cohort, and 3.7% in the BCCA cohort) was significantly lower than that reported by Swensen (23%), Gould (54%) and Herder (57%).
Figure 9 shows how the various models compare for a 70-year-old man with a spiculated upper lobe nodule according to nodule diameter. The models perform very differently across the whole range of diameters. The Brock model shows a much lower probability of malignancy for smaller nodules and is the only model with a large number of smaller nodules in the derivation population. Despite being developed in an exclusively smoking or ex-smoking population, the likelihood of malignancy using the Brock tool is consistently below the likelihood of the Mayo tool even when the latter was calculated for a non-smoking patient.

Predicted probability of malignancy according to nodule size in a 70-year-old man (spiculate nodule in upper lobe). VA, Veterans Administration.
The validation study by Al-Ameri et al68 is the only study to validate the Brock and Herder models, and the only analysis of the performance of any models in a UK population. In patients undergoing FDG PET-CT, the Herder model was clearly the most accurate in predicting malignant risk, even when used in a cohort not restricted by the inclusion criteria of the model (ie, including patients with a previous history of lung cancer or an extra-thoracic cancer within the past 5 years). For smaller subcentimetre nodules, the highest accuracy was seen for the Brock score.
Patients with smaller pulmonary nodules
A consistent finding from the studies considered in the section ‘Risk prediction models’ is the strong effect of size on predicting malignancy in a nodule. However, as discussed above, the prediction tools vary considerably in their estimates of malignant risk for very small nodules. Thus a non-spiculated 4 mm upper lobe nodule in a 70-year-old smoking woman has a malignant probability of 0.3% according to the Brock model, 11.9% according to the Mayo model and 39.1% according to the VA model.
The largest body of data relating to small nodules comes from the CT screening studies. Both NLST and NELSON studies have published rates of malignancy by nodule size alone in screened populations.
In a report of the initial CT findings (prevalence screen) from 26 309 patients randomised to the CT screening arm of NLST, 3668 patients were found to have a nodule of between 4 and 6 mm in diameter, of which only 18 were subsequently confirmed as lung cancer (positive predictive value (PPV) 0.5%; 95% CI 0.3% to 0.7%).19 In a subsequent report, Aberle et al73 described the results of the two incidence screenings in NLST. Of 24 715 patients undergoing low-dose CT at the first incidence screening round, 3822 were found to have a nodule of 4–6 mm in diameter, of which 12 were subsequently confirmed as lung cancer (PPV 0.3%; 95% CI 0.2% to 0.5%). Of 24 102 patients undergoing low-dose CT at the second incidence screen, 2023 were found to have a nodule of 4–6 mm in diameter, of which 15 were subsequently confirmed as lung cancer (PPV 0.7%; 95% CI 0.4% to 1.1%).
Horeweg et al74 reported results from 7155 Dutch participants in the NELSON study who underwent CT in the first or second rounds. The risk of developing lung cancer over a 2-year period was quantified for ranges of nodule size (volume/diameter) and VDT. Lung cancer probabilities were calculated using both screen-detected lung cancers, and interval cancers identified through linkages to the Dutch Cancer Registry. Over two rounds of screening, 6394 nodules were detected on 14 024 scans. The 2-year lung cancer probability was 1.3% for all participants (95% CI 1.2% to 1.5%). Participants without any pulmonary nodule (54.4%) had a lung cancer probability of 0.4% (95% CI 0.3% to 0.6%).
Patients with a nodule with a volume of ≥100 mm3 had a significantly higher chance of being diagnosed with lung cancer than those patients without nodules. However, there was no difference in risk of lung cancer between patients with smaller nodules (<100 mm3) and patients with no nodules. Similar findings were shown by nodule diameter, with the smallest nodule size associated with a significantly increased risk compared with patients with no nodules being 5–6 mm (PPV 0.9%; 95% CI 0.5% to 1.6%, p=0.03). Patients with smaller nodules (<5 mm diameter) had no increased risk compared with patients with no nodules. By subdividing the population by nodule volume and diameter, and comparing risk with that in patients without nodules, Horeweg et al74 were able to define an appropriate size cut-off point for discharging small nodules without any follow-up. They concluded that nodules <5 mm in diameter or <100 mm3 volume do not require any CT surveillance, as they are not associated with a significantly increased risk of lung cancer. However, two other studies have reported variation in absolute volume measurement between volumetric software packages.75 ,76 Therefore, until there is better agreement confirmed between packages it might be safer to reduce the threshold to 80 mm3. Subjects entered into screening trials have a greater baseline risk of malignancy than the general population but these findings probably apply to lower risk populations as well since the nodules below the stated size and volume cut-off point conferred no extra risk of malignancy and may therefore confer no extra risk irrespective of baseline risk. Horeweg et al also found that the chance of developing lung cancer after two screening rounds was 2.4% for nodules between 100 and <300 mm3 in volume and 16.9% for nodules ≥300 mm3. The corresponding chance of lung cancer for a diameter of 5 to <8 mm was 1.0% and for ≥8 mm, 9.7%. Thus it might be argued that at least for nodules <300 mm3 or <8 mm diameter, where PET-CT is less valuable (see section ‘Further imaging in management of pulmonary nodules’), CT follow-up is indicated without further risk assessment.
The sample size contributing to these estimates is considerably larger than those used to produce the risk prediction tools described above. The higher risks assigned to these small nodules from the Mayo and VA models are likely to be erroneous in this context, and so the Brock model is preferred.
Summary
There have been several validated risk prediction models developed to assist in the management of pulmonary nodules. Earlier risk models have been improved considerably by the addition of PET findings while new models based on larger datasets and using more modern imaging have generated more reliable data to inform the recommendations on risk prediction and subsequent management (see also algorithm 1, initial assessment). The best evidence to guide recommendations comes from CT screening trials that selected subjects at relatively high risk of lung cancer.
Evidence statement
Clinical predictors of lung cancer in patients presenting with pulmonary nodules include:
increasing age
history of smoking
number of pack years smoked. Evidence level 2+
Radiological (CT) predictors of lung cancer in patients presenting with pulmonary nodules include:
increasing nodule diameter
spiculation
pleural indentation
upper lobe location. Evidence level 2+
Nodules with diffuse, central, laminated or popcorn pattern of calcification or macroscopic fat can be considered benign. Evidence level 2+
A homogeneous, smooth, solid nodule with a lentiform or triangular shape either within 1 cm of a fissure (perifissural) or the pleural surface (subpleural) can be considered benign. Evidence level 2+
In the NLST and NELSON, the prevalence of lung cancer among patients with 4–6 mm nodules was 0.5% and in NELSON, malignancy risk was no different from the subjects without nodules where nodules measured <5 mm or <100 mm3, with better accuracy for volume measurements. Evidence level 2+
There is variation between different volumetry software packages such that the threshold of 100 mm3 found in NELSON could be as low as 80 mm3 depending on the software. Evidence level 3
In NELSON, the risk of lung cancer among nodules of 100 mm3 to <300 mm3 and 5 to <8 mm diameter was found to be 2.4% and 1.0%, respectively. Evidence level 2+
Prediction models for pulmonary nodules based on clinical and radiological parameters have been externally validated. In the only validation study performed in a UK population, the Herder model (incorporating nodule FDG avidity) performed significantly better than other models (Mayo, Brock, Veterans Administration). In subcentimetre nodules, the Brock score had the highest accuracy (AUC value). Evidence level 2+
The use of clinical prediction models is more accurate than clinicians’ individual clinical judgement in estimating the probability of malignancy in patients with pulmonary nodules. Evidence level 3
In patients with known extrapulmonary cancer who have pulmonary nodules at presentation, there is limited evidence for the role of clinical and radiological factors in differentiating nodules that are primary lung cancer or metastases. Evidence level 3
There is limited evidence outside the screening population for determining aetiology and management in patients with multiple pulmonary nodules. Evidence level 3 supported by 2+
In a screening population the presence of multiple pulmonary nodules was found to indicate a lower risk of malignancy. Evidence level 2+
In the NELSON screening trial, effective management of subjects with multiple nodules was achieved as determined by the management of the largest nodule. Evidence level 2+
Recommendations
Do not offer follow-up or further investigation for people with nodules with diffuse, central, laminated or popcorn pattern of calcification or macroscopic fat. Grade C
Do not offer nodule follow-up or further investigation for people with perifissural or subpleural nodules (homogeneous, smooth, solid nodules with a lentiform or triangular shape either within 1 cm of a fissure or the pleural surface and <10 mm). Grade C
Consider follow-up of larger intrapulmonary lymph nodes, especially in the presence of a known extrapulmonary primary cancer. Grade D
Do not offer nodule follow-up for people with nodules <5 mm in maximum diameter or <80 mm3 volume. Grade C
Offer CT surveillance to people with nodules ≥5 mm to <8 mm maximum diameter or ≥80 mm3 to <300 mm3 volume. Grade C
Use composite prediction models based on clinical and radiological factors to estimate the probability that a pulmonary nodule (≥8 mm or ≥300 mm3) is malignant. Grade C
Use the Brock model (full, with spiculation) for initial risk assessment of pulmonary nodules (≥8 mm or ≥300 mm3) at presentation in people aged ≥50 or who are smokers or former smokers. Grade C
Consider the Brock model (full, with spiculation) for initial risk assessment of pulmonary nodules (≥8 mm or ≥300 mm3) in all patients at presentation. Grade D
Base the risk assessment of people with multiple pulmonary nodules on that of the largest nodule. Grade C
Nodule malignancy risk prediction models should be validated in patients with known extrapulmonary cancer. RR
Further analysis of variation in volumetry measurements by different software packages should be undertaken and methods developed for standardisation. RR
Imaging follow-up
Key question: In what situations is CT surveillance appropriate and how should this happen and be assessed?
After assessment of the risk of malignancy on the basis of clinical and initial radiological characteristics, some people will have pulmonary nodules with a low risk of malignancy and will therefore be suitable for CT surveillance rather than further imaging or biopsy. The overall aim of this approach is to use assessment of nodule growth to discriminate between benign and malignant nodules. Technical considerations regarding the measurement of nodule size and the threshold for determining change in size are given in section ‘Technical aspects of the imaging of pulmonary nodules’. Here the GDG considered the timing of surveillance CT scans to assess growth, and the range of growth rates considered predictive of malignant or benign disease.
Evidence review
How should nodule change be assessed?
Pulmonary nodule size has traditionally been assessed by measuring the largest transverse cross-sectional diameter. The VDT of a nodule can then be estimated from the difference in nodule diameter between baseline and follow-up CT and the time interval between these two scans, using a simple exponential growth model that assumes uniform three-dimensional (3D) tumour growth. Within the past 15 years, volumetric analysis (calculated either manually or by a semiautomated/automated method) has been increasingly reported as an alternative tool with which to assess nodule growth.
In a retrospective case series, Revel et al77 assessed variability in 2D CT measurements of 54 pulmonary nodules in 24 patients both between readers and in the same reader's measurements at different times. Both intra- and inter-reader agreement for 2D measurements were found to be poor, with a change in size of <1.7 mm only having a 5% chance of corresponding to an actual change in nodule size. Korst et al78 compared automated 3D volumetric estimates of pulmonary nodule growth rate with those derived from 2D measurement of nodule diameter in a retrospective case series of 87 nodules in 69 patients seen in a routine review clinic. Although correlation overall between these measurements was good, greater divergence was seen between these two methods for irregular nodules, or where the time interval between scans was shorter (<100 days). Of the cases where volumetric analysis would have changed management and prompted a biopsy (6.2% of all cases), 43% of nodules had an eventual malignant diagnosis.
Ko et al79 compared semiautomated 3D volumetric analysis against standard calliper cross-sectional diameter measurement of 123 lung nodules in a retrospective analysis of 59 patients recruited through a CT lung cancer screening programme. Abnormal growth was detected in nodules subsequently proved to be malignant at a much shorter time interval (183±158 days) by 3D volumetry than by standard radiological diagnosis (344±284 days), suggesting greater sensitivity of the volumetric technique. Similarly, Revel et al80 compared automated 3D volumetric analysis against 2D calliper measurement of 63 solid lung nodules in a retrospective case series. The sensitivity for volumetric-calculated doubling time for malignancy (with a 2-month median interval for rescan) was 91% (95% CI 0.59 to 1.00) compared with a sensitivity of manual diameter-change measurement of 54% (95% CI 0.23 to 0.83).
In addition to growth in the size of a nodule, changes in other parameters have been evaluated. de Hoop et al81 retrospectively compared diameter, volume and mass measurements of 52 GGNs detected in a lung cancer screening trial. Of the three parameters, mass measurements showed the least intra- and interobserver variation. Furthermore, in a subgroup of 13 malignant GGNs subsequently resected, changes in mass were seen significantly earlier than changes in volume or diameter (mean time 425, 673 and 713 days, respectively, p=0.02).
Xu et al82 retrospectively analysed 372 indeterminate solid intraparenchymal nodules in 312 patients recruited to the NELSON lung cancer screening trial. Although baseline density did not differ between nodules with an eventual benign or malignant diagnosis, malignant nodules showed a statistically significant increase in density during CT follow-up compared with benign nodules (median change 12.8 Hounsfield units (HU) vs −0.1 HU, respectively, p<0.05). However, there was significant overlap in density changes between benign and malignant nodules, indicating that density change alone is unlikely to be sufficiently specific or sensitive to accurately identify malignant nodules.
What is the appropriate time interval between surveillance scans?
In seeking to discriminate between benign and malignant nodule growth patterns, CT surveillance aims to have a high sensitivity for detecting nodule growth consistent with malignancy at the earliest opportunity, while maintaining high specificity and minimising false-positive referrals (nodules deemed to have grown but which have a subsequent benign diagnosis). The optimal interval between surveillance scans will relate to the reliability of detecting percentage volume change taking into account artefact, and the doubling time threshold between growing and stable nodules.
In a retrospective analysis of patients recruited to a lung cancer screening programme, Kostis et al83 reviewed 115 pulmonary nodules deemed stable over 2 years’ observation. They assessed error in 3D volumetric assessment of nodule size due to artefact and other factors, to determine whether apparent growth might simply reflect measurement errors in stable nodules. They then derived the critical time to follow-up CT—that is, the earliest point at which growth in a nodule of a given size can be reliably identified with repeat CT. As expected, the percentage SD of nodule size estimate increased with decreasing nodule size. The critical time to follow-up CT was calculated as 12 months for nodules with initial diameter 2–5 mm, 5 months for nodules 5–8 mm and 3 months for nodules 8–10 mm.
Although detecting nodule growth at the earliest opportunity is preferable enabling prompt treatment to be offered, there is evidence that the accuracy of growth rate measurement and assessment of malignant risk improves with a greater time interval between surveillance scans. Thus Ko et al79 demonstrated a reduction in SD of growth rate estimate with increasing time between scans (SD of 47% at 6 months, 30% at 1 year and 20% at 2 years).
Xu et al84 retrospectively evaluated 891 indeterminate nodules detected during the NELSON CT screening trial. VDT was assessed at 3-month and 12-month interval scans, and nodules with a VDT of <400 days at either time point were referred for further investigation. Overall, 78 nodules were referred owing to a VDT of <400 days—68 nodules at 3 months and 10 at 12 months. The proportions of nodules with an eventual malignant diagnosis referred at 3 months and 12 months were 15% and 50%, respectively, indicating greater specificity for assessment of malignant risk at the later time point.
Zhao et al85 retrospectively reviewed characteristics of resolving pulmonary nodules detected at initial scan in a CT screening programme. Of a total of 964 indeterminate nodules initially detected, 10.1% (97) disappeared at subsequent screening. The majority of resolving nodules (75/97 (77%)) had disappeared by 3 months. Features predicting resolution were non-peripheral location, spiculation and larger nodule size (≥8 mm vs <8 mm). The last two factors are also predictors of malignancy, therefore limiting the extent to which baseline features can be used to predict which nodules will subsequently resolve.
What growth rates are reported for malignant pulmonary nodules?
A number of studies describing VDTs for malignant pulmonary nodules were reviewed. Considering only studies with 50 or more cases, five reports of doubling times for nodules subsequently confirmed as lung cancer were identified and details of their findings are shown in table 8. Two studies retrospectively reviewed growth rates of lung cancers detected in routine clinical practice86 ,87 and three studies reviewed cancers detected by CT screening.88–90 Of the studies reviewed, two used 2D diameter assessment of size only, two used manual volumetric analysis and one used automated/semiautomated volumetric analysis.
Reported growth rates of pulmonary nodules subsequently diagnosed as lung cancer cases on previous surveillance CT
All studies showed a wide range of growth rates for lung cancers. VDTs were reported by histological subtype of tumour and the mean/median values are shown in table 9. Direct comparison of these studies is limited by differences in the methods of volume estimation (2D diameter measurement vs manual or automated 3D volumetry), histological definitions (two studies grouped adenocarcinomas and bronchoalveolar cell carcinoma (BAC)/AIS together) and presentation of data (parametric or non-parametric variables). Despite these limitations, consistent patterns were seen between histological subtypes with progressively longer VDTs quoted for small cell carcinoma, squamous cell carcinoma, adenocarcinoma, BAC/AIS, respectively.
Volume doubling time (VDT) according to histological subtype
Two studies88 ,89 compared VDT by radiological appearance of the nodule, and showed shorter VDTs for solid versus SSNs or pGGNs. In one of the largest series of malignant nodules, Henschke et al reported that all lung cancers detected as solid nodules in the International Early Lung Cancer Action Program (I-ELCAP) screening programme had VDTs of <400 days (n=99), whereas 3 of the 12 SSNs detected had VDTs of >400 days (413, 531, 884 days).89
The upper limit of VDT for malignant nodules was high in some series owing to the presence of very slow growing nodules that turned out to be lung cancers: 884, 1435 and 1733 days.88–90 Cancers with long VDTs tended to present as SSNs and were associated with BAC/AIS on eventual histology. In two studies, regression on nodules subsequently diagnosed as cancer was described (leading to negative VDTs).
What is an appropriate cut-off point for nodule growth rate to allow discrimination of benign and malignant nodules?
The presence of extremely long VDTs for some lung cancers, and the observation that a proportion of malignant nodules reduce in size on interval screening, indicates that there is no upper limit of VDT above which nodules can be guaranteed to be benign. Similarly, the observation that some malignant nodules show a long period of radiological stability before growing means that it is not possible to define a period of surveillance during which stability will completely exclude the possibility of malignancy. Current practice is guided by recommendations from the Fleishner Society which recommend follow-up for either 12 or 24 months depending on initial nodule size and patient risk.91 Stability over 2 years of follow-up has traditionally been regarded as indicative of benign disease, having first been proposed on the basis of CXR follow-up of nodules in the 1950s,92 although the evidence underlying this assumption has been questioned.93
Although some cancers grow very slowly, or grow after a prolonged period of stability, it is not practical to follow up every nodule indefinitely for fear of missing an occasional cancer. Studies reporting growth rate of lung cancers will obviously consider only nodules with an eventual malignant diagnosis and are therefore all retrospective in nature. These data do not facilitate a prospective assessment of risk in any given pulmonary nodule with a known growth rate. Instead, studies of populations of all nodules (both benign and malignant) by growth rate are of more use in providing clinicians and patients with accurate information on malignant risk on which to base decisions about management and follow-up.
Ashraf et al94 reported a series of 54 indeterminate pulmonary nodules identified through the Danish Lung Cancer Screening Trial. They classified nodules according to VDT derived by automated 3D volumetric analysis on repeat CT scanning at 3 months, and FDG avidity of nodules at PET-CT. Nodules were grouped into those with a VDT <1 year, and those with a VDT >1 year or regressing. Seventeen nodules had a VDT <1 year (31% of total group), of which 14 were malignant (82%). Six of the remaining 37 nodules which either regressed or had a VDT >1 year were malignant (16%). The VDTs of these slow-growing malignant nodules were not reported. The VDT estimates were made on the basis of a 3-month interval scan. As discussed above, there appears to be greater error in VDT estimates made at 3 months compared with 12 months, and it is unclear to what extent this affected the sensitivity of 3-month VDT assessment for detecting malignant nodules.79 ,84 ,95
By far the largest series of pulmonary nodules followed up by volumetric analysis comes from the NELSON study. The trial used VDT (calculated by automated volumetric analysis after a 3-month or 12-month interval) to guide management of indeterminate pulmonary nodules (50–500 mm3) so that patients with nodules with a VDT of <400 days were referred to a chest physician for investigation and diagnosis, whereas those with nodules with a VDT >400 days were considered benign and re-entered the screening programme.96 At least a 25% change in volume was required to indicate a significant change.97 It should be noted that where the automated software was unable to calculate volume, VDT was measured by manually measuring maximum diameter in three perpendicular planes. Thus any conclusions about follow-up periods relying on diameter measurements can only apply when VDT is calculated using this method.
Horeweg et al74 reported the follow-up of 2500 nodules where VDT was calculated. As discussed in the section ‘Patients with smaller pulmonary nodules’, the 2-year lung cancer probability was 1.3% for all participants (95% CI 1.2% to 1.5%) in the screening programme, whereas participants without any pulmonary nodules (54.4%) had a 2-year lung cancer probability of 0.4% (95% CI 0.3% to 0.6%). Participants with slowly growing nodules (VDT >600 days), stable, shrunken or resolved nodules had a low probability of lung cancer (0.0–1.0%). Lung cancer probability was not significantly increased for participants with nodule VDTs of ≥600 days (0.8%; 95% CI 0.4% to 1.7%) compared with participants without nodules (p=0.06). Lung cancer probability was significantly increased for participants with nodule VDTs of 400–600 days (4.0%; 95% CI 1.8% to 8.3%, p<0.0001) and was even higher in participants with nodule VDTs of ≤400 days (9.9%; 95% CI 6.9% to 14.1%, p<0.0001). Analysis was not presented by nodule morphology (solid vs sub-solid, etc).
Although there is a trend to increased cancer risk in patients with slowly growing nodules (with VDT >600 days), the risk of malignancy in this situation is very small (0.8%). In considering more aggressive management in this situation, this risk must be considered alongside the operative mortality of thoracoscopic wedge resection (0.4% inpatient mortality according to the Society for Cardiothoracic Surgery in Great Britain and Ireland, with possible higher 90-day mortality) (www.bluebook.scts.org).
The NELSON trial is the only screening study to date to have prospectively assessed growth using automated volumetry in a defined protocol. Thus despite this being a single publication, it is unlikely that any future studies will be able to provide this level of prospective data for such a large number of patients with pulmonary nodules.
There is little evidence for the management of new nodules that appear in follow-up CTs. Here, the risk of malignancy will depend on the growth rate and it should be noted that rapid growth may imply an inflammatory process rather than malignancy.
Summary
A repeat CT at 3 months will reliably detect growth in larger nodules, and will also demonstrate resolution in the majority of resolving nodules. Automated or semiautomated volumetry is more accurate than diameter measurements and accuracy of VDT assessment is better after 1 year than 3 months, especially for small nodules (<6 mm). Some lung cancers have very long VDTs, show prolonged periods of stability or even reduce in size on interval screening so that there is no upper limit of VDT above which nodules can be guaranteed to be benign. The approach to this problem, as recently suggested in a NELSON publication, may be to compare the risk of malignancy with that of the baseline risk of malignancy to define a point where follow-up is no longer indicated, given the absence of national screening programmes. A consistent finding in the studies quoted above is the slow rate of growth for SSNs, and therefore recommendations for duration of follow-up are distinct for this subgroup and are considered in the next section of the guideline. The evidence quoted for assessment of VDT and duration of follow-up relates to assessment of the risk of lung cancer. There is no published evidence informing assessment of the likelihood of lung metastasis from extrapulmonary malignancy according to VDT, and no evidence to guide appropriate duration of surveillance follow-up to exclude malignancy in this setting.
Evidence statement
Repeat CT scans to assess interval growth have greater sensitivity and specificity for detecting malignancy at 1 year than scans at earlier time points. Evidence level 2+
The majority of pulmonary nodules that eventually resolve have done so after a 3-month interval. Evidence level 3
Accuracy of growth detection at 3 months reduces with smaller nodule size. Evidence level 3
The growth rate of malignant nodules differs by histological subtypes and CT morphology. Small cell and squamous cell carcinomas tend to have shorter VDTs than adenocarcinoma. Evidence level 3
Malignant nodules show wide ranges of growth rates, with some demonstrating regression at times. There is therefore no growth rate threshold beneath which, nor duration of radiological stability beyond which, malignancy is definitely excluded. Evidence level 3
In the NELSON screening study, patients with nodules with a VDT <400 days and 400–600 days measured after a 3- or 12-month interval, had 2-year cancer probabilities of 9.7% and 4.1%, respectively, significantly greater than the cancer risk of subjects without nodules (0.4%) and the screened population as a whole (1.3%). Evidence level 2+
The same study showed that the 2-year risk of lung cancer was 0.8% when the VDT was >600 days, not significantly higher than for subjects without nodules. Evidence level 2+
In NELSON, where diameter measurements were used to calculate VDT, maximum diameter was measured in three planes. Evidence level 2+
At least a 25% change in volume is required before the change can be regarded as significant. Evidence level 2+
Duration of follow-up to ensure stability of nodules is not known for 2D diameter measurements. Evidence level 3
Recommendations
Where initial risk stratification assigns a nodule a chance of malignancy of <10%, assess growth rate using interval CT with capability for automated volumetric analysis. Grade C
Assess growth for nodules ≥80 mm3 or ≥6 mm maximum diameter by calculating VDT by repeat CT at 3 months and 1 year. Grade C
Use a ≥25% volume change to define significant growth. Grade C
Assess growth for nodules of ≥5 mm to <6 mm maximum diameter by calculating VDT by repeat CT at 1 year. Grade C
Offer further diagnostic investigation (biopsy, imaging or resection) for patients with nodules showing clear growth or a VDT of <400 days (assessed after 3 months, and 1 year). Grade C
Discharge patients with solid nodules that show stability (<25% change in volume) on CT after 1 year. Grade C
If 2D diameter measurements are used to assess growth, follow-up with CT for a total of 2 years. Grade D
Consider ongoing yearly surveillance or biopsy for people with nodules that have a VDT of 400–600 days, according to patient preference. Grade C
Consider discharge or ongoing CT surveillance for people who have nodules with a VDTs of >600 days, taking into account patient preference and clinical factors such as fitness and age. Grade C
Where nodules are detected in the context of an extrapulmonary primary cancer, consider the growth rate in the context of the primary and any treatment thereof. Grade D
Management of SSNs
Key question: What are the features of SSNs and how should these nodules be managed?
SSNs merit special consideration because evidence is emerging that they require a different management approach than that required for solid nodules and have potentially different implications for prognosis. The pathological correlates have been described in the introduction in relation to the new classification of adenocarcinoma.1 SSNs may represent preinvasive and invasive lesions and there are imaging predictors of progression to invasive disease, especially the development of a solid component (which is usually small in relation to the ground-glass component).98 However, there is some debate about how these lesions should be managed because surgical series have reported a 100% cure rate in nodules that are >50% ground glass.99–101
Evidence review
The evidence consisted of case series, some collected prospectively as part of well-designed randomised controlled trials (RCTs) of CT screening. There were 40 publications reporting 50 or more SSNs retrieved by the search protocol (19 reported on more than 100). Fifteen reported only on resected or pathologically confirmed nodules, eight on nodules detected by CT screening (including three from RCTs) and 22 on nodules detected from a mixture of populations. Most series were from eastern Asia (Korea 16, Japan 17, China 2, USA 1, Canada 1, Italy 2, Netherlands 1). The majority of studies employed thin-section CT to evaluate SSNs.
Prevalence of SSNs
The prevalence of SSNs is difficult to extract from most studies as it is not directly reported. In the PanCan dataset 1871 of 2537 subjects had nodules detected over the screening rounds, and 15.9% of nodules were pGGNs and 4.3% PSNs. In the BCCA dataset the proportions were 9.3% and 0.9%, respectively.46 If these proportions are applied to the prevalence of nodules in the much larger NLST2 (over 27 000 subjects), where the average proportion of subjects with nodules ≥4 mm was 24%, the prevalence of pGGNs detected will lie in the range 2.2–3.8% and PSNs would be found in 0.2–1% of CTs. This broadly agrees with the original report from ELCAP102 (1000 subjects), where it was found that 2.8% of baseline CTs detected pGGNs and 1.6% detected PSNs. In a review of 60 000 CTs Matsuguma et al found only 98 pGGNs (0.16%) and 76 (0.13%) PSNs103; this may reflect the different population including a higher proportion of non-smokers.
Histopathological correlates of SSNs
Only six studies were identified where consecutive cases were resected and most of these reported histology according to the previous classification of adenocarcinoma. Two more recent studies that reported on SSNs ≤20 mm diameter are shown in table 10.103 ,104 One study looked at a CT-detected series and the other resected all lesions. Amongst the resected lesions the spectrum of pathology was similar, although the overall rates of invasive carcinoma were much lower in the CT-detected series, probably reflecting selection bias in the resected series.
Histopathological correlates of SSNs (≤20 mm) reported according to the new international classification of adenocarcinoma
Proportion malignant
The best evidence for the proportion of SSNs malignant, when detected by CT, comes from the screening trials, although again most report the previous classification of adenocarcinoma. In the PanCan dataset,46 1.9% (21/1105) of pGGNs and 6.6% (20/303) of PSNs were malignant and in the BCCA the numbers were lower but the rates were 1.3% (6/467) and 22.2% (10/45), respectively.
Predictors of malignancy and growth pattern
Twenty-four studies with 50 or more cases looked at predictors of malignancy.46 ,81 ,103–124 Initial size of lesion and growth are predictive of malignancy. A previous history of lung cancer was also found to be an independent predictor in three studies.103 ,106 ,116 McWilliams et al46 were able to show that pGGNs, although more often malignant than solid nodules, actually conferred a lower chance of being malignant when adjusted for other factors in the risk prediction model. This was not the case for PSNs, where the part solid nature was an independent predictor of malignancy. Despite this, even PSNs ≤5 mm in maximum diameter, with other adverse factors added, had no more than a 1% risk of being malignant over 2–4 years for people aged <78. Two further studies noted that older age was associated with an increased risk of malignancy.113 ,114 Three studies showed that a peripheral eosinophilia was predictive of benignity.112 ,114 ,125 Morphological features predictive of malignancy, other than initial size, were pleural retraction or indentation and a bubble-like appearance in a pGGN.
Some studies evaluated the outcome of nodules that were persistent. Lee et al analysed the long-term progression of 175 SSNs that persisted for more than 2 years in 114 patients.113 The mean initial size was 7.8±4.4 mm and median follow-up duration was 45 months. Forty-six (26.3%) SSNs showed significant size increases (≥2 mm in the longest diameter) with a mean VDT of 1041 days. In a multivariate analysis, large size (≥10 mm), PSNs and old age (≥65 years) were risk factors for significant size increase, with ORs (95% CI) of 6.46 (2.69 to 15.6), 2.69 (1.11 to 6.95) and 2.55 (1.13 to 5.77), respectively. SSNs with character changes from pure to mixed or mixed to solid showed more rapid volume expansion. The authors concluded that SSNs which persisted for several years showed an indolent course but noted that larger lesions with a solid portion in male or elderly individuals may be cause for more concern. In a retrospective study of 93 individuals with 126 PSNs identified from 16 777 individuals who underwent chest CT, 69.8% of PSNs were transient. Multivariate analysis showed that young patient age, detection of the lesion at follow-up, blood eosinophilia, lesion multiplicity, ill-defined border and large solid portion (the latter OR was only 1.05) were significant independent predictors of transient PSNs.112 A further study followed up 120 SSNs (91 pGGNs) for a median of 4.2 years that had been observed without treatment for a minimum of 6 months.111 Of these SSNs 28% grew by ≥2 mm and all of these had grown by 3 years. Independent predictors of growth were smoking history (OR=6.51) and initial size >10 mm (OR=4.06).
Two studies have developed logistic regression models specifically for PSNs. One found an ROC of 0.93 for distinguishing transient from persistent SSNs; however, the model was strongly influenced by eosinophilia and lesion multiplicity.125 The other developed a model to predict invasive versus non-invasive adenocarcinoma confirmed by resection. This showed an ROC of 0.9 but was strongly influenced by whether the lesion had a spiculated margin or not (OR=26.8) or a lobulated border (OR=2.9).122
In the review by Matsuguma et al103 of more than 60 000 CTs it is stated that the usual policy of the institution was to offer patients resection for all sub-solid lesions >15 mm diameter and lesions showing >2 mm growth or development of a ≥2 mm solid area in a pGGN. Some patients did not have resection in view of comorbidities. The authors found that 18 (10%) of 174 nodules reduced in size and 41 (24%) showed growth. All except one SSN that showed growth was malignant. Estimates were made of cumulative percentages of growing nodules at 2 and 5 years (13% and 23% in pGGNs and 38% and 55% in PSNs). The multivariate analysis showed that size >10 mm and history of lung cancer were independent predictors of malignancy in SSNs. The authors reported that none of the pGGNs were invasive adenocarcinoma, with only 4% MIA.
Hiramatsu et al, again in the setting of a large Japanese thoracic surgical centre, studied 184 patients referred with SSNs.106 Of these, 17 underwent immediate investigation and 10 were lost to follow-up. Of the remaining 157, at the initial 3-month follow-up CT, six nodules had resolved but six had already shown obvious growth, while another three showed metastases and four progression of another malignancy. Fifty SSNs that were ≤10 mm in patients with no history of lung cancer did not grow at 3.5 years.
Ichinose et al,104 again from Japan, looked at 191 resected lesions in 160 patients. They found that the proportion of lesions that were malignant was higher, probably owing to the different selection criteria. They noted that eight of 14 pGGNs with an standardised uptake value (SUV) max of 0.8 were malignant compared with four of 52 that were below this threshold.
In a third study from Japan, Takahashi et al115 followed up 150 pGGNs in 111 patients. Patients had high-resolution CT (HRCT) at various intervals but scans were evaluated at first detection, 2 years later and at final follow-up. After a mean of 66 months 19 (12.7%) nodules increased in size by ≥2 mm. Six of the 19 nodules that increased were stable at 2 years. The time to growth was 39.9 months in these nodules and 16.9 months in those 13 nodules deemed to have grown at 2 years. The authors concluded that more than 2 years’ follow-up was necessary to detect growth. The final diagnosis of the growing nodules was determined in seven of 19 (and one further nodule that was stable at 2 years and decreased at follow-up). These were BAC in four and mixed subtype adenocarcinoma in three. All resected patients were alive after a mean of 32 months.
Lee et al113 followed up 175 SSNs that had been stable on HRCT for 2 years and found that after a median follow-up period of 45 months, 26% had enlarged by ≥2 mm. Large size, part-solid type and increasing age were predictors of growth. Kobayashi et al111 followed up 120 SSNs and found that after a median of 4.2 years, 28% had enlarged by ≥2 mm. Smoking and large size were the most important predictors of growth. Chang et al118 found that 12 (9.8%) of 122 pGGN lesions that were followed up for more than 2 years grew and that the 11 that were surgically biopsied were lung cancer. Larger size and the development of a solid component were predictors of growth. The mean VDT of growing pGGNs was 769 days. Most studies used linear measurements to assess growth, but another- study showed that change in mass was a more reliable measure.81
Nakao et al126 performed a prospective trial of limited resection of 50 SSNs ≤2 cm with no pleural indentation or vascular convergence; 40 were adenocarcinoma. There were no recurrences before 5 years but four after 10 years. The authors concluded that long-term follow-up was indicated after limited resection and that the latter should only be done in a trial setting. Silva et al124 reported the experience from the Italian Multicentric Italian Lung Detection (MILD) trial—lung cancer randomised controlled CT screening trial. Seventy-six SSNs were found in 56 participants. Of 48 pGGNs, 31% resolved, 8.3% reduced in size, 43.8% remained stable and 16.7% progressed over an average follow-up period of 50 months. Of these pGGNs, 81% were <10 mm. For PSNs, with a solid component <5 mm, 11.5% resolved, 42.3% remained stable and 46.2% progressed. Lung cancer was found in one pGGN and three PSNs.
Prognosis
The reported prognosis of SSNs is very good, irrespective of the selection criteria. Case series of more than 100 SSNs, whether all resected or managed by follow-up and resection of selected nodules, report few deaths due to cancer109 ,110 ,115 One study found that even when SSNs with suspicious cytology are observed, the outcome is still good.127 These observations have led some authors to suggest that less aggressive treatment is more appropriate. Patz et al128 reported overdiagnosis in the NLST to be a maximum of 18.5% overall, but found this rose to 79% (62%–94%) when BAC was detected by CT screening. Many of these tumours, in the new international classification, would have been designated MIA. The CT correlate would be mostly SSNs. Careful evaluation to identify more indolent tumours has been advocated as a way to reduce overdiagnosis and the associated potential harms by the use of imaging follow-up and minimally invasive surgery.128
Lymph node metastases
Maeyashiki et al129 looked at 398 consecutive clinical stage 1A lung cancers undergoing resection with 263 SSNs. They found that the size of the consolidation (solid component) and the presence of an air bronchogram were independent predictors of lymph node metastases and that 16% of PSNs had nodal metastases. Node metastases occurred in 9.8% of lesions <20 mm diameter and in 22.1% of lesions ≥20 mm (including solid lesions). None of the pGGNs (n=30) or PSNs (number not given) with solid component ≤10 mm had nodal metastases. Ichinose et al104 reported that one of 114 pGGNs showed lymph node involvement. A further study of 57 SSNs showed that the proportion of the solid component was predictive of nodal metastases and that there were no metastases in the 15 SSNs where the solid component was ≤25% of the total diameter.98
Multiple SSNs
SSNs are frequently multiple. One study of 193 SSNs compared the features of single versus multiple nodules.109 Multiple SSNs were more frequently AAH or BAC, and occurred more often in women and non-smokers. However, the authors did not think the differences were enough to recommend a different approach to management. Another study looked at multiple pGGNs in 73 patients undergoing resection for BAC and found that all but one remained stable over a 40-month median follow-up.108 In a study of PSNs, nodules were more likely to be benign if multiple.112
SSNs and staging
Two recent studies have shown that measurement of the solid component of malignant PSNs is a better predictor of prognosis than total diameter,123 ,129 one study suggesting a change to the T descriptor of the Tumour Node Metastasis (TNM)—staging system for lung cancer (table 11).123
Case series of more than 100 SSNs reporting predictors of growth or malignancy
Summary
SSNs merit separate consideration from solid nodules because they represent lesions that confer a better prognosis but paradoxically are more likely to be malignant than their pure solid counterparts, with part-solid nature being an independent predictor of malignancy. There are now well-established baseline predictors of malignancy, and growth or the development of a solid component in pGGNs are strong predictors. Many SSNs have slow growth rates and may remain stable for years. The management of these nodules is therefore uncertain as the prognosis may be good even when confirmed adenocarcinomas are seen. This may suggest that a less aggressive approach is indicated for these lesions.
Evidence statement
The prevalence of pGGNs and PSNs in high-risk screening cohorts is 2–4% and 0.2–1%, respectively. This may be less in some populations that have more non-smokers. Evidence level 2++
The pathological correlates of SSNs are AAH, AIS, MIA and invasive adenocarcinoma. pGGNs are more often AAH, AIS and MIA and PSNs more often invasive adenocarcinoma. Evidence level 3
The majority of studies have assessed SSNs by high-resolution (thin-section) CT. Evidence level 3
Baseline factors consistently associated with malignancy in SSNs are older age, previous history of lung cancer, size of nodule and part-solid nature. Evidence level 2++
Other baseline factors that may be predictive of malignancy are size of the solid component in PSNs, pleural indentation and bubble-like appearance. Evidence level 3
SSNs are more likely to be malignant than solid nodules; however, only PSNs are independent predictors of malignancy. Evidence level 2++
SSNs may resolve after initial follow-up at 3 months. Factors predictive of resolution of PSNs are younger age, peripheral eosinophilia, lesion multiplicity and an ill-defined border. Evidence level 3
About a quarter of SSNs will show growth; PSNs grow more often than pGGNs. Around a quarter of SSNs may grow after being stable for ≥2 years. Evidence level 3
Growth of SSNs is strongly predictive of malignancy; defined as ≥2 mm in maximum diameter. Larger size, current smoking and part solid nature are predictors of growth. Change in mass of SSNs, measured on CT, may be an early indicator of growth. Evidence level 3
The appearance of a new solid component in a pGGN or enlargement of a solid component (≥2 mm in maximum diameter) is predictive of malignancy. Evidence level 3
The prognosis of resected SSNs is excellent (95–100% 5-year survival) and may remain good even when resection is delayed following imaging follow-up. Evidence level 3
PET-CT may have a role in the management of SSNs using lower SUV thresholds. Evidence level 3
The rate of lymph node metastases in SSNs is related to the size of the solid component; the rate is <1% for pGGNs and where the solid component is <10 mm. Evidence level 3
Recommendations
Do not follow-up SSNs that are <5 mm in maximum dimeter at baseline. Grade C
Reassess all SSNs with a repeat thin-section CT at 3 months. Grade D
Use the Brock risk prediction tool to calculate risk of malignancy in SSNs ≥5 mm that are unchanged at 3 months. Grade C
Consider using other factors to further refine the estimate of risk of malignancy, including smoking status, peripheral eosinophilia, history of lung cancer, size of solid component, bubble-like appearance and pleural indentation. Grade D
Offer repeat low-dose, thin-section CT at 1, 2 and 4 years from baseline where the risk of malignancy is approximately <10%. Grade D
Discuss the options of observation with repeat CT, CT-guided biopsy, or resection/non-surgical treatment with the patient where the risk of malignancy is approximately >10%; consider factors such as age, comorbidities and risk of surgery. Grade D
Consider using changes in mass of SSNs to accurately assess growth. Grade D
Consider resection/non-surgical treatment or observation for pGGNs that enlarge ≥2 mm in maximum diameter; if observed, repeat CT after a maximum of 6 months. Take into account patient choice, age, comorbidities and risk of surgery. Grade D
Favour resection/non-surgical treatment over observation for PSNs that show enlargement of the solid component, or for pGGNs that develop a solid component. Take into account patient choice, age, comorbidities and risk of surgery. Grade D
Favour resection/non-surgical treatment over observation where malignancy is pathologically proven. Take into account patient choice, age, comorbidities and risk of surgery. Grade D
Further imaging in management of pulmonary nodules
Key question: What other imaging tests are useful in nodule evaluation and when should they be used?
Once a pulmonary nodule has been detected by CT, a number of imaging modalities can be used to help further determine the likelihood of malignancy. The majority of evidence involves FDG PET with or without CT. Studies have also assessed the utility of scintigraphic techniques using 99m-technetium (99mTc)-labelled compounds with single photon emission CT (SPECT), MRI including diffusion weighted (DW) and dynamic contrast-enhanced (DCE) imaging and DCE-CT.
Evidence review
PET and PET-CT
PET-CT is a cross-sectional imaging technique that provides both anatomical and functional information. It has become firmly established in the management pathways of several malignancies, including lung cancer.130 FDG is the preferred radiopharmaceutical agent for oncological PET-CT. It is a glucose analogue that is injected and taken up and trapped within metabolically active cells; tumour cells have differentially increased glucose use and display increased tracer uptake. However, false-positive uptake is seen in both infective and inflammatory conditions, such as TB and sarcoidosis, whereas false-negative observations are associated with certain types of malignancy, including adenocarcinomas with a significant bronchoalveolar or mucinous component and well-differentiated carcinoid tumours.
A large proportion of the literature focuses on FDG PET alone before the introduction of integrated PET-CT scanners, which are now widely available throughout the UK. The CT component of the examination improves anatomical localisation and can provide additional growth/morphological information that may strengthen a diagnosis of lung malignancy or raise the possibility of alternative benign diagnoses. Nevertheless, the GDG considered the FDG PET only literature still relevant to current practice with FDG PET-CT.
Meta-analyses
Gould et al131 performed the first meta-analysis to determine the accuracy of FDG PET in diagnosing malignancy in patients with pulmonary nodules and masses. A pooled analysis limited to pulmonary nodules identified 13 studies with a total of 450 nodules with an overall sensitivity and specificity of FDG PET of 93.9% and 85.8%, respectively. A variable size cut-off point defining the upper range of nodule size was used (either 3 or 4 cm depending on the studies quoted) meaning that some lesions between 3 and 4 cm in size were included in the nodule analysis and were outside the size definition used in this guideline. Cronin et al132 performed a meta-analytic comparison of the cross-sectional imaging modalities for the diagnosis of malignancy in SPNs (up to 3 cm diameter). A pooled analysis of 1008 nodules from 22 eligible studies reported a similar sensitivity and specificity of FDG PET of 95% and 82%, respectively.
Lung cancer screening studies
Several studies have assessed the utility of PET-CT within lung cancer screening studies, where patients have a higher risk of malignancy than the general population, mostly attributable to their smoking history and age. Veronesi et al133 analysed a subset of 157 patients from the COSMOS early detection trial for lung cancer, who underwent FDG PET-CT for indeterminate nodules >8 mm (or growing lesions <8 mm) in size. The sensitivity, specificity and accuracy of FDG PET-CT were 88%, 93% and 91%, respectively, with optimal performance for solid nodules ≥10 mm. Ashraf et al94 reviewed a subset of the Danish Lung Cancer Screening Trial comprising 53 patients with indeterminate nodules between 5 and 20 mm, who underwent a FDG PET-CT scan alongside a baseline and 3-month follow-up CT scan. The finding of a VDT of <1 year, or FDG avidity at the same level or higher than the mediastinum, both had a similar accuracy for diagnosing malignancy. When these criteria were used in combination, sensitivity and specificity increased (90% and 82%, respectively). Pastorino et al134 reported the 2-year results of a screening trial looking at the efficacy of yearly CT and selective use of FDG PET for nodules ≥7 mm in 42 patients. The sensitivity and specificity of FDG PET were 90% and 82%, respectively. Bastarrika et al20 reported on 24 patients who underwent FDG-PET for nodules ≥10 mm or smaller (>7 mm) growing nodules with a sensitivity, specificity, PPV and negative predictive value (NPV) of FDG PET of 69%, 91%, 90% and 71%, respectively. Four false-negative lesions (ie, PET negative) which reduced the sensitivity and NPV of FDG PET, showed interval growth on 3-month follow-up CT, increasing the sensitivity of the combined diagnostic algorithm to 100%.
The screening studies demonstrate that in high-risk populations, a positive PET-CT scan warrants progression to more invasive diagnostic tests to confirm or refute malignancy, whereas a negative scan has a lower exclusion value for malignancy and requires continued surveillance with CT.
Other PET and PET-CT studies
Outside screening trials, the results for PET-CT for predicting malignancy are broadly consistent. Fletcher et al135 conducted a large head-to-head prospective trial comparing the diagnostic accuracy of FDG PET with CT. Accuracy estimates of FDG PET and CT were based on 344 patients who had a definitive benign or malignant (53%) diagnosis established on histology or follow-up. Using qualitative visual assessment of FDG uptake linked to a five-point ordinal scale, FDG PET had a similar sensitivity to CT (91.7% vs 95.6%) but a greater specificity (82.3% vs 40.6%) and overall, was more accurate than CT in predicting malignancy with an area under the ROC curve of 0.93 and 0.82 (p<0.001), respectively. Smaller retrospective studies assessing the relative accuracies of FDG PET-CT, FDG PET and CT for the diagnosis of malignancy in SPNs have reported similar results with the accuracy of FDG PET-CT better than FDG PET or CT alone.136 ,137 The synergistic combination of anatomical and functional information preserves the sensitivity of CT and favourable specificity of FDG PET to improve diagnostic accuracy. Nie et al138 in a retrospective study of 92 consecutive patients with indeterminate pulmonary nodules (<3 cm) used computer-aided diagnosis with 4 clinical, 16 CT and 4 PET input parameters to illustrate this. A computer-aided detection (CAD) scheme based on both CT and PET input parameters provided better discrimination between benign and malignant nodules with an area under the ROC curve of 0.95 compared with 0.91 for PET alone or 0.83 for CT alone.
Nodules <10 mm
The utility of PET for characterising nodules <10 mm is not clear with sparse data available in both meta-analyses. Gould et al131 noted a paucity of data on nodules <1 cm; the eight instances where results were available showed three true-positive, two true-negative and three false-negative observations. Cronin et al included seven studies not part of the prior meta-analysis from which information on only nine nodules was available;132 eight of these nodules were from one study detailed below.139
Two of the lung cancer screening studies provide data on SPNs <1 cm. Veronesi et al133 in a subgroup analysis of 44 nodules of <1 cm reported a sensitivity, specificity and accuracy of FDG PET-CT for malignancy of 83%, 100% and 95%, respectively. Diederich et al24 had three nodules <1 cm in their cohort, all of which were PET negative, including two false-negative lesions, which were adenocarcinomas on histology.
Nomori et al140 in a prospective trial evaluating FDG PET for pulmonary nodules <3 cm, assessed 136 non-calcified nodules, of which 20 nodules were <1 cm. All subcentimetre nodules were negative on FDG PET, including 12 malignant nodules, leading to the authors’ conclusion that FDG PET was not suitable for nodules <1 cm. Herder et al139 undertook a small retrospective study addressing the same question, with conflicting results. Eight out of 36 nodules in their cohort were <1 cm with four true-positive, three true-negative and one false-positive observations with a sensitivity and specificity of FDG PET for nodules <1 cm of 90% and 78%, respectively.
PET-CT scanners have a finite ability to resolve small objects, which is dependent on the spatial resolution of the system and image pixel size. Assuming a standard scanner bore width of 80 cm and a 192×192 image matrix, a pixel size of 4.2 mm (800 mm/192), will in theory, permit objects of at least 8.4 mm to be resolved. Tracer uptake related to lesions smaller than this will be underestimated owing to partial volume errors. In addition, for a lesion to be visualised, tracer uptake must be clearly depicted above background activity, which is problematic for lesions with minimal tracer uptake or areas with increased background activity such as the dependent lower lobes. Lesion detection is also adversely affected by breathing artefact, particularly peripheral lesions and those just above the diaphragm, the latter additionally affected by scatter artefact from the liver.
Sub-solid nodules
FDG PET-CT may be suboptimal at characterising SSNs as benign or malignant using conventional criteria. Veronesi et al,133 found from a cohort of 157 patients that five of six pGGNs (1.4–1.8 cm) were falsely negative on FDG PET-CT and concluded that PET was not helpful. However, the sensitivity, specificity and accuracy of FDG PET-CT were much higher for the subset of 30 PSNs (no information on the size of the solid component). Nomori et al140 reported 15 pGGNs (10 malignant, 5 benign) from a cohort of 136 nodules; nine malignant nodules were falsely negative on FDG PET, whereas four benign nodules were falsely positive and similarly concluded that FDG PET could not evaluate ground-glass nodules accurately. Ichinose used an SUV cut off point of 0.8 and found that for 64 pGGNs that had PET, the sensitivity was 67% and specificity 89% for detection of invasive lung cancer.104 Smaller retrospective studies have suggested that SSNs with increased FDG uptake may have a potential benign infective/inflammatory aetiology and should therefore be followed-up with CT rather than with more invasive investigations.141 ,142
Qualitative versus quantitative analysis
Gould et al131 in their meta-analysis found that semiquantitative analysis of FDG uptake provided no additional benefit to the diagnostic accuracy achieved through qualitative visual assessment. SUV is a relative measure of FDG uptake, which is prone to variability as a result of scanner features (spatial resolution, image scatter and noise), patient factors (blood glucose, renal function, biological variability), imaging protocols (injected activity, duration of uptake period, respiratory motion) and reconstruction algorithms (attenuation and scatter correction).143 Multiple sources of potential error make reproducibility of SUV measurements and application of SUV cut-off points to determine malignancy difficult, owing to a lack of standardisation across imaging centres, resulting in an estimated greater than 15–20% variability in SUVmax measurements.143 The advantage of SUV is that it is less variable across individuals than subjective assessments, and may be used for follow-up scanning, provided that the same scanner is used. Early FDG PET studies suggesting that an SUV <2.5 is in keeping with a benign nodule have been proved incorrect with a significant chance of malignancy remaining in such nodules. For these reasons, either qualitative visual assessment of FDG uptake of SPNs (±linked ordinal scale) and/or SUV measurements may be used.
FDG PET-CT and clinical risk prediction models
Gould et al131 suggested that the best use of FDG PET was in conjunction with an estimation of the pre-test probability of malignancy. Herder et al55 confirmed this in a retrospective study of 106 patients with indeterminate SPNs evaluated with FDG PET. They validated the Mayo clinical risk prediction model and reported a high diagnostic accuracy (86%) of FDG PET for malignancy. Importantly, combined information gained from both clinical assessment and FDG PET resulted in the best diagnostic accuracy, with FDG PET significantly increasing the area under the ROC by 13% from 0.79 to 0.92. More recently, Evangelista et al144 retrospectively reviewed 59 patients with cancer with indeterminate solitary or multiple lung nodules who underwent FDG PET-CT. They used the Mayo clinic and VA clinic risk prediction models to assign risk categories and assessed the additional role of FDG PET-CT. They found that the use of FDG PET-CT was most efficacious and improved risk stratification in those with a low to intermediate pre-test probability of malignancy. In the Herder model, FDG uptake was classified as absent, faint, moderate or intense. The authors did not provide objective measures or definitions but others have.135 ,145 The last two studies used a five-point scale that can be adapted to a four-point scale to facilitate consistency in reporting and use with the Herder model. Table 12 shows the two scales. From these, the GDG derived a four-point qualitative scale to be used with the Herder model (see recommendations).
Two ordinal scales with definitions for reporting fluorodeoxyglucose uptake
Dual time point imaging
Dual time point imaging involves image acquisition at two time points rather than a single time point after the injection of tracer. The technique is reliant upon the observation that malignant nodules continue to accumulate tracer with time, whereas benign nodules either remain stable or display reduced tracer uptake, which aids differentiation. Individual studies have shown conflicting results for FDG PET,146 ,147 but a recent meta-analysis of dual time point FDG PET-CT by Zhang et al148 showed that dual time point imaging offered slightly improved specificity in comparison with single time point FDG PET-CT, although they had similar diagnostic accuracies for diagnosing malignancy. However, only eight studies (415 nodules) were included in this meta-analysis and it was limited by significant between-study heterogeneity; larger prospective studies are required for further evaluation. From a practical aspect, the additional time required to perform dual time point imaging and resultant reduction in patient throughput makes routine adoption of this technique unrealistic.
Cost-effectiveness
Cao et al149 published a systematic review of the cost-effectiveness of FDG PET in the staging of NSCLC and the management of SPNs. Five studies assessed the utility of PET for pulmonary nodule management, none from a UK setting. The studies were heterogeneous and the conclusions varied depending on factors such as the sensitivities and specificities assigned to FDG PET, the pre-test probabilities of malignancy and the healthcare setting. Nevertheless, the overall conclusion was that the additional information gained from FDG PET imaging in the diagnosis and management of indeterminate of SPNs is of value in the appropriate clinical context.
Single-photon emission CT
SPECT imaging using 99mTc-labelled radiopharmaceutical agents is similar in principle to PET imaging, where the distribution of injected radiopharmaceutical agent and emission of gamma photons is used to create representative cross-sectional images. This permits more accurate localisation of tracer uptake in comparison with planar imaging, but the spatial resolution of SPECT remains lower than PET. Studies have assessed the utility of 99mTc-depreotide SPECT, a somatostatin analogue, as an alternative to FDG PET for the evaluation of SPNs given that malignant nodules have a greater expression of somatostatin receptors than benign nodules. Cronin et al,132 in a pooled analysis of seven studies (439 nodules), reported a sensitivity, specificity and area under the ROC curve of 95%, 82% and 0.94, respectively, which was not significantly different from the results obtained with FDG PET. Naalsund and Maublant150 in a multicentre prospective study analysing 118 nodules, reported slightly inferior results with a sensitivity, specificity and diagnostic accuracy of 89%, 67% and 81%, respectively. However, since October 2010, 99mTc-depreotide is no longer commercially available in Europe.
MRI
MRI is a non-ionising cross-sectional imaging technique which is reliant upon the variable excitation and relaxation of hydrogen atoms— that is, protons, in response to a radiofrequency pulse, while in a static magnetic field. Imaging the lungs is problematic owing to inherent low proton density, resulting in poor image contrast, numerous air–soft tissue interfaces which result in signal loss and distortion and cardiac and respiratory motion, causing image blur. However, technological advances incorporating faster image sequences and functional imaging sequences including DW-MRI and DCE-MRI have changed this.
Studies assessing the accuracy of ultrafast MRI techniques using a HASTE sequence for the detection of pulmonary nodules, in comparison with the ‘gold standard’ of CT, have reported reliable detection of pulmonary nodules >5 mm.151 ,152 However, no studies have assessed the ability of HASTE MRI to differentiate between benign and malignant SPNs.
DWI-MRI
DWI-MRI is based on the free diffusion of water molecules (Brownian motion) with areas of restricted diffusion —that is, tissues with increased cellularity, returning a high signal which can be quantified with the apparent diffusion coefficient value. Wu et al153 performed a meta-analysis of 10 studies (712 nodules) assessing the diagnostic accuracy of DWI-MRI in differentiating benign from malignant lesions (pulmonary nodules and masses) and reported a pooled sensitivity and specificity of 84% and area under the summary ROC curve of 0.9. The authors noted significant between-study heterogeneity with a high proportion of retrospective studies with significantly higher and potentially confounding pooled sensitivity and specificity estimates. Consequently, they concluded that high-quality prospective studies are required to further assess the utility of DWI-MRI. Mori et al154 prospectively compared DWI-MRI and FDG PET-CT to diagnose malignancy in 140 lesions and reported similar sensitivities (70% vs 72%) and diagnostic accuracies (76% vs 74%), although specificity was significantly better with DWI-MRI (97% vs 79%). Ohba et al in a prospective comparative study between 1.5 T and 3 T DWI-MRI and FDG PET-CT assessing 76 lesions reported similar sensitivities and specificities between the two techniques, although importantly both studies included both pulmonary nodules and masses.155
Dynamic contrast-enhanced MRI
DCE-MRI provides information related to the underlying perfusion and permeability of the tissue microenvironment based upon the degree of uptake of gadolinium-based contrast material. Cronin et al132 in a pooled analysis of six studies (284 nodules) reported no significant difference in the diagnostic performance of DCE-MRI compared with FDG PET and other imaging techniques. Smaller single-centre prospective studies have produced conflicting results; some have confirmed a high accuracy of DCE-MRI for diagnosing malignancy in SPNs,156 whereas Satoh et al157 suggested that DCE-MRI is inadequate for distinguishing between benign and malignant SPNs. Mamata et al158 undertook a small study of 30 patients, using more complex analysis of DCE-MRI studies (perfusion indices and pharmacokinetic parameters) to help differentiate between benign and malignant SPNs. Using a parameter that focuses specifically on the dynamics of contrast material transport into and out of the extravascular extracellular space (kep) with a cut-off point of 1.0 min−1, they reported a sensitivity, specificity and accuracy for diagnosing malignancy of 76%, 100% and 80%, respectively. Overall, despite technological advances in MRI and some potentially promising results in small individual studies, there remains little evidence to support its use over FDG PET-CT.
Dynamic contrast-enhanced CT
DCE-CT provides similar information to that obtained with DCE-MRI using iodinated contrast material, with the overall contrast enhancement of malignant nodules usually higher than that of benign nodules. Cronin et al132 in a pooled analysis of 10 studies (1167 nodules) reported a sensitivity, specificity and area under the ROC curve of 93%, 76% and 0.93, respectively, which was comparable with the diagnostic performance of FDG PET. Smaller prospective studies have reported similar results but with lower specificities and differing cut-off values, probably attributable to varying image acquisition parameters.159 ,160 Single-centre prospective studies have also looked at the first-pass perfusion DCE-CT assessing tissue haemodynamics based on perfusion parameters to differentiate between benign and malignant nodules. Sitartchouk et al161 in a single-centre study of 57 nodules, first reported the utility of perfusion parameters in differentiating between benign and malignant SPNs. Li et al162 in a similar sized study of 77 nodules confirmed this potential with sensitivities, specificities and accuracies to diagnose malignancy of 91.3–93.5%, 81.8–90.9% and 88.2–92.6%, respectively. More recently, Ohno et al in two prospective comparative studies between perfusion DCE-CT and FDG PET-CT have suggested that perfusion CT is more specific and accurate than FDG PET-CT.163 ,164 However, in both studies an SUVmax cut-off point was used to determine malignancy on FDG-PET-CT with nodule characteristics on the CT component of the examination not obviously used to make this decision. Further comparative studies with FDG PET-CT using optimal image interpretation are required before considering DCE-CT as a viable alternative for diagnosing malignancy in SPNs.
Risk thresholds for further investigation of risk of malignancy
Louie et al165 developed a Markov model to determine appropriate thresholds for deciding between management strategies in patients unfit for surgical resection. They modeled the pre-test probability of malignancy below which CT surveillance was appropriate and above which PET-CT should be performed, and proposed 17% as an appropriate cut-off between these two strategies. The GDG assessed the effect of increasing the threshold for PET-CT from 10% (as proposed previously) to 17% in a cohort of British patients with incidentally detected pulmonary nodules (unpublished data) and found that a malignant diagnosis would have been delayed for 23% of patients affected by this change. Thus a 10% threshold for proceeding to PET-CT was preferred. Louie et al also modeled the threshold above which it was appropriate to proceed to treatment without biopsy confirmation of malignancy, suggesting 85% probability of malignancy as an appropriate cut-off. Again, when these thresholds were used in a UK population, use of a 70% cut-off for treatment resulted in only a small increase in treatment of benign disease and reduced the chance of treatment delay, so the GDG considered that a lower threshold was appropriate (see further discussion in ‘Non-surgical treatment without pathological confirmation section’.) Thus figure 1 specifies a range of 10–70% where biopsy is preferred.
Summary
PET-CT remains the preferred investigation in the further evaluation of pulmonary nodules, partly because it is widely available and no alternative investigation shows superiority. Further research is required to evaluate alternative techniques, such as DCE-CT, which may be more cost-effective. PET-CT is less useful in smaller nodules but these have a lower risk of malignancy and can be managed by further imaging follow-up. In the assessment of risk, the Mayo model is substantially improved by the addition of PET-CT as described by Herder et al and when used with an ordinal scale to categorise FDG uptake.
Evidence statement
Pre-test probability of malignancy influences interpretation of PET-CT, with high-risk individuals at risk of false-negative results, and low-risk individuals at risk of false-positive results. Evidence level 3
In a meta-analysis PET has shown a sensitivity of 93.9% and specificity of 88.5% for determining malignancy from a pooled cohort of studies including patients with low to high risk. Evidence level 2++
PET has a good sensitivity and moderate specificity for determining a malignant nodule in patients with a high risk of malignancy with a pulmonary nodule of uncertain aetiology of ≥10 mm, with more limited evidence for nodules <10 mm. Further imaging to assess growth increases the sensitivity of determining malignancy. Evidence level 1− supported by 2++
PET has a lower sensitivity and higher false-negative rate in SSNs. Evidence level 2++ and 3
Methods of assessing FDG uptake include qualitative visualisation, semiquantitative analysis and the measurement of SUVs; all have similar accuracy. The Herder model employed an ordinal scale. Evidence level 3
Risk prediction models are improved by the addition of information from PET-CT; the Herder model AUC improved from 0.79 to 0.92. Evidence level 3
MRI does not have a routine place in assessing pulmonary nodules outside of research studies. Evidence level 2++ and 3
SPECT does not show any advantage over PET-CT in the assessment of pulmonary nodules. Evidence level 2++ and 3
DCE-CT has a high sensitivity but low specificity for determining malignancy. Evidence level 2++ and 3
Recommendations
Offer a PET-CT to patients with a pulmonary nodule with an initial risk of malignancy of >10% (Brock model) where the nodule size is greater than the local PET-CT detection threshold. Grade B
Ensure that PET-CT reports include the method of analysis. Grade D
Use a qualitative assessment with an ordinal scale to define FDG uptake as absent, faint, moderate or high using the following guide:
Absent—Uptake indiscernible from background lung tissue
Faint—Uptake less than or equal to mediastinal blood pool
Moderate—Uptake greater than mediastinal blood pool
Intense—Uptake markedly greater than mediastinal blood pool. Grade D
Reassess risk after PET-CT using the Herder prediction tool. Grade B
After reassessment of risk:
Consider CT surveillance for people who have nodules with a chance of malignancy <10%
Consider image-guided biopsy where the risk of malignancy is assessed to be between 10 and 70%; other options are excision biopsy or CT surveillance guided by individual risk and patient preference
Offer people surgical resection as the favoured option where the risk that the nodule is malignant is >70%; consider non-surgical treatment for people who are not fit for surgery. Grade C
Do not use MRI, SPECT or DCE-CT to determine whether a nodule is malignant where PET-CT is an available alternative. Grade D
Further research is needed into the most effective follow-up pathway in low-to-medium risk patients and for those with pGGNs. RR
Further research should be undertaken into the use of PET-CT in the evaluation of pGGNs using lower SUV cut-off values. RR
Non-imaging tests and non-surgical biopsy
Key question: What non-surgical biopsy/non-imaging tests are useful in nodule evaluation, when should they be used and what are the harms?
Non-surgical biopsy or further non-imaging tests are used where there is insufficient certainty about the diagnosis to allow definitive management. The choice of test may depend on the preferences of the patient and so it is especially important to ensure the balance of accuracy and safety has been explained and that this is acceptable to the patient (see section ‘Information and support’).
Evidence review
Biomarkers
Five studies were identified assessing the role of biomarkers in determining the likelihood of a pulmonary nodule being malignant. Four of these studies measured circulating markers, and one involved analysis of bronchoalveolar lavage fluid.
Chu et al166 described a cross-sectional study that looked at combining tumour markers (squamous cell carcinoma antigen, CEA, cytokeratin 19 fragment antigen and neuron-specific enolase) in 805 patients with suspicious pulmonary masses, of whom 444 were found to have stage I lung cancer. The test performed poorly, with a demonstrated sensitivity of only 23.2%. Shen et al167 reported a cross-sectional study looking at the role of plasma microRNAs in 156 patients with SPNs found that plasma microRNA could distinguish between malignant and benign nodules with 75% sensitivity and 85% specificity (ROC AUC 0.86). Daly et al168 looked at a panel of seven biomarkers (interleukin (IL) 6, IL-10, IL-1ra, sIL-2Rα, stromal cell-derived factor-1 α+β, tumour necrosis factor α and macrophage inflammatory protein 1α) in a validation cohort of 81 patients (61 with benign nodules, 20 with malignant nodules). They found that the sensitivity and specificity for diagnosing malignancy were 95% and 23.3%, respectively, with a negative predictive value of 93.8%.
Higgins et al assessed the performance of a variant form of Ciz1 (a nuclear matrix protein) as a circulating biomarker for stage 1 lung cancer. In a validation cohort of 160 individuals comprising patients with stage I lung cancer, benign pulmonary nodules, inflammatory lung disease and age-matched smoking controls, the test performed well with 95% sensitivity and 74% specificity. Currently, however, measurement requires Western blot analysis which is not easily applied outside a research laboratory, and the authors acknowledge that the assay would need to switch platforms and be validated further before widespread use.169
The value of lactate dehydrogenase (LDH) in bronchoalveolar lavage fluid for discriminating between benign and malignant pulmonary nodules was assessed in a prospective case–control trial with 21 controls, 17 patients with benign SPNs and 42 with malignant lesions.170 LDH levels were significantly higher in those with malignant SPNs than in those with benign lesions or controls, although this study excluded those with a smoking history.
Three studies evaluated the performance of a panel of circulating autoantibodies in predicting patients with lung cancer. This test is commercially available (EarlyCDT-Lung) and is marketed as a tool to risk stratify patients with pulmonary nodules. Boyle et al171 described use of a panel of six circulating autoantibodies in three cohorts of patients with newly diagnosed lung cancer (n=145, 241, 269), each matched to control individuals (although little clinical information was supplied about the control groups). Sensitivities of 36–39% and specificities of 89–91% were reported for the three cohorts. Lam et al reported a similar study with the same panel of autoantibodies measured in four cohorts of patients with newly diagnosed lung cancer from Europe and North America.172 Results were compared with control populations for three of the four cohorts, with control populations matched by age, sex and (in two cohorts) smoking history. Overall, results were similar to those of the study by Boyle et al,171 with sensitivities of 34–43% and specificities of 87–89% for lung cancer.
A subsequent report described the addition of a seventh autoantibody to the panel and assessed performance in routine clinical practice in 1613 patients for whom US physicians ordered the EarlyCDT-Lung test.173 Sensitivity and specificity for lung cancer were 37% and 91%, respectively, with a positive test increasing the chance of lung cancer diagnosis by a factor of 5.4. No data are presented for baseline clinical or demographic data for the whole population. Of all patients tested (irrespective of test results), 3.8% were diagnosed with lung cancer within 6 months, which is considerably in excess of the rates of lung cancer seen in CT screening studies. From the information provided in the study, it is impossible to comment on the reasons for such a high rate of lung cancer diagnosis. To date, there are no published studies reporting the performance of the Early CDT-Lung test in prospectively recruited populations at high risk of developing lung cancer according to predefined criteria. Trials are ongoing, including a study in the UK using the test as a pre-CT screening tool. Of relevance to this guideline, there are no reports evaluating the performance of this test in a cohort of patients with pulmonary nodules, and thus its efficacy in discriminating malignant from benign nodules is unknown.
Flexible bronchoscopy
van't Westeinde et al174 evaluated the use of conventional bronchoscopy in the investigation of 308 consecutive patients with a positive CT screen enrolled in the NELSON trial. There were 318 suspicious lesions, with mean diameter of 14.6 mm (only 2.8% were >3 cm). The sensitivity of bronchoscopy was only 13.5% (95% CI 9.0% to 19.6%) with a negative predictive value of 47.6%. The authors do not recommend routine use of bronchoscopy for positive test results in a screening programme.
Bronchoscopy with guidance
Several case series have reported the yield of bronchoscopy under fluoroscopic guidance. Baaklini et al175 described a retrospective analysis of 177 patients undergoing bronchoscopy with fluoroscopy for pulmonary nodules without endobronchial abnormality. Diagnostic yield fell for progressively distal lesions (yield 82% for central, 61% for intermediate and 53% for peripheral), with particularly low yield for lesions <2 cm in the outer third of the lung (14%). Aoshima et al176 reported results from a cohort of 208 procedures carried out with fluoroscopy. Diagnostic yield was 62% for malignant lesions and 12% for benign lesions. Factors associated with reduced yield were diameter <25 mm, distance >40 mm from inlet of segmental bronchus and absence of CT bronchus sign (p<0.05 for each factor). The CT bronchus sign refers to the finding that the third- or fourth-order bronchus leads to the lesion. Schwarz et al177 performed flexible bronchoscopy with fluoroscopy in 225 patients with nodules <3 cm. Unsuspected endobronchial involvement was found in 4.4% of cases, and bronchoscopy confirmed aetiology of the nodule in 41% cases. Oki et al178 described a case series of patients with peripheral pulmonary lesions undergoing fluoroscopic guided bronchoscopy with a 3.5 mm thin bronchoscope in the absence of endobronchial lesion seen with standard scope. Of the 98 patients with appropriate follow-up data, thin bronchoscopy yielded diagnostic information in 69% of patients overall (median lesion size 30.5 mm). The thin bronchoscope could be inserted into more distal bronchi (mean 4.3 generations vs 2.3 with standard bronchoscope, p<0.001) and allowed visualisation of an endobronchial lesion in 14% patients. Lai et al179 reported the diagnostic yield of bronchoscopy with transbronchial biopsy under fluoroscopy for pulmonary nodules in an area endemic for TB. The diagnostic sensitivity was 70% in patients with lung cancer and 55% in patients with TB. Yield fell for smaller nodules (35% diagnostic rate for nodules <2 cm vs 65% for nodules >2 cm).
Radial endobronchial ultrasound
Several further case series have looked at the role of radial endobronchial ultrasound (rEBUS) to increase the diagnostic rate of bronchoscopy.180–182 Herth et al180 described a prospective crossover study comparing fluoroscopy with rEBUS in 54 patients with pulmonary nodules not visualised with fluoroscopy (mean nodule diameter 2.2 cm). Radial EBUS located 89% of the nodules, and in 70% a biopsy yielded a diagnosis. Pneumothorax occurred in one patient. Eberhardt et al181 reported a similar study from the same group, using rEBUS to sample 100 small pulmonary nodules <2 cm not visualised by fluoroscopy. A lesion was visualised by rEBUS in 67% of cases, and biopsies established a diagnosis in 46% of patients. Pneumothorax occurred in 3% cases. Kurimoto et al182 reported the yield of rEBUS in 150 consecutive patients with pulmonary nodules. Biopsies were diagnostic in 77% of cases, and yield did not appear to vary with nodule size (76% diagnosis rate for 21 nodules <10 mm diameter). Moderate bleeding occurred in two patients (1%) with no reported pneumothoraces.
Electromagnetic navigation
Electromagnetic navigation bronchoscopy (ENB) creates a virtual bronchoscopic image of patients’ airways derived from a CT scan of their chest. Patients are then placed on a board which generates an electromagnetic field. The virtual and actual anatomy are aligned, which allows a steerable sensor probe to navigate to the lesion under virtual real-time guidance. Four case series were identified evaluating this technique.183–186
Eberhardt et al183 assessed performance of ENB in 54 patients with pulmonary nodules <3 cm diameter. Of 53 lesions with follow-up data, 75.5% of samples were diagnostic (sensitivity 72.3% for malignancy). The study also compared yields of catheter aspiration with forceps biopsy with this technique, finding this former to have a greater diagnostic yield.
Gildea et al184 reported results from a series of patients with pulmonary nodules and lymph nodes sampled by ENB. Of 54 procedures for peripheral lesions with mean diameter 22 mm, 40 (74%) were diagnostic. Efficacy did not differ by size of lesion with similar yield for nodules >2 cm and <2 cm (73.9% vs 74.1%, respectively). Pneumothorax occurred in two patients (3%).
Jensen et al185 performed a retrospective analysis of the performance of ENB across five centres. Ninety-two patients underwent the procedure (mean nodule size 2.6 cm), with an overall diagnostic yield of 65%. Unlike the previous report, they did find a significant reduction in yield for nodules <2 cm compared with those >2 cm (50% vs 76% respectively, p=0.01). Pneumothorax occurred in 3% of patients.
Lamprecht et al186 reported results from ENB in conjunction with rapid on-site cytological evaluation. In 112 patients, ENB was diagnostic in 83.9%, with a trend towards better results for large nodules (yield for lesions <2 cm vs >2 cm were 75.6% and 89.6%, respectively, p=0.06). Pneumothoraces occurred in two cases (1.8%).
Finally, Seijo et al187 described results of ENB in 51 consecutive patients with pulmonary nodules (mean size 2.5 cm). Overall diagnostic yield was 67%, but this was significantly higher in patients with the CT bronchus sign than in those without (79% vs 31%, p=0.04). The CT bronchus sign was the only variable predicting yield on multivariate analysis (OR=7.6, 9% CI 1.8 to 31.7). There were no procedure-related complications.
Image-guided biopsy
Ultrasound
The only large case series (>50 cases) reviewed for ultrasound-guided biopsy of nodules was that from Obata et al,188 describing results from 107 nodules sampled. All nodules were ≤2 cm in diameter, and all were in contact with the pleura. The yield from the first biopsy was only 39% (56% for malignant lesions and 16% for benign lesions). A proportion of those with negative initial procedures underwent a repeat attempt and of those, 49% were diagnostic. No further studies were identified meriting inclusion, presumably reflecting the more common practice to biopsy peripheral nodules under CT guidance (see following section).
CT-guided biopsy
Eleven retrospective case series were identified assessing the performance of CT-guided percutaneous biopsy of pulmonary nodules/masses.189–199 Case series were only considered if more than 50 patients were included and where patient level data was available to allow cases to be pooled to allow calculation of overall test performance. Other case series discussed below were excluded from this combined analysis if the authors limited inclusion to specific groups (eg, nodules <1 cm diameter). There was wide heterogeneity in the inclusion criteria of the various reports (eg, difference in size of nodules included, use of rapid on-site cytology, use of multiplanar reconstruction (MPR)). Although we acknowledged these variables, papers were reviewed for test performance (true positive, true negative, false positive, false negative) in order to determine overall sensitivity, specificity and negative likelihood ratio. Data from these case reports are shown in table 13. Sensitivities in individual reports varied from 77% to 97%, and specificities from 72% to 100%. Considering the data together (accepting the significant heterogeneity of studies) the overall sensitivity was 90% and specificity 95% with a negative likelihood ratio of 0.10 (95% CI 0.08 to 0.12).
A number of case series examined the effect of specific variables on the CT-guided biopsy performance—namely, nodule size, nodule morphology, needle path length, C-arm cone beam system, MPR, immediate cytological assessment and aspiration versus cutting needle.
Four case reports assessed the effect of nodule size on test outcome. Kothary et al200 described a retrospective case series of 139 patients who underwent a CT-guided biopsy and compared test performance and complication rate by nodule size (37 nodules ≤1.5 cm vs 102 nodules >1.5 cm). Larger nodules were statistically more likely to result in diagnostic specimens than smaller nodules (73.5% vs 51.4%, p=0.012), although there was no significant difference in diagnostic accuracy for malignancy (81.3% vs 69.6%, respectively, p=NS). Wallace et al reported performance of CT-guided biopsy in 61 patients with nodules ≤1 cm diameter, and found an overall sensitivity of 82%, specificity of 100% and accuracy of 88%.201 When results for 8–10 mm and 5–7 mm nodules were compared, sensitivity was lower for smaller nodules (88% vs 50%, respectively, p=0.026), although there were only 10 cases in the smaller nodule group. Ohno et al described a retrospective case series of 162 patients undergoing CT-guided biopsy of pulmonary nodules ≤20 mm in diameter.202 Overall diagnostic accuracy was 77.2%, and varied with nodule size (52% for lesions ≤10 mm, 74.4% for 11–15 mm, 91.5% for 16–20 mm, p<0.05). Tsukada et al196 reported performance of CT-guided biopsy in 138 patients with nodules of mean diameter 23 mm (range 6–70 mm). Overall diagnostic accuracy was 82.6%, but decreased significantly with reducing size of lesion (86.7% for 20–30 mm, 78.9% for 10–20 mm, 66.7% for ≤10 mm). Choi et al203 conducted a retrospective analysis of outcomes in CT-guided aspiration and core biopsy of 305 pulmonary nodules <1 cm in a tertiary referral centre. The sensitivity, specificity and accuracy were 93.1%, 98.8% and 95.0%, respectively. No comparison was made between nodules of different sizes, but the data show good performance of the technique even with small subcentimetre nodules.
De Filippo et al retrospectively reviewed 198 CT-guided biopsies of pulmonary nodules. They demonstrated differences in diagnostic accuracy on the basis of nodule morphology, with solid nodules demonstrating highest accuracy (95.1%) with progressively lower accuracy for PSNs (84.6%) and pGGNs (66.6%).204 Choi et al203 described similarly differing accuracy by nodule morphology (solid 96.7%, part-solid 95.8%, pure ground glass 85.3%), although nodule morphology was not a significant predictor of diagnostic failure by univariate analysis.
Two case series described effects of needle path length on performance. Ohno et al202 showed that diagnostic accuracy fell with increased needle path length, with statistically lower accuracy where needle path length was >40 mm compared with shorter path lengths (p<0.05). Gupta et al190 reported the relationship between needle path length and test performance for subpleural pulmonary nodules. In 48 patients, a short direct path was selected (mean 0.4 cm path) and results compared with 128 patients where a longer indirect path was used (mean 5.6 cm path). Fewer diagnostic samples were obtained using the shorter path, although sensitivity, specificity and accuracy (limited to cases with diagnostic sample) did not differ between approaches. This latter report is likely to reflect the specific challenge of sampling lesions immediately beneath the pleura, thereby explaining the apparently conflicting results of these two case series.
Three case series describe results with C-arm cone beam CT (CBCT) guidance which allows real-time fluoroscopic and 3D-CT capabilities. Jin et al reported results of CBCT-guided biopsy of 71 patients with pulmonary nodules ≤30 mm diameter.192 Sensitivity was 97%, specificity 100% and accuracy 98.4%. Choi et al205 reported a similar cohort of 161 consecutive patients undergoing CBCT-guided biopsy, with very similar outcomes (sensitivity 96.8%, specificity 100%, accuracy 98.2%). Finally, Choo et al206 reported use of a CBCT virtual navigation system in 105 consecutive patients with nodules ≤10 mm undergoing image-guided biopsy. Again almost identical performance was reported (sensitivity 96.7%, specificity 100%, accuracy 98%) despite the small size of the lesions. CBCT guidance does involve an additional radiation dose for operator and patient (radiation dose in Jin et al was 272±116 mGy). No studies compared performance of CBCT with conventional CT guidance (neither randomised nor cohort studies), so the additional value of CBCT guidance remains unclear. However, performance particularly for smaller nodules (≤1 cm) does appear impressive.
One retrospective cohort study assessed the utility of MPR during CT-guided biopsy of indeterminate pulmonary nodules, comparing test performance with conventional CT-guidance. Sixty-five patients underwent nodule biopsy by CT with MPR, compared with 250 undergoing conventional biopsy. The populations were well-matched, albeit non-randomised. Diagnostic accuracy was higher in the MPR group than in conventional group both for aspiration biopsy (96.9% vs 82.4%, respectively, p<0.05) and cutting biopsy (97.0% vs 81.3%, respectively, p<0.05). The MPR technique was particularly useful for small nodules (<20 mm).
Santambrogio et al195 describe a randomised controlled trial of on-site cytological evaluation of CT-guided biopsy samples. Two hundred and twenty patients with nodules 1–3 cm underwent CT fine needle aspiration by a thoracic surgeon. Samples from 110 patients were immediately assessed by a cytologist for sample adequacy (with repeat aspiration if inadequate). For the other 110 samples a gross assessment was made by the operator only. Diagnostic accuracy was 99% in the group with immediate cytological examination compared with 88% in the control group (p<0.001), with a small but significant increase in the number of aspirates in the intervention group (1.22 vs 1.10, p=0.015). There was no difference in complications. Although clearly improving yield from this procedure in this study, these findings are not relevant to analysis of core needle biopsies taken by cutting needles, which are increasingly favoured as they provide larger histological samples.
Only one report of those reviewed specifically compared the performance of aspiration and core biopsy. Choi et al203 included a biopsy method (aspiration vs core biopsy vs combined procedure) in univariate and multivariate analysis of factors predicting diagnostic failure. Of 94 aspiration procedures, a non-diagnostic sample occurred in 19.1% compared with only 4.6% of 153 core biopsy procedures. Sensitivity and accuracy (only calculated on the basis of diagnostic samples) were 89.2% and 93.4% for aspiration vs 93.6% and 95.2% for core biopsy, with aspiration being an independent risk factor for diagnostic failure (OR=3.19, p=0.001).
Interpretation of CT-guided biopsy results
Whilst there is clear heterogeneity in the studies considered together in table 13, the pooled data gives an overall assessment of the performance of CT-guided biopsy in reported clinical practice. Overall sensitivity is 90.7% (95% CI 88.8% to 92.4%), specificity 93.9% (95% CI 91.1% to 96.0%), PPV 97.4% (95% CI 96.2% to 98.3%) and NPV 79.9% (95% CI 76.0% to 83.4%). The negative predictive value is of particular importance, as clinicians often have to make a decision about management of a non-malignant biopsy result, mindful of the possibility of a false-negative result.
Case series of CT-guided biopsy of pulmonary nodules
As with any diagnostic test, the post-test probability of malignancy (after a non-malignant CT biopsy) will depend on the pre-test probability and the negative likelihood ratio (calculated here as 0.10, 95% CI 0.08 to 0.12). The effect of a negative (ie, non-malignant) biopsy on the post-test probability of cancer is shown in figure 10. Where the pre-test probability is high (eg, 90%) there is still approximately a 50% chance of malignancy even after a non-malignant biopsy (exact value 47.0%, 95% CI 41.9% to 51.9%). This has recently been confirmed in the largest retrospective series, where there was a 90% prevalence of malignancy. However, in this series half of the lesions were outside the definition of pulmonary nodules as they were greater than 30 mm. The authors emphasised the importance of considering repeat biopsies as they showed that repeat biopsies usually confirm the diagnosis of malignancy.199 However, if the pre-test probability of cancer is only 50%, then the chance of malignancy drops to about 10% after a non-malignant biopsy (exact value 9.0%, 95% CI 7.4% to 10.7%).

The effect of a negative CT-guided percutaneous biopsy (CTgBx) on the probability of a pulmonary nodule being malignant.
The impact of CT-guided biopsy findings on clinical decision-making was investigated by Baldwin et al.189 Clinicians were presented with 114 patient scenarios with and without the results of CT-guided biopsy of pulmonary nodules, and asked to specify management. The proportion of successful decisions (against known outcomes) was assessed. Agreement between clinicians on the need for surgery increased with biopsy result information compared with CT findings alone (κ value 0.57 vs 0.44, respectively). The major benefit of knowing the CT-guided biopsy result was a reduction in unnecessary surgery, especially when the clinical perception of pre-test probability of malignancy was intermediate (31–70%).
Safety
The most commonly reported complication was pneumothorax. Rates were quoted in 11 studies and varied widely between 6.5% and 69% of cases.190 ,192–198 ,201 ,205 ,206 The frequency of chest drain insertion varied similarly (2.5–32.3%). Factors reported as increasing the risk of pneumothorax were lower FEV1,193 ,202 the presence of emphysema along the needle tract205 ,207 longer needle path length,202 number of punctures,193 upper lobe location of nodule201 and core biopsy versus aspiration.193
The most comprehensive data about complications after CT-guided biopsy of pulmonary nodules comes from Wiener et al208 who conducted a cross-sectional analysis of 15 865 patients undergoing biopsies across four US states. Discharge records were reviewed and the percentage of patients with complications was calculated. Pneumothorax risk was 15.0% (95% CI 14.0% to 16.0%), and 6.6% (95% CI 6.0% to 7.2%) of all biopsies resulted in insertion of a chest drain. Haemorrhage was rare, complicating only 1.0% of cases (95% CI 0.9% to 1.2%), although 17.8% of patients with haemoptysis required a blood transfusion. Smoking patients and those with COPD had a higher risk of complications. Clinically apparent systemic air embolism was also identified in three patients out of 610 (0.49%) and resulted in death in one patient (0.16%).209
O'Neill et al207 described a non-randomised comparison of patients undergoing CT-guided lung biopsy with a ‘rapid needle-out patient rollover time’ approach compared with standard technique (n=120 and 81, respectively). Fewer pneumothoraces were found in patients where this technique was used (23% vs 37%, p=0.04) and fewer cases needed chest drain placement (4% vs 15%, p=0.029).
Summary
Although some biomarkers show interesting early results, further studies are required to validate their performance prospectively in clearly defined patient populations before they can be recommended for clinical use. Standard bronchoscopy has a very low yield but this can be increased with the image-guidance techniques described (fluoroscopy, rEBUS and ENB). However, no studies compared performance between these various techniques, and direct comparison between yields described in these series is limited by significant heterogeneity in inclusion criteria, and multiple confounding factors. The reported yields (65–84% for ENB and 46–77% for rEBUS) were less than those for CT-guided percutaneous transthoracic biopsy (pooled 91%), although the latter has a much higher pneumothorax rate (6.6% requiring chest drain in the largest series). The latter may be important for some patients although ENB and to a lesser extent rEBUS may be very time-consuming and are not as widely available as percutaneous biopsy. Figure 10 shows how in a percutaneous biopsy, the pre-test probability of malignancy is altered by a negative biopsy. This may be important when explaining the possible implications to patients.
Evidence statements
Biomarkers do not offer sufficient accuracy to differentiate malignant from benign nodules. Evidence level 3
The diagnostic yield of bronchoscopy in the investigation of pulmonary nodules is low. Evidence level 3
Diagnostic yield of bronchoscopy may be increased by the use of fluoroscopy, electromagnetic navigation and radial endobronchial ultrasound and in the presence of a CT bronchus sign. However, yield remains relatively low for lesions <2 cm in the peripheral third of the lung. Evidence level 3
The diagnostic yield from CT-guided biopsy of pulmonary nodules decreases with decreasing size of the lesion. Evidence level 2+
Techniques such as multiplanar reconstructed images and C-arm cone-beam CT may increase the yield. Evidence level 3
Pneumothorax is the most common complication of CT-guided biopsies; by far the largest study showed an incidence of 15%, with 6.6% of patients requiring an intercostal drain insertion. Consistent factors that increase the risk are lower FEV1 and presence of emphysema along the needle tract. Evidence level 3
The post-test probability of malignancy after a negative lung biopsy depends on the pre-test probability. Evidence level 3
Repeating biopsies in patients with nodules with a high probability of malignancy showed a high confirmation rate of malignancy. Evidence level 3
Recommendations
Do not use biomarkers in the assessment of pulmonary nodules. Grade D
Consider bronchoscopy in the evaluation of pulmonary nodules with bronchus sign present on CT. Grade D
Consider augmenting the yield from bronchoscopy using either radial endobronchial ultrasound, fluoroscopy or electromagnetic navigation. Grade D
Offer percutaneous lung biopsy in cases where the result will alter the management plan. Grade C
Consider the use of other imaging techniques such as C-arm cone beam CT and MPR to improve diagnostic accuracy. Grade D
Consider the risk of pneumothorax when deciding on a transthoracic needle biopsy. Grade C
Interpret negative lung biopsies in the context of the pre-test probability of malignancy. Grade D
Consider repeating percutaneous lung biopsies where the probability of malignancy is high. Grade D
Research should be undertaken into the application of new and existing biomarkers in the evaluation of pulmonary nodules. RR
Surgical excision biopsy
Key questions:
When should patients undergo excision biopsy?
What is the optimal surgical management for nodules confirmed to represent lung cancer (either preoperatively or at intraoperative frozen section pathological analysis)?
How do localisation techniques for pulmonary nodules compare?
Are there specific recommendations for surgical management of SSNs
Evidence review
Timing and method of excision biopsy of pulmonary nodules
When should excision biopsy be performed?
Excision biopsy of pulmonary nodules is performed in two situations—first, where clinical suspicion of malignancy remains high despite a benign or indeterminate preoperative biopsy, and second, where a nodule is considered of sufficiently high risk for malignancy to merit the option of excision without attempt at preoperative biopsy. Evidence for the performance of non-surgical biopsy is reviewed in the previous section. Two case series specifically comparing strategies of proceeding to excision biopsy with or without preoperative confirmation of malignancy were identified.
Heo et al210 reviewed 113 patients undergoing lung resection for nodules without biopsy proof of malignancy (of whom 15% eventually had a benign diagnosis) with 129 patients with nodules with preoperative confirmation of malignancy. Patients without preoperative confirmation of malignancy had shorter waiting times (from admission for investigation to day of surgery), lower total hospital costs and shorter length of stay in hospital. Sihoe et al211 compared outcomes in 206 patients without preoperative confirmation of malignancy (109 with inconclusive preoperative biopsy, 97 without attempt at preoperative biopsy) with 237 patients with preoperative confirmation of malignancy. Benign disease was found in 16 patients without preoperative diagnosis (7.8%). The interval between first presentation and acceptance for surgery was shorter for patients without preoperative diagnosis (although time to operation was not presented). Patients diagnosed with lung cancer at frozen section proceeded to lobectomy, and performing intraoperative frozen section did not increase mean operation time or morbidity compared with patients with preoperation confirmation of malignancy. No other clinical differences were seen between the groups. In both cases series, the decision to attempt preoperative biopsy or to proceed directly to lung resection was made at the clinician's discretion, therefore introducing multiple confounding variables that are poorly identified and not controlled for in the analyses. This limits the usefulness of the comparisons drawn between these patient populations.
The relative performance of thoracoscopic excision wedge biopsy and CT-guided percutaneous lung biopsy were compared in a case series by Mitruka et al.212 Of 312 patients undergoing CT-guided biopsy, 64% had a malignant diagnosis, 6% had a specific benign diagnosis, and 29% (91) had a non-specific benign diagnosis. Of the last group, 47 went on to excision biopsy and 32 (68%) of these were malignant. Percutaneous biopsy had an accuracy of 86% for malignant disease and 71% for benign disease, whereas specific diagnoses were achieved for 97% of patients undergoing excision biopsy.
The clinical threshold at which a decision is made to surgically excise a pulmonary nodule will affect an institution's (or clinician's) benign resection rate. Benign resection rates in case series of indeterminate pulmonary nodules undergoing surgical excision vary widely from 12%213 to 86%.214 Two case series reported changing benign resection rates over times, albeit with differing findings. Thus Rubins and Rubins215 described a progressive reduction in the proportion of resected pulmonary nodules (<3 cm in diameter) with an eventual benign diagnosis from 44% in 1981 to 8% in 1994—a change which they relate to the advent of CT imaging, allowing better preoperative assessment of malignant features. Kuo et al documented a significant rise in benign resection rate from 8.9% in 1995–2005 to 14.8% in 2006–2009 associated with an increase in VATS wedge resections over the same time period.216
No studies have specifically examined what constitutes an optimal or acceptable benign resection rate. Factors that influence the threshold for surgical resection include the risk of morbidity and mortality for excision (particularly if the nodule turns out to be benign) compared with the possibility of stage progression during a period of radiological surveillance. Outcome data from the Society for Cardiothoracic Surgery in Great Britain and Ireland (2010) report an inpatient mortality rate of 0.4% for wedge resection/segmentectomy in 2010 (eight deaths from 1713 cases) (bluebook.scts.org). A review of early mortality following surgical resection for lung cancer from the UK National Lung Cancer Audit between 2004 and 2010 reported a 30-day mortality of 2.1% and a 90-day mortality of 4.2% (35 deaths and 70 deaths, respectively) from 1671 patients undergoing wedge resection or segmentectomy.217 No accurate estimate of the risk of stage progression during surveillance is available. There are only minimal data published describing the natural history of untreated lung cancer, with one case series including larger T2 tumours and patients with N1 nodal disease where the rate of disease progression is likely to be significantly faster than for small pulmonary nodules.218
One case series documented the effects of a benign diagnosis at resection on patient management.219 A treatment change was reported in response to the biopsy result in 68% of benign cases, with mean total costs of US$25 515 (£15 870) per patient. The commonest diagnosis was histoplasmosis (23% of all cases) prompting initiation of anti-fungal treatment, and thus these findings may not be generalisable to other geographical areas with lower rates of granulomatous disease.
How should excision biopsy be performed?
Once a decision is made to proceed with surgical excision of a pulmonary nodule, two subsequent choices are the surgical approach (VATS vs thoracotomy) and the extent of the initial lung resection (wedge resection/segmentectomy/lobectomy).
Five case series were identified describing initial VATS wedge resection with intraoperative frozen section pathological analysis for indeterminate pulmonary nodules and summary details are shown in table 14.214 ,220–223 All reported high sensitivity and specificity with a definitive diagnosis achieved in all cases, and low rates of morbidity and mortality (one patient death from 1331 combined cases). The rates of conversion to thoracotomy varied as indicated below, although several of the earlier studies reported routine conversion to thoracotomy whenever primary lung cancer was confirmed.
Case series of video-assisted thoracoscopic surgery wedge resections for pulmonary nodules
Two case series of surgical resection of nodules detected by CT screening (from Denmark and Italy) reported lower rates of VATS resection (50% and 17%, respectively) and lower benign resection rates (12% and 22%, respectively).213 ,224 No deaths were reported in the Danish series, but the series from the DANTE trial had a 4% postoperative mortality.
No studies have directly compared a VATS approach with an open approach specifically for resection of indeterminate pulmonary nodules. Cohort studies have compared outcomes for resection of lung cancer cases, although there are no prospective randomised trials. In a propensity matched analysis, Scott et al225 showed that VATS lobectomy for lung cancer was associated with fewer respiratory complications and shorter hospital stay than open surgery with similar operative mortality, although there were significant confounding effects related to surgical operator. Recently, a large propensity matched analysis using the US SEER-Medicare database has compared thoracoscopic versus open lobectomy.226 In matched analysis of 1195 patients in each treatment category, those undergoing thoracoscopic resection had significantly lower rates of postoperative pneumonia, atelectasis and sepsis, and lower in-hospital mortality (2.1% vs 3.6%, p=0.029). There were no statistical differences in 3-year overall survival and disease-free survival, although there was a trend towards improved 3-year cancer-specific survival with the thoracoscopic approach (HR=0.74, 95% CI 0.56 to 0.97). The authors comment that this trend might be due to the early mortality benefit of thoracoscopic lobectomy, or unknown confounders not controlled for in the propensity matching.
The extent of lung resection will depend on the location of the nodule, and whether or not there is preoperative pathological confirmation of malignancy. In the absence of preoperative pathology, nodules in the lung periphery are suitable for wedge resection and intraoperative frozen section pathological analysis as described in the above case series. This approach has the obvious advantage of limiting the extent of lung resection for benign disease, thereby avoiding the unnecessary additional mortality and morbidity associated with lobectomy. If intraoperative frozen section confirms lung cancer, then a decision must be taken about proceeding to an anatomical lung resection. The evidence comparing oncological outcomes from lobectomy with those from sublobar resection are considered below.
Wedge resection may not be possible for more centrally situated nodules. Varoli et al223 describe 94 patients undergoing diagnostic lobectomies for indeterminate pulmonary nodules deemed unsuitable for wedge resection, of which 20% were benign. Schuchert et al227 describe a case series of 490 patients with indeterminate pulmonary nodules or mass lesions undergoing anatomical segmentectomy as a definitive diagnostic and management procedure. The benign resection rate was 14%. Among those patients with a pulmonary nodule found to represent NSCLC, no significant difference in time to recurrence was seen in comparison with an unmatched population of patients undergoing lobectomy for the same indication over the same time period. Only limited patient characteristics are presented for the lobectomy cohort, and no correction is made for confounding variables.
Optimal surgical management for nodules confirmed to represent lung cancer
Lobectomy versus sublobar resection
In the only prospective randomised controlled trial of lobectomy versus sublobar resection for early-stage lung cancer, 276 patients with T1N0M0 lung cancer were randomised to lobectomy or sublobar resection.228 Twenty-nine patients had a major protocol violation, and analyses are presented for the remaining 247 eligible patients (lobectomy 125, segmentectomy 82, wedge resection 40). A correction, highlighted by Detterbeck in 2013229 was published in a letter in 1996 that altered the results but not the conclusion of the original paper. A significantly smaller reduction in FEV1 after sublobar resection compared with lobectomy was apparent at 6 and 12–18 months. Using the corrected data, there was a trend towards survival benefit in the lobectomy group (5-year actuarial survival, 73% vs 56%; log-rank p=0.062) and a decrease in the rate of recurrence (5-year actuarial rate of 63% vs 78%; p=0.042). The rate of distant recurrences was the same in both groups, but the patients undergoing limited resection had a threefold higher rate of locoregional recurrence (5.4% vs 1.9% per person per year; p=0.009) (although less when analysed on an intention-to-treat basis).
It is now more than 30 years since this study opened, and the lack of requirement for staging CT before surgery illustrates the changes in practice over the intervening period. Nevertheless, this remains the only randomised study examining this issue to date. Several subsequent retrospective cohort studies have looked at the same question, with differing conclusions.
Billmeier et al230 report a population and health system-based sample of patients with stage I or II NSCLC. Outcomes in 524 patients undergoing lobectomy were compared with those for 155 patients undergoing limited resection (120 wedge resection, 35 segmentectomy). Patients undergoing limited resection were more likely to have small tumour size, worse lung function and be uninsured/covered by Medicare. Thirty-day survival was worse in the limited resection group (presumably relating to comorbidities) with no difference seen when adjusted for covariates. After a median follow-up of 55 months, a trend towards improved long-term survival was evident for lobectomy versus limited resection (HR=1.35, 95% CI 0.99 to 1.84, p=0.05). Okami et al231 report a single-centre, retrospective cohort study comparing lobectomy (n=672) and sublobar resection (n=146, segmentectomy n=90, wedge resection n=56) for stage IA NSCLC. Sublobar resection was associated with worse 5-year survival (HR=1.83, 95% CI 1.26 to 2.67, p=0.0015) after multivariate analysis. When the cohort was subdivided by age, survival of younger patients (<75 years) was significantly worse after sublobar resection (5-year survival 64.0% vs 90.9% p<0.0001), but there was no significant difference in survival after lobectomy and sublobar resection for those aged ≥75 years (74.3% vs. 67.6%, p=0.92).
Miller et al232 reviewed outcomes of 100 patients undergoing surgical resection for NSCLC ≤1 cm in diameter in a single-centre retrospective cohort study. Seventy-five patients underwent lobectomy/bilobectomy, 12 segmentectomy and 13 wedge resection. Comparing lobectomy with sublobar resection, overall 5-year survival was 71% vs 33% (p=0.03) and cancer-specific survival was 92% vs 47% (p=0.07). Altorki et al233 reported a retrospective cohort series of patients undergoing lung resection for NSCLC identified as a solid nodule in the International Early Lung Cancer Action Program, comparing patients undergoing lobectomy (n=294) and sublobar resection (n=53, segmentectomy n=16, wedge resection n=37). In both unadjusted and propensity matched analysis, 10-year survival was similar between the two groups, and remained so when analysis was limited to cancers ≤20 mm diameter.
In the original RCT and these four subsequent cohort studies, the inclusion of both non-anatomical wedge resection and anatomical segmentectomy within the same sublobar group has been questioned, as outcomes from these two procedures may not be equivalent. Sienel et al234 compared outcomes from patients undergoing segmentectomy (n=56) or wedge resection (n=31) for stage IA NSCLC in a single-centre cohort study. Groups were well matched preoperatively. Less locoregional recurrence (16% vs 55%, p=0.001) and fewer cancer-related deaths (29% vs 52%, p=0.016) were seen in the segmentectomy group, and this type of resection showed a prognostic benefit after multivariate analysis (OR=1.16, 95% CI 1.13 to 1.20, p=0.039).
In the previously discussed cohort study by Miller et al, a subgroup analysis comparing wedge resection and segmentectomy showed that the former was associated with lower overall survival (27% vs 57%, p=0.03) and more local recurrence (p=0.05). There was no significant difference in either parameter when segmentectomy and lobectomy were compared, although the study might have been underpowered to show such a difference. Furthermore, a similar trend towards increased local recurrence with wedge resection compared with segmentectomy was demonstrated by Ginsberg et al (recurrence rates per person per year were 0.086 for wedge resection, 0.044 for segmentectomy and 0.022 for lobectomy).228 There is therefore limited low-quality evidence to suggest that wedge resection is inferior to segmentectomy in oncological outcomes, and therefore poor outcomes for patients undergoing wedge resection will have contributed to overall outcomes for the combined sublobar resections groups referenced above.228 ,230–232
Whether segmentectomy is equivalent or inferior to lobectomy is a subject open for debate. In a large retrospective cohort study, Schuchert et al227 reported outcomes for patients with stage IA NSCLC undergoing segmentectomy (n=325) or lobectomy (n=432) (non-randomised). The segmentectomy patients were a subgroup of a larger cohort comprising patients with indeterminate pulmonary nodules and confirmed lung cancers (n=785). No difference in overall or local recurrence was demonstrated (5.2% for lobectomy vs 5.3% for segmentectomy), although data for overall and cancer-specific survival were not reported. Tsutani et al235 reported a case series of 98 patients undergoing segmentectomy and 383 undergoing lobectomy for clinically diagnosed stage IA disease. The lobectomy patients had worse prognostic factors (large tumours, high SUV) so propensity matching analysis was performed. Three-year overall survival was 93.2% in the lobectomy group versus 95.7% in the segmentectomy group. From a retrospective dataset of 392 patients who underwent segmentectomy and 800 patients who underwent lobectomy, Landreneau et al selected 312 patients with clinical stage I NSCLC who had anatomical segmentectomy and propensity matched them for preoperative variables with 312 who had undergone lobectomy.236 No significant differences were seen in locoregional recurrence (5.5% vs 5.1%, respectively, p=1.00), overall recurrence (20.2% vs 16.7%, p=0.30) or 5-year survival (54% vs 60%, p=0.258). Bao et al237 performed a meta-analysis of 22 studies comparing lobectomy and segmentectomy for stage I lung cancer. The authors acknowledged the small retrospective nature of many of the included studies, and significant heterogeneity in the various indications for segmentectomy (poor cardiopulmonary function, elderly patients, small lesions). HRs for overall and cancer-specific survival were determined for all stage I tumours, stage IA tumours, and tumours of ≤2 cm diameter. Segmentectomy was associated with significantly worse survival for stage I tumours (HR=1.2, 95% CI 1.04 to 1.38) and stage IA tumours (HR=1.24, 95% CI 1.08 to 1.42). However, no difference in survival was seen between these surgical techniques for tumours of ≤2 cm (HR=1.05, 95% CI 0.89 to 1.24). Harada et al described a retrospective cohort study comparing lung function and other physiological parameters after segmentectomy and lobectomy for early-stage cancer, demonstrating better preserved lung function at 2 and 6 months postoperatively in patients receiving segmentectomy, although no effect was seen on anaerobic threshold.238
Nodal dissection
One case series assessed predictive factors for nodal involvement in clinical stage I lung cancers identified through CT screening or in a control population.239 Of 71 cases where the primary tumour was ≤10 mm (48 identified through CT screening, 23 in a control population), there were no cases of nodal metastases. The authors suggest that in certain early-stage lung cancers (tumour size ≤10 mm or SUVmax <2.0) nodal dissection is not required. These findings need replicating in other studies before this can be routinely recommended.
Localisation techniques for pulmonary nodules
If limited resection is planned, nodules that are either of small size, located deep to the visceral pleura, or of ground-glass morphology may be difficult to locate at thoracoscopic surgery. A number of techniques have been developed to facilitate localisation of these nodules. Some techniques involve preoperative marking of nodules and include CT-guided hookwire/needle/microcoil insertion, Lipiodol injection (lipid-soluble contrast medium with subsequent intraoperative fluoroscopy), methylene blue injection (to identify the overlying visceral pleura to guide resection) or radio-tracer injection (using 99mTc macro-aggregated albumin with subsequent use of intraoperative gamma probe). An alternative approach has been to use intraoperative ultrasonography to identify the nodule in a collapsed lung during single lung ventilation.
Considering only reports with 50 or more patients, seven case series were identified for CT-guided wire localisation or equivalent,240–246 three for Lipiodol marking,247–249 one for methylene blue injection,250 two for radio-tracer injection251 ,252 and one for transthoracic ultrasonography.253 One small randomised trial comparing hookwire and radiotracer was identified.254 A summary of these reports is shown in table 15.
Case series reporting localisation techniques for surgical resection of pulmonary nodules
The inclusion criteria whereby localisation was deemed necessary varied between case studies. Some studies stipulated a maximum size of nodule (usually 10 mm but 25 mm in one study), or distance from visceral pleura (range 5–15 mm). Some studies included SSNs, whereas others left requirement for localisation to the discretion of the surgeon. The outcome measures varied also, with some reporting successful localisation, whereas others required thoracoscopic resection for success. Success rates according to these disparate criteria range from 84% to 100%. Accepting the limitations of comparison between these series, no one technique appeared more efficacious than any other.
Thirteen of the 14 studies of preoperative localisation reported complications. The remaining study did not discuss complications at all.242 Pneumothorax was reported in all 13 series, with rates of 4–49.1%, although most of these were asymptomatic and did not require treatment. Five studies quoted the rate of pneumothorax requiring chest drain (1.2–6%), and pulmonary haemorrhage (7–29.8%). Pain was reported in two series (7, 11%) and dislodgement of wire/coil in four series (1.8–7.5%). One patient (0.6%) undergoing Lipiodol injection developed a haemopneumothorax requiring immediate operation.247 The one report of intraoperative ultrasound localisation described no complications.253 Ultrasound successfully localised 94% of nodules, but this was more difficult when the surrounding lung was emphysematous.
Gonfiotti et al254 reported a small randomised trial of hookwire versus radiotracer localisation for resection of nodules <2 cm in diameter (n=25 in each arm). The hookwire technique successfully located 84% of nodules compared with 96% with radiolabelling. Twenty-four per cent of patients in the hookwire group developed a pneumothorax compared with 4% in the radiolabelling group (none needed insertion of chest drain). No specific details were given of the randomisation process. No significant differences were reported between the two groups, reflecting the small sample size.
Surgical management of SSNs
Six case series (all from Japan) were identified specifically reporting outcomes for patients with SSNs undergoing surgical resection.256–261 The studies differed in their inclusion criteria, with some reporting outcomes for a combined sub-solid cohort (pGGNs and PSNs), other reports subdividing these two populations or reporting outcomes according to the ratio between consolidation and solid tumour, and other studies considering only small nodules (<15 or <20 mm). The surgical management differed also, with some case series reporting outcomes for lobectomy versus sublobar resection, whereas others compared segmentectomy and wedge resection.
The consistent finding between all case series was excellent long-term prognosis from sublobar resection with low rates of local recurrence. Thus Tsutani et al258 reported 3-year overall survival of 98.7% and 98.2% for ground-glass opacity dominant tumours (>50% ground-glass component) undergoing wedge resection (n=93) or segmentectomy (n=56), respectively. Three-year recurrence-free survival was 98.1% and 96.7%, respectively. Iwata et al259 described a case series of patients undergoing segmentectomy for NSCLC, which included 38 patients with ground-glass opacity dominant tumours (>50% ground-glass component), none of whom died in the follow-up period (mean follow-up 34.6 months). Yano et al261 described a case series of 810 patients with stage IA lung cancer with a consolidation/tumour ratio <0.25, reporting 5-year overall survival of 96.7% and disease-free survival of 96.5%.
Summary
Lobectomy appears to be associated with improved outcomes compared with sublobar resection in one RCT and three retrospective cohort studies of early-stage lung cancer, with one cohort study, part of a screening programme, showing equivalence. Anatomical segmentectomy was found to be oncologically equivalent to lobectomy in one retrospective cohort study and two retrospective propensity matched analyses. In a meta-analysis of observational studies, segmentectomy had worse survival for stage I and stage IA tumours, but equivalent survival for tumours ≤2 cm in diameter. One cohort study and two subgroup analyses have suggested worse outcome for wedge resection than for segmentectomy. Further prospective, randomised evidence would clarify the relative oncological performance of anatomical segmentectomy and lobectomy.
Localisation techniques seem to be a necessary aid for resection of smaller nodules and no one technique was identified as better than the others.
There is very limited evidence to suggest nodal dissection may not be necessary for nodules <10 mm, or for PSNs with a solid component <10 mm.
The evidence comparing lobar and sublobar resection in SSNs was limited to case series, but the excellent survival and low rates of recurrence from sublobar resections in these series suggest that there may be little to be gained by extending to a lobectomy. Unfortunately, there was inconsistency in the inclusion criteria reported relating to the cut-off point or inclusion of PSNs (eg, >50% ground-glass component vs consolidation/tumour ratio <0.25). Therefore the recommendation for sublobar resection can only be confidently made for pGGNs. In the absence of specific evidence for PSNs with consistent definitions, these should probably be surgically managed in the same way as solid nodules.
From the limited evidence available, the rate of lymph node metastases is low and related to size of the solid component in PSNs. The rate in pGGNs is negligible (see section Management of SSNs, sub-section lymph node metastases).
Evidence statements
VATS wedge resection with intraoperative frozen section has a high diagnostic sensitivity and specificity and generally low complication/mortality rates. Evidence level 3
Case series dealing with the problem of whether to proceed to surgical resection without preoperative biopsy are limited by confounding factors. Evidence level 3
Benign resection rates vary considerably between published case series. Evidence level 3
Excision biopsy of benign lesions has been shown to lead to change in treatment. Evidence level 3
Lobectomy for early-stage lung cancer was associated with reduced locoregional recurrence and probable improved survival compared with combined results for wedge resection and segmentectomy, in a randomised controlled trial. Patients were not diagnosed or staged contemporarily. Evidence level 2+
Anatomical segmentectomy is associated with reduced locoregional recurrence and possibly improved survival compared with non-anatomical wedge resection for early-stage lung cancer. Evidence level 2+
There is emerging evidence to demonstrate oncological equivalence of segmentectomy and lobectomy for tumours ≤2 cm in diameter. Evidence level 2+
There is no evidence to suggest superiority of any particular localisation technique for impalpable nodules, and no consistent criteria for when these should be used. Complications rates in some case series are high, although mostly relate to asymptomatic pneumothorax or pulmonary haemorrhage not requiring specific treatment. Evidence level 3
Despite heterogeneity in inclusion criteria and details of surgical management, case series of SSNs undergoing predominantly sublobar resection report very good long-term prognosis. Evidence level 3
Recommendations
Surgical resection of pulmonary nodules should preferentially be by VATS rather than by an open approach. Grade C
Offer lobectomy (to patients fit enough to undergo the procedure) as definitive management of a pulmonary nodule confirmed as lung cancer preoperatively or after wedge resection and intraoperative frozen section analysis during the same anaesthetic procedure. Grade C
Consider anatomical segmentectomy where preservation of functioning lung tissue may reduce the operative risk and improve physiological outcome. Grade D
Consider a diagnostic anatomical segmentectomy for nodules <2 cm in diameter without nodal disease when there has been no pathological confirmation and frozen section is not possible. Grade D
Use localisation techniques, depending on local availability and expertise, to facilitate limited resection of pulmonary nodules. Grade D
Consider sublobar resection for pGGNs deemed to require surgical resection owing to the excellent long-term prognosis and low risk of local relapse. Grade D
Prospective trials should compare complications and oncological outcomes from lobectomy versus anatomic segmentectomy in appropriately selected patients. RR
Non-surgical treatment without pathological confirmation OF MALIGNANCY
Key question: When should patients undergo non-surgical treatment without pathological confirmation of malignancy, what treatment modalities are appropriate and what are the harms?
The clinical and radiological factors that predict the likelihood of a pulmonary nodule being malignant are considered elsewhere in this guideline. The decision to refer a patient with a pulmonary nodule for biopsy (CT-guided, bronchoscopic or excision) reflects the pre-test likelihood of malignancy in addition to the potential risks associated with the biopsy techniques and patient preference. In some situations, patients with pulmonary nodules are referred for non-surgical treatments for presumed malignancy in the absence of pathological confirmation, either owing to clinical factors which preclude biopsy (such as severe emphysema), a previously inconclusive biopsy or patient choice. Evidence for when patients should undergo such treatments without pathological confirmation of malignancy was reviewed.
Evidence review
Outcome of patients treated without pathological confirmation
Four retrospective cohort studies specifically compared outcomes in patients with clinically diagnosed lung cancer (CDLC) versus patients with pathologically proven NSCLC.262–265 Summary details of the studies are shown in table 16. In all four studies, a clinical diagnosis of lung cancer was made on the basis of clinical characteristics, CT findings (including progressive enlargement) and FDG avidity on PET-CT scan, and three studies explicitly recorded the decision being made by multidisciplinary team consensus.262–264
Case series comparing outcomes in clinically diagnosed versus pathologically proven non-small cell lung cancer (NSCLC) treated with Stereotactic Ablative Body Radiotherapy
Takeda et al262 reported similar 3-year local control, progression-free survival, cause-specific survival and overall survival rates between CDLC and pathologically proven NSCLC, suggesting that few benign lesions were likely to have been included in the CDLC group. Patients with CDLC did not undergo histological confirmation because of negative biopsy results, increased risk of biopsy or patient choice. No quantitative model was used to define the CDLC group, limiting direct comparison with other studies. Verstegen et al263 reported a retrospective analysis from a prospectively collected institutional database for patients undergoing stereotactic ablative body radiotherapy (SABR) for proven or suspected stage I NSCLC. Outcomes (shown in table 16) were similar between the two groups. No quantitative prediction model was prospectively used to define the CDLC population, but retrospective use of prediction models from Swensen et al64 and Herder et al55 indicated a mean probability of malignancy of 92.5% (95% CI 91.8% to 93.3%) in the CDLC group and 94.8% (95% CI 94.2% to 95.4%) in the NSCLC group. Potential confounders included lower FEV1 and a higher proportion of T1 tumours in the CDLC group (although subgroup analysis was performed by T stage showing no differences in outcome). Additionally, the high proportion of patients with other previous malignancy (34%) raised the possibility that some presumed primary lung cancers were instead metastatic recurrence. A third retrospective cohort by Haidar et al264 reported outcomes for 55 patients undergoing SABR for early-stage lung cancer. The groups were well matched according to the limited clinical information supplied, and over a mean follow-up of 24 months, local control, actuarial 1- and 2-year survival and toxicities did not differ between the two groups. Finally, a retrospective cohort study by Stephans et al265 was identified which compared outcomes after two different SABR protocols for patients with stage I NSCLC. As a secondary analysis, outcomes were compared between clinically and pathologically diagnosed lung cancers, with no significant difference shown in overall survival (p=0.37). Patient characteristics for the NSCLC and CDLC groups were not reported, thereby limiting the ability to identify and assess possible confounding variables.
Of the four studies considered, three were explicit about potential confounding variables (and in Verstegen et al, attempted to minimise one confounding factor). All four studies were consistent in reporting similar outcomes between pathologically confirmed and CDLC treated with SABR, thereby tending to support the accuracy of clinically diagnosed cases when made by a multidisciplinary assessment of clinical and radiological criteria.
A recent study developed a decision tree and Markov model comparing the relative merits of surveillance, a PET-CT scan directed SABR strategy without histological confirmation and a PET-CT scan–biopsy–SABR strategy. The authors concluded that when there are concerns about biopsy-related morbidity, a PET scan–SABR policy is warranted when the pre-test probability of malignancy in pulmonary nodules exceeds 85%.165 However, the estimated complication rate might have been below that expected in people with comorbidities sufficient to make percutaneous biopsy a concern.
Treatment modalities
Publications relating to non-surgical treatment modalities for pulmonary nodules largely comprised case series and poor-quality retrospective cohort studies for patient populations with presumed or pathologically proved malignancy. The majority of studies considered RFA (n=25 studies)266–290 and SABR (n=14)262 ,265 ,291–302. Other publications reported outcomes from conventional radiotherapy (n=3),281 ,297 ,303 percutaneous cryotherapy (n=1),276 microwave ablation (n=2)304 ,305 inhaled corticosteroids (n=2)306 ,307 and antibiotics (n=1).308
Comparison of outcomes between the case series and cohort studies reviewed was severely limited by a number of problems. First, the reviewed studies considered heterogeneous populations, with some reporting outcomes from early-stage lung cancer only, the majority of reports considering a mixed population of lung cancer and metastases from other solid tumours, and two series considering metastases alone. Second, for case series of pulmonary metastases, there was significant variability in the tissue types considered and the number of metastatic lesions treated. Third, there was variability between studies in the proportion of patients with pathologically proven malignancy (lung cancer or other metastatic disease) and those where malignancy was presumed on the basis of clinical and radiological criteria. Fourth, where patients were treated for presumed malignancy without pathological confirmation, the criteria on which these presumed diagnoses were made were often not explicitly defined, and in the reports where they were defined often varied between cases series. Fifth, patients in some case series received systemic treatment together with local ablative treatment, thus confounding comparison of overall survival. Sixth, some series reported repeated treatments with ablative therapy after disease progression. Finally, the length of follow-up and the outcome parameters reported (which included overall survival, progression-free survival and disease-specific survival) varied between studies. Overall median survival was the most frequently reported parameter. For patients treated for presumed or proven lung cancer, overall median survival after RFA varied between 21 and 44 months, and after stereotactic radiotherapy varied between 24 and 54 months. However for the reasons described above direct comparison between these quoted figures is not appropriate.
While most studies reported outcomes from just one treatment modality, one multicentre and four single-centre retrospective cohort studies compared different treatment modalities for patients with pulmonary nodules presumed or pathologically proved to be early-stage NSCLC.
Verstegen et al309 performed a retrospective cohort analysis of patients treated for stage I–II NSCLC treated with VATS in six hospitals or SABR at a central hospital. Sixty-four cases of each (from 86 VATS and 527 SABR patients) were selected for analysis by investigators who were blinded to the outcome using a propensity score-matched analysis to reduce bias and confounding by matching on multiple variables. This excluded patients with severe COPD (GOLD score 4), previous or synchronous lung malignancy. Outcomes were analysed on an intention-to-treat basis with cases with an eventual benign diagnosis after VATS included. There was no difference in 3-year overall survival and freedom from progression rate. Local/regional control appeared to be better in the SABR group (p=0.037) and treatment-related toxicity appeared to be less in the SABR group. Shorter median follow-up in the VATS arm (16 vs 32 months) and operator experience with the VATS technique are both possible confounding factors.
Hsie et al281 retrospectively compared outcomes in 96 patients with pathologically confirmed stage I NSCLC not suitable for standard surgical resection (lobectomy/pneumonectomy) and treated with either limited surgical resection, RFA or conventional radical radiotherapy. Patients were assigned to treatment groups by clinician preference and the cohorts were not well matched. Significant confounding factors were worse performance status, lower FEV1 and greater use of long-term oxygen treatment in the radiotherapy group. Three-year survival was 63% for limited resection and 55% for radiotherapy (no quoted figure for RFA owing to small patient numbers), leading the authors to conclude that survival is reasonable for patients not suitable for standard surgical resection.
Crabtree et al294 retrospectively compared outcomes from 538 patients with stage I NSCLC treated with surgery or SABR in a single-centre study. Treatments were assigned by clinical preference and major confounders were differences between the cohorts in age, comorbidity, pulmonary function tests and the proportion of patients with pathological confirmation of malignancy (100% vs 80% for surgery vs SABR). Three-year overall survival was 68% and 32% for patients receiving surgery and SABR, respectively. Propensity analysis matching 57 high-risk surgical patients with 57 patients undergoing SABR showed no significant difference in disease-free survival (77% vs 86%) or overall survival (54% vs 38%) at 3 years.
Widder et al297 reported survival and quality of life data for two cohorts of patients treated with radiotherapy for inoperable stage I lung cancer. Twenty-seven patients treated with 3D conformal radiotherapy (CR) between 1994 and 1996 were compared with 202 patients treated with SABR between 2006 and 2009. Confounding factors included a lack of PET-CT imaging for the CR radiotherapy group, differences in rates of pathological confirmation (74% for the CR group vs 29% for the SABR group), and differences in performance status and age. Two-year overall survival was significantly better in the SABR than CR group (72% vs 48%, HR=2.6, 95% CI 1.5 to 4.8, p<0.01).
McGarry et al303 retrospectively compared outcomes for 128 patients with stage I/IIa NSCLC treated with surgery, radiotherapy (curative or palliative) and observation only, reporting median survival times of 46.2 months, 19.9 months and 14.2 months, respectively. The study demonstrates poor outcome from observation only for lung cancer, but the substantial confounding factors prevent meaningful comparison among groups. These confounders were not explicitly described in the report and no attempt was made to correct for them.
All five cohort studies are subject to selection bias and confounders. However, Verstegen et al made substantial efforts to try to compensate for these factors. Propensity score matching was used to reduce bias by matching patients according to numerous baseline variables, and analysis was performed on an intention-to-treat basis of clinical diagnosis, irrespective of the final histological result. The four single-centre cohort studies281 ,294 ,297 ,303 have significant selection bias and major confounding factors, which preclude direct comparison between outcomes in the groups studied.
Two RCTs assessed the effect of inhaled corticosteroids on nodule size in patients with persistent indeterminate pulmonary nodules. Veronesi et al306 randomised 202 patients to inhaled budesonide 800 µg twice a day or placebo for 12 months and showed no effect on pre-existing nodule size or the development of new nodules. van der Berg et al307 randomised patients with evidence of bronchial squamous metaplasia/dysplasia and either >20 pack-year history of smoking or previous history of lung or head and neck cancer to inhaled fluticasone. Again no effect was seen on either previously detected nodules or the development of new nodules.
Khokhar et al308 retrospectively reviewed patients with pulmonary nodules to see whether antibiotic prescription was associated with a change in CT appearance of nodules on a follow-up scan. No significant difference was seen in nodule appearance between 34 patients who received antibiotics and 109 patients who did not. The authors concluded that their data did not support routine use of antibiotics in patients found to have pulmonary nodules on CT scan. Significant selection bias and confounding variables were present.
Harms of treatments
The potential harms of treatments for presumed or proven malignant nodules have been reported in a number of case series. There was wide variability between studies in the frequency of reported complications, which related in part to the different criteria used to define/grade these complications. For example, some case series reported any haemoptysis following RFA treatment, whereas others reported only significant or major bleeding without specifically defining the relevant criteria. Similarly, pneumothoraces were classed as minor, major or sometimes only reported if intercostal drain insertion was required.
The frequency of complications in case series of patients treated with RFA266 ,267 ,271–273 ,275–278 ,280 ,281 ,283–287 ,289 ,290 ,304 ,305 was as follows: pneumothorax was the most commonly reported complication with rates varying from 9% to 54% in 19 case series. Other reported complications after RFA were bleeding (0.7–26%), pleural effusion (1.8–19%), pneumonia (1.8–12%), pleuritis (0.6–4.3%), lung abscess (0.3–3.1%), haemothorax (3.0%), severe pain (2%), bronchopleural fistula (1.5–1.8%), acute respiratory distress syndrome (1.5%) and pericardial tamponade (0.9%). Procedure-related mortality varied from 0% to 0.9% in seven case series, although one series reported a 30-day procedure-related mortality of 2.6%.289
Currently, in the UK, lung SABR is used only for peripheral lesions, and treatment is generally very well tolerated provided that organ at risk tolerances are adhered to. The main acute toxicities are fatigue, chest pain, skin erythema and cough, but these side effects are almost always mild (<grade 3) and self-limiting. Severe radiation pneumonitis —that is, grade 3 (requiring oxygen, severe symptoms±limiting self-care), is uncommon (range 1–2.8%) and grade 2 (symptomatic requiring medical intervention±limiting activities of daily living) or less ranges from 1% to 11%.310–312 The incidence of radiation pneumonitis does not appear to be higher in patients with poor pulmonary function.313–316 There is no strong evidence for absolute dose constraints, though in one large institutional series the risk of pneumonitis was higher in tumours with a large radiotherapy volume (internal target volume >145 ml) and when the contralateral lung receives a mean dose of >3.6 Gy.317 Guckenberger et al318 observed a dose relationship between ipsilateral lung dose and the development of radiation pneumonitis. Patients developing pneumonitis had an ipsilateral mean lung dose of 12.5±4.3 Gy compared with a mean dose of 9.9±5.8 Gy in unaffected patients. Ideally, the mean lung doses should be low in SABR and these figures are only a guide as they are based on relatively small numbers of patients and events. To minimise the risk of pneumonitis the UK SABR consortium has produced strict planning guidelines, which include limits for lung doses. Rib fracture and chest wall pain are the main late side effects with varying incidence depending on the dose fractionation scheme used. In one large single institutional series of >500 patients using a risk adaptive dose schedule with reduced doses for lesions close to or involving the chest wall, severe (grade 3 or higher) chest wall toxicity was rare ≤ 2% and grade 2 or less toxicity was <10%.291
Currently, SABR is not routinely used for lesions close to central mediastinal structures. This practice is based on a phase II study by Timmerman et al which showed that for central lesions treated with SABR the rates of severe toxicity (grade 3 or higher) were 46% at 2 years compared with 17% for peripheral lesions. Toxicities included decline in pulmonary function tests, pneumonias, pleural effusions, apnoea, skin reaction and treatment-related deaths.295 A more recent systematic review of SABR for central lesions showed lower rates of toxicity319 and a European Organisation for Research and Treatment of Cancer (EORTC) study started in November 2014 (trial reference EORTC -222113-08113-ROG-LCG) to evaluate SABR for central lesions.
Summary
Four retrospective case series provide evidence that for SABR, outcomes are similar for people with nodules that are not pathologically confirmed as malignant and for those with prior confirmation. Most evidence found was for SABR and RFA, although the variability in case definition, pathological confirmation, proportion of primary and secondary cancer, selection criteria and concomitant treatment made comparison inappropriate. One study used propensity score matching in a comparison of SABR and VATS for stage I–II lung cancer and showed a similar 3-year outcome. Non-surgical treatments show marked variation in the frequency of harms, something that is likely to be strongly influenced by case selection and the technique employed.
Evidence statements
Where biopsy of a pulmonary nodule is either non-diagnostic or not possible, patients diagnosed with clinical lung cancer by a multidisciplinary assessment on the basis of clinical and radiological criteria appear to have similar outcomes to patients with pathological confirmation of malignancy following SABR. Evidence level 2+
Inhaled corticosteroids have no effect on pre-existing nodule size or on the development of new pulmonary nodules on CT scan. Evidence level 1+
There is no evidence to support routine use of antibiotics in the management of indeterminate pulmonary nodules. Evidence level 3
Treatment of central lesions with SABR has been associated with higher rates of toxicity than with SABR for peripheral lesions. This may be alleviated by using risk-adapted dose schedules and is the subject of ongoing clinical trials. Evidence level 3
In the treatment of pulmonary nodules, proved or presumed to be malignant, SABR and RFA have low rates of acute mortality. Reported rates of morbidity are highly variable. Evidence level 3
Recommendations
For people who are unfit for surgery who have pulmonary nodule(s) with a high probability of malignancy, where biopsy is non-diagnostic or not possible, consider treatment with SABR or RFA, if technically suitable. Grade C
For people who are unfit for surgery who have pulmonary nodule(s) with a high probability of malignancy, where biopsy is non-diagnostic or not possible, consider treatment with conventional radical radiotherapy if not suitable for SABR or RFA. Grade D
Do not use inhaled corticosteroids in the management of indeterminate pulmonary nodules. Grade B
Do not use antibiotics in the management of indeterminate pulmonary nodules. Grade D
Consider prospective randomised trials of local treatments for pathologically proved or clinically diagnosed early-stage lung cancer and pulmonary oligometastases. RR
For prospective randomised trials of interventions for pathologically proved or clinically diagnosed early-stage lung cancer include assessment of harms. RR
Information and support
Key question: What are the information and support needs of patients with pulmonary nodules?
Patients who have pulmonary nodules detected by whatever method may be concerned or anxious about the implications for their health. A clear understanding is essential for patients and their carers to make informed choices about the options for management. They may need professional support when interpreting information. The NICE guideline on the management of lung cancer (CG121) made detailed recommendations on the information and support needs of patients, some of which will be applicable to pulmonary nodules, especially those that have a high probability of being malignant. The National Lung Cancer Forum for Nurses has emphasised the key role of the lung clinical nurse specialist in providing information and support to patients and has produced specific guidance for managing patients with lung nodules (available at: http://www.nlcfn.org.uk).
Evidence review
The search retrieved four papers on the psychological consequences of finding pulmonary nodules but only three were of sufficient quality to be included in the review. Lemonnier et al compared health-related quality of life measures in 171 patients with pulmonary nodules 1–3 cm in diameter with those of the general population with a similar age.320 They found that patients with pulmonary nodules had worse self-reported health status (as measured by a reduction in score on the Short Form 36 Health Survey of between 11 and 30 points), which was most marked for older people and those who were smokers. Furthermore, patients with malignant nodules had scores that were 5–15 points lower than those with non-malignant nodules. The study did not examine intervention for the lower scores. van den Bergh et al,321 in the context of the NELSON study, compared health-related quality of life measures in subjects who had CTs with those who did not and in those within the CT screen group who had nodules detected with those who did not. They found that there was no difference in scores before the screen compared with the second annual screen time-point but that after 1 year there was a transient increase in the impact of event scale in subjects with an indeterminate nodule. This limited evidence demonstrates in two different settings that the finding of pulmonary nodules does affect quality of life, but appeared to be minimal in the highly organised environment of NELSON where there were clear protocols and detailed patient information. Wiener et al,322 in a qualitative study involving 22 patients with indeterminate pulmonary nodules from Boston USA, found that almost all patients, when first informed about a pulmonary nodule thought that they had cancer. This perception, and the distress caused, was strongly influenced by the information given. Patients were frustrated not to be given adequate information and noted that many healthcare providers did not inform them about cancer risk. The authors set out seven patient-endorsed communication strategies as a suggested guide for communication. This included directly addressing the risk of cancer, ensuring there is a verbal explanation (not just a letter) and avoiding minimising or dismissive language.
Evidence statements
The finding of a pulmonary nodule has an adverse impact on quality of life. Evidence level 2++
Patients commonly assume that the finding of a nodule means that they have cancer. Evidence level Qualitative
Patients may be frustrated if healthcare providers fail to deal with their concerns about cancer or potential adverse effects of surveillance. Evidence level Qualitative
Effective communication by the healthcare team can reduce the impact on quality of life after diagnosis of a pulmonary nodule. Evidence level Qualitative
Recommendations
Offer accurate and understandable information to patients and carers about the probability of malignancy of the pulmonary nodule. Grade D
Ensure patients have the opportunity to discuss concerns about lung cancer and surveillance regimens. Grade D
Offer patients the choice of seeing a lung cancer nurse specialist where the probability of malignancy is high or when patients are anxious about the possibility of having lung cancer. Grade D
Ensure that clear written and verbal information is available on follow-up schedules and the number of repeat CT scans required. Grade D
Explain the risks and benefits of investigations and treatment. Where appropriate offer a choice of management. Grade D
Inform patients who remain at high risk of developing malignancy about the warning symptoms of lung cancer at the start of observation and at discharge from follow-up. Grade D
Emphasise to patients the importance of smoking cessation and offer referral to smoking cessation services. Grade D
Technical aspects of the imaging of pulmonary nodules
Key question: What are the technical imaging considerations relating to nodule detection and assessment by CXR, CT and PET-CT?
Evidence review
Advances in imaging technology
Imaging technology is improving rapidly and evidence reviewed for the purposes of guideline development often reports on technology that has effectively become out of date, although may still be in use clinically. Thus recommendations have to be interpreted in the light of current technology.
The most significant technological changes over the lifetime of this guideline may be:
The introduction of CT scanners using iterative reconstruction that will substantially reduce the effective radiation dose. Possible consequences are a lowering of the threshold for performing CT scans, thus increasing the number of incidentally detected nodules, and a more permissive approach to follow-up examinations.
The increased use of perfusion CT to assess nodule vascularity and perfusion. This may have implications for prognostication, and differentiation between benign and malignant nodules
Improved image data reconstruction, such as nodule surface textural analysis. This may aid differentiation of benign from malignant nodules.
Changes in PET-CT scanner construction and image processing. This is likely to produce substantial improvements in the accuracy of characterisation of pulmonary nodules. Appendix 2 shows specific likely future developments in PET-CT.
The method of reporting positivity in PET-CT may be optimised; methods may include modification of absolute SUV cut-off points according to nodule type. There may be different values for solid and SSNs and nodule size with lower levels for nodules with greater ground-glass components and for smaller nodules.
Method of detection
Extensive publications on the detection of pulmonary nodules using CXR and CT scan are available. These include new techniques to improve detection by CXR, such as subtraction methods and computer-aided detection (CAD), as well as improved detection by CT in comparison with CXR. The latter includes CAD in CT and reconstruction algorithms such as MPR, maximum intensity projection (MIP), and volume rendering (VR). Aside from the reconstruction algorithms none of these techniques are in use in routine clinical practice and remain areas for research. These guidelines focus on nodule characterisation once detected but it is known that nodules are better detected and characterised if a CT scan maximum section thickness of 1.25 mm323–325 is used and if they are reported using software reconstruction algorithms including MPR, or MIP or VR review.326–337
Factors influencing the accuracy of measurements
Nodule measurement
Eight studies investigated a variety of technical scanning parameters that affect nodule measurement: section thickness, reconstruction algorithms, scan dose, the use of intravenous contrast, and nodule size and shape. Table 17 illustrates some of the technical factors and a more detailed review of the studies can be found in appendix 2.
Selected technical factors affecting pulmonary nodule measurement
Growth measurement
Growth measurement is dependent on the technical factors shown in table 17. Volume measurements have been shown to be more reproducible that manual calliper measurements as reviewed in the section ‘Imaging follow-up’. In addition to these, a number of software packages have achieved high levels of reproducibility in synthetic nodules and are therefore potentially used for assessment of growth. A key factor is the ability of the software to correctly segment the nodule. Volume is calculated using a series of ‘segments’ of the total volume added together and it is important that these accurately reflect the borders of the nodule. A number of algorithms have been shown to do this accurately but reproducibility decreases as the nodule size decreases. As noted above the use of intravenous contrast can increase volume measurement and therefore may alter growth estimates. The influence of the duration of follow-up has already been reviewed in the section ‘Imaging follow-up’. A more detailed review is given in appendix 2.
Nodule size, shape and position
Table 18 summarises the important factors that influence the accuracy of measurements at baseline and when measuring growth. As expected, nodules that are smaller or have a more complex shape are more difficult to measure and therefore growth detection is more challenging. This is also the case if they are next to other structures such as blood vessels and the pleura. Similarly, if the nodule is moving it is more difficult to measure. A more detailed description of studies reviewed appear in appendix 2 and the section ‘Imaging follow-up’.
Patient related factors that may influence accuracy of nodule measurement
Low-dose CT
Hein et al,347 using ultra-low-dose and standard-dose CT scans in 20 patients with 202 nodules with a mean diameter of 11 mm, demonstrated no difference in interscan or interobserver variability in measured nodule volumes, suggesting that low-dose CT scans used to follow up nodules are acceptable and will not result in false changes in nodule volumes. Other studies have confirmed this finding and shown that the use of low-dose CT does not affect nodule detection or volumetric measurement.348–350
Evidence statement
Nodule detection and characterisation is best achieved using a maximum section thickness of 1.25 mm, contiguous section CT, and use should be made of MPR, or MIP or VR. Evidence level 2+
Different software programmes use different algorithms to segment and calculate nodule volumes, and the measurements from each are not interchangeable. Evidence level 2+
Nodule volume measurement success and accuracy are affected by nodule position (juxtapleural, juxtacardiac) and the depth of inspiration. Evidence level 2+
The reliability of detection of nodule growth is increased with greater time between scans. Evidence level 2+
The data from different scanners are comparable when volumes are calculated using the same software. Evidence level 3
Recommendations
When CT scans are performed that include the chest, where nodule detection is of potential importance, use a maximum section thickness of 1.25 mm. Grade C
Use low radiation dose CT with a maximum section thickness of 1.25 mm in follow-up imaging. Grade C
Use MIP or VR to improve nodule detection and characterisation. Grade C
Use diameter measurements where volumetry is not possible or where there is clear evidence of marked growth. (Grade D)
When reporting growth, take into account factors that may reduce accuracy, such as nodule shape and position and interval between scans. Grade D
Ensure a radiologist or radiographer checks that the nodule has been accurately segmented. Grade D
Summary of research recommendations
Nodule malignancy risk prediction models should be validated in patients with known extra pulmonary cancer.
Further analysis of variation in volumetry measurements by different software packages should be undertaken and methods developed for standardisation.
Further research is needed into the most effective follow-up pathway in low to medium risk patients and for those with pGGNs.
Further research should be undertaken into the use of PET-CT in the evaluation of pGGNs using lower SUV cut-off values.
Research should be undertaken into the application of new and existing tumour markers in the evaluation of pulmonary nodules.
Prospective trials should compare complications and oncological outcomes from lobectomy versus anatomic segmentectomy in appropriately selected patients.
Prospective randomised trials of local treatments for pathologically proved or clinically diagnosed early-stage lung cancer and pulmonary oligometastases should be considered.
Prospective randomised trials of interventions for pathologically proved or clinically diagnosed early-stage lung cancer should include assessment of harms.
Conclusion
This guideline is based on an extensive and detailed review of the published literature relating to the management of pulmonary nodules. Until the turn of this century there were relatively few research studies on this subject with most publications being review articles and expert opinion pieces. More recently, there have been many more studies and this is reflected by the fact that half of the articles referenced were published from 2010 onwards and almost a third since 2012. This has enabled evidence-based development of algorithms for the management of pulmonary nodules that should lead to more efficient use of resources and consistent outcomes for patients. The GDG recognised that there remain uncertainties about the merits of longer term follow-up of some pulmonary nodules and have therefore recommended that a record of people with nodules is kept in case new evidence suggests benefit from longer term follow-up, particularly those nodules that may represent more indolent cancers.
Appendix 1: Prediction models and volume doubling time (VDT) calculation
Risk prediction calculators and a VDT calculator are available on the BTS website at:
https://www.brit-thoracic.org.uk/guidelines-and-quality-standards/pulmonary-nodules/
These risk predication calculators are provided to assist clinicians in the diagnosis and management of pulmonary nodules—the information provided should be used in conjunction with the BTS guideline for the investigation and management of pulmonary nodules.
Probability of malignancy following CT (Brock model): This calculator estimates the probability that a lung nodule described above will be diagnosed as cancer within a 2–4-year follow-up period.46
Probability of malignancy following PET-CT (Herder model): This calculator estimates the probability that a lung nodule described above will be diagnosed as cancer.55
Disclaimer
The risk prediction calculator tool (‘RPCT)’ functionality made available on the above webpage is provided ‘as is’ with no warranties whatsoever.
The British Thoracic Society, on its own behalf and on behalf of all of its service providers associated with the RPCT (‘BTS’) and its licensors, hereby expressly exclude to the fullest extent permitted by law all express, implied, and statutory warranties and conditions including, without limitation, warranties and conditions of merchantability, fitness for any particular purpose, non-infringement of proprietary rights, security, reliability, timeliness and performance.
Users hereby acknowledge and agree that (a) their use of the RPCT is entirely at their own discretion and risk; (b) BTS excludes all liability for any loss or damage arising from such use to the fullest extent permissible by law; (c) the RPCT is for information purposes only, you are not entitled to base any treatment or other medical decision on information obtained from the RPCT and you agree to be solely responsible for, and to indemnify BTS and hold BTS harmless against, any loss or damage arising from any such decision.
Risk prediction calculators for use on a smartphone/tablet may be available in due course.
Appendix 2: Detail of technical considerations in radiology
Likely changes in PET-CT technology
Improved detectors used for the PET component (potentially bismuth germinate Bi4Ge3O12, lutetium oxyorthosilicate doped with cerium Lu2SiO5:Ce, or solid state).
Smaller crystal sizes in non-solid state detectors, providing increased spatial resolution.
Solid state detectors, although not currently in use in clinical practice, have the potential advantage of increased spatial and signal timing resolution with improved signal-to-noise ratio.
3D acquisition that means detection is no longer restricted to a single slice but is performed over the whole detector length, resulting in substantially increased sensitivity, but with increased scatter detection.
Image processing algorithms. Currently and historically, image reconstruction algorithms have used flight-ordered subsets expectation maximisation (time of flight-OSEM) reconstruction, but new algorithms such as Bayesian penalised likelihood reconstruction algorithms and others including spatial point-spread correction, appear able to detect smaller nodules and provide more accurate measures of metabolic activity.
The use of respiratory gating. Although not widely used, owing to its complexity and time required for set-up, respiratory gating may provide a more accurate assessment of the metabolic activity of small nodules by effectively reducing the effect of partial voluming secondary to respiratory motion.
Review of selected studies of technical factors in nodule measurement
Honda et al338 investigated changes in volumetric measurement using different reconstruction parameters in 39 nodules of <20 mm. Variable slice thickness, field of view, reconstruction algorithm and reconstruction intervals were investigated. The nodules ranged from 4 to 16 mm in diameter. High spatial frequency and bone algorithms increased the nodule volumes, as did non-overlapping reconstruction.
Nietert et al339 using a lung phantom assessed the accuracy of automated volumetry on 1624 estimates using section thicknesses of 0.625, 1.25, 2.50 and 5.00 mm. The artificial nodules ranged in diameter from 3.00 to 15.9 mm in average diameter. They simulated growth scenarios of 4–5 mm, 4–6 mm, 4–8 mm, 5–6 mm and 9–10 mm. The CIs around growth and VDT were extremely wide for 2.50 mm and 5.00 mm.
Petrou et al340 analysed the effect of different section thicknesses, 1.25 mm, 2.5 mm and 5.00 mm, and reconstruction intervals on volumetry measurements for 75 nodules. Volume variability between the different section thicknesses was correlated with nodule diameter, shape and margin. There was substantial variation on individual nodules, with significant variation for nodules ≤10 mm, and spiculated nodules compared with smooth nodules.
Rampinelli et al351 assessed the reliability of automated volume calculation on 83 nodules scanned during the same session using two low-dose and two standard-dose CT scans on two separate breath holds. They correlated nodule volume change with diameter, percentage of emphysema, nodule site and morphology. The variation in nodule volume was greatest for low-dose scans (−38%±60%) compared with standard-dose CT scans (−27%±40%). No significant differences were obtained for nodule site, diameter, morphology or degree of emphysema. Kim et al, in a more recent study found no influence of radiation dose on the accuracy of volume measurement.352
Sinsuat et al325 analysed the ability of six radiologists to both detect pulmonary nodules and agree a diagnosis on CT sections of 2 mm and 10 mm. Nodules were more likely not to be detected when small (<5 mm) on the thicker sections, and were more likely to be misdiagnosed on the 10 mm sections.
Goo et al assessed the effect of various reconstruction parameters and segmentation thresholds on four acrylic spheres of 3.2 mm, 4.8 mm, 6.4 mm and 12.7 mm.337 Images were reconstructed at section thicknesses of 0.75, 1.0, 2.0, 3.0 and 5.0 mm, and different reconstruction intervals. Nodules were segmented using different segmentation thresholds. The absolute percentage error of volume measurement is lowest using thin sections, with errors progressively increasing with decreasing nodule size.
Honda et al342 imaged 60 nodules in 60 patients before and after intravenous contrast, and used both bone and soft tissue reconstruction algorithms. They showed that the measured volumes were greatest using the bone algorithm and after contrast. The mean difference between the reconstruction algorithms before contrast was 33 mm3 with the median volumes being 817 mm3 and 812 mm3, respectively, and 24 mm3 with the median volumes after contrast being 887 mm3 and 855 mm3, respectively.
Petkovska et al341 assessed the effect of lung volume on nodule size measured using automated volumetry in 75 indeterminate nodules scanned at total lung capacity and residual volume. Both nodule diameter and volumetry varied non-uniformly between total lung capacity and residual volume, with a 16.8% mean change in absolute volume across all nodules, with no significant difference between nodules <5 mm and ≥5 mm.
Review of selected studies on the technical factors influencing nodule growth
Yankelevitz et al353 assessed the accuracy of automated volumetric measurements of synthetic nodules, and then nodules in 13 patients, to estimate growth rates. Synthetic spheres were scanned twice as pairs of different sizes, before and after being altered in shape, and then spheres of varying diameters. In 13 patients, nodules with diameters <10 mm, range 3.9–9.3 mm, were scanned twice at different intervals. The software could accurately measure the volumes in the synthetic nodules to within ±3%. Five of the 13 nodules were proved to be malignant and all had doubling times <177 days, with the benign nodules having doubling times of >396 days.
Ashraf et al354 assessed the impact of using different segmentation algorithms within the same software to calculate nodule growth. Using 188 nodules >5 mm in diameter from a lung cancer screening study, baseline and follow-up scans were independently read by two readers. Nodules were correctly segmented and measured in 72% of nodules, with 80% of these cases occurring when the same algorithms were chosen. The volumetric measurements were identical in 50% using the same algorithm, with a difference of >25% in 4%. Using different algorithms, 83% of measurements resulted in a difference of >5%.
Das et al355 scanned a lung phantom with nodules of different size using scanners from the four main CT vendors (Siemens, GE, Philips, Toshiba); different doses—routine and low dose—and thin and thick collimations were used. Average percentage volume errors (APEs) were calculated and compared. The mean APE for all nodules was 8.4%, and did not differ significantly amongst the scanners.
de Hoop et al75 evaluated 214 nodules in 20 patients with pulmonary metastases, using six semiautomated volume software packages. Each patient underwent two low-dose CT scans separated by the time it takes to get on and off a CT scanner, to enable zero growth to be simulated. Adequate segmentation was achieved in 71–86% of nodules, with variability in volumetry between 16.4% and 22.3%. Rampinelli et al356 assessed the effect of intravenous contrast on volumetric calculation on 35 pulmonary nodules, comparing scans performed without contrast (unenhanced) with scans performed after injected contrast at 30, 60, 120, 180 and 300 s delays. Contrast-enhanced scans resulted in significantly larger volumes than unenhanced scans, with variations in volume of 4–7%.
Characteristics of nodules that may influence the accuracy of measurement and growth estimation
Gietema et al assessed 218 nodules in 20 patients.343 Non-calcified nodules between 15 mm3 and 500 mm3 not abutting the pleura or a vessel were measured on two occasions by low-dose CT using the standard method for simulating zero growth of scanning the patient after they have got on and off the scanner. They showed that accurate segmentation is more difficult for nodules that are non-spherical and of irregular shape. They also confirmed that the degree of inspiration affects the measured volume, with an increase in inspiratory effort leading to a decrease in lung nodule volume. They suggest that the threshold for determining a genuine increase in nodule volume is 15% for a spherical lesion, and 30% for an irregular nodule.
Ko et al79 examined the problem of reliability of growth rate detection using semiautomated software. In 123 nodules presumed to be stable in 59 patients followed up over 2.0–8.5 years, in comparison with eight nodules proved to be malignant, they found that longer duration improved the reliability of the volumetric measures, with less reliable volumetry for peripheral and juxtapleural lesions. pGGNs and PSNs were measured as reliably as solid nodules, as were nodules of < or >5 mm.
Korst et al78 compared the effect on the decision to biopsy using 2D measurements of pulmonary nodule growth in comparison with automated volumetric measurement on 87 nodules in 69 patients over a 27-month period. Fifty-five of the nodules were <1 cm, 55 were irregular and 7 part solid. Volumetric growth rates correlated with 2D measurements, r=0.69, with correlation worsening in irregular nodules and those assessed with an interval <100 days. Twenty lung cancers were diagnosed, and eight of these had periods of enlargement and shrinkage over time. Of the seven patients for whom biopsy was recommended on the basis of volumetric growth, three had cancer.
Kostis et al83 assessed the reliability of automated nodule volumetry in 115 solid nodules, 75 < 5 mm in diameter, from a lung cancer screening programme that were stable when assessed subjectively and on bidimensional measurement. They excluded juxtapleural nodules. They found that apparent growth was greatest in small nodules <5 mm in diameter, those with shorter follow-up and those with artefacts affecting image quality.
Marchianò et al35 analysed the reliability of semiautomated volumetry in 233 nodules >4.8 mm in diameter from a lung cancer screening programme. Non-solid, part solid and juxtapleural nodules were excluded. They assumed that all nodules that appeared stable on three consecutive scans with a follow-up of 12 months were benign. They showed that 95% of the nodules volumes fluctuated in the ±27% range, with 70% of all measurements having a volume variation range <10%, and only two nodules had an increase of >25%.
Gietema et al357 in a study assessing interobserver variability in nodules detected in the NELSON lung cancer screening trial, showed that two observers independently measuring the volume of nodules detected had good correlation for most nodules, with discrepant results obtained in 11%. In 3.7% the volume discrepancy was >10%, with the most common cause being incomplete segmentation.
Goodman et al345 evaluated volumetric nodule software in 50 nodules scanned using a zero growth model on three occasions, with nodules up to 20 mm in diameter included. They demonstrated minimal interobserver variability, but segmentation failed in six patients, eight patients had completely calcified nodules and variability in nodule volume was greatest in small nodules <9 mm.
Revel et al358 assessed the percentage of successful segmentation, intraobserver variability, inter-reader agreement among three readers and the repeatability of volume calculation using automated volumetry software in 54 solid non-calcified nodules measuring 5–18 mm in diameter, with 12 nodules <5 mm. Nodule segmentation was successful in 96%, failing in two juxtapleural nodules, with excellent repeatability. There was no variation in measurements in 67% of the nodules, with minimal variation in the remaining nodules, and excellent inter-reader agreement.
Wang et al344 retrospectively assessed the effect of nodule morphology, size and location on semiautomated volume measurement variability in 4225 nodules in 2239 patients scanned in a lung cancer screening programme performed by two readers. There was complete agreement for the calculated volume in 86% of the nodules, with large disagreement, demonstrating a relative volume difference of ≥15% in only 4% of the nodules. The greatest disagreement was seen in irregular and juxtavascular nodules. There was complete agreement in 91% of purely intraparenchymal nodules but only 70% for juxtavascular nodules, and 90% for smooth nodules but only 34% for irregular nodules.
Wormanns et al359 assessed the repeatability of automated volumetric software in 151 nodules scanned using a zero growth model in 10 patients. Two observers performed measurements on 50 randomly selected nodules. Segmentation was possible in all nodules. Interobserver agreement, −5.5% to 6.6% and intraobserver agreement, −3.9% to 5.7%, were excellent. The mean volume measurement error was 0.7%, with a 95% range of observed errors of −20.4% to 21.9%. Jennings et al compared diameter and cross-sectional area with volumetric measurements to assess nodule growth in 63 patients with stage 1 lung cancer, with a median nodule diameter of 19.3 mm.86 Each nodule was measured on their first and second CT scans as a minimum. Diameter and area were highly correlated with volume measurements, but nodule diameter was inaccurately assessed when compared with growth on 37% of occasions. Manual diameter measurements were more inaccurate than automated measurement.
Revel et al358 evaluated the intra- and interobserver variability of 2D CT measurements of 54 pulmonary nodules ranging in size from 3 to 18 mm. Three radiologists independently measured each nodule on three occasions. There were significant variations in the diameters measured. The variations were of sufficient size, that to be 95% sure that a nodule had genuinely increased in size, an increase in diameter of a nodule would have to be >1.70 mm.
Boll et al346 assessed 73 nodules in 30 patients during the cardiac cycle, repeating the assessment three times, and compared the results with measurements from phantoms. Cardiac motion causes variation in nodule volume estimation, with small nodules and those closest to the heart most affected.
Appendix 3: Service organisation
Effective management of people with pulmonary nodules is best achieved by professionals familiar with the latest recommendations, as provided in this guideline. Nodules are common and therefore justify a systematic approach. The majority of nodules detected will have a low probability of malignancy and will be suitable for imaging follow-up. People with these nodules will require a clear explanation about what a pulmonary nodule may be and the way in which it will be followed up. The GDG recommends that when a nodule is detected, a CT should be performed where it has not already been done. The findings should be managed according to this guideline in a structured fashion suited to the local institution. The GDG did not want to be prescriptive about the design of the service but noted that a structured approach may be achieved by reviewing the CT findings at an imaging meeting with recommendations made directly to the referring clinician or at a dedicated nodule multidisciplinary team (MDT).
Figure 11 shows an example of a dedicated nodule service where the nodule MDT provides central coordination of management of people with nodules. The advantages of this include greater efficiency, use of expert clinicians, data collection, a greater chance of using the latest guidance and potentially, a reduction in disruption of other meetings and the need for informal discussion. The principal disadvantage is the cost associated with the extra MDT meeting and staff time.

An example of a pulmonary nodule service pathway. MDT, multidisciplinary team.
Whichever service design is employed it is important that it facilitates accurate implementation of the guideline, including the important elements of communication with the patient. This may be by a face-to-face appointment or by the telephone when patients are offered appointments according to their needs. The service should include the radiological standards of volumetry, low radiation dose and thin-section (1.25 mm) CT for SSN follow-up. There should be written communication with primary care.
References
- ↵
- ↵
- ↵
- ↵
- ↵
- ↵
- ↵
- ↵
- ↵
- ↵
- ↵
- ↵
- ↵
- ↵
- ↵
- ↵
- ↵
- ↵
- ↵
- ↵
- ↵
- ↵
- ↵
- ↵
- ↵
- ↵
- ↵
- ↵
- ↵
- ↵
- ↵
- ↵
- ↵
- ↵
- ↵
- ↵
- ↵
- ↵
- ↵
- ↵
- ↵
- ↵
- ↵
- ↵
- ↵
- ↵
- ↵
- ↵
- ↵
- ↵
- ↵
- ↵
- ↵
- ↵
- ↵
- ↵
- ↵
- ↵
- ↵
- ↵
- ↵
- ↵
- ↵
- ↵
- ↵
- ↵
- ↵
- ↵
- ↵
- ↵
- ↵
- ↵
- ↵
- ↵
- ↵
- ↵
- ↵
- ↵
- ↵
- ↵
- ↵
- ↵
- ↵
- ↵
- ↵
- ↵
- ↵
- ↵
- ↵
- ↵
- ↵
- ↵
- ↵
- ↵
- ↵
- ↵
- ↵
- ↵
- ↵
- ↵
- ↵
- ↵
- ↵
- ↵
- ↵
- ↵
- ↵
- ↵
- ↵
- ↵
- ↵
- ↵
- ↵
- ↵
- ↵
- ↵
- ↵
- ↵
- ↵
- ↵
- ↵
- ↵
- ↵
- ↵
- ↵
- ↵
- ↵
- ↵
- ↵
- ↵
- ↵
- ↵
- ↵
- ↵
- ↵
- ↵
- ↵
- ↵
- ↵
- ↵
- ↵
- ↵
- ↵
- ↵
- ↵
- ↵
- ↵
- ↵
- ↵
- ↵
- ↵
- ↵
- ↵
- ↵
- ↵
- ↵
- ↵
- ↵
- ↵
- ↵
- ↵
- ↵
- ↵
- ↵
- ↵
- ↵
- ↵
- ↵
- ↵
- ↵
- ↵
- ↵
- ↵
- ↵
- ↵
- ↵
- ↵
- ↵
- ↵
- ↵
- ↵
- ↵
- ↵
- ↵
- ↵
- ↵
- ↵
- ↵
- ↵
- ↵
- ↵
- ↵
- ↵
- ↵
- ↵
- ↵
- ↵
- ↵
- ↵
- ↵
- ↵
- ↵
- ↵
- ↵
- ↵
- ↵
- ↵
- ↵
- ↵
- ↵
- ↵
- ↵
- ↵
- ↵
- ↵
- ↵
- ↵
- ↵
- ↵
- ↵
- ↵
- ↵
- ↵
- ↵
- ↵
- ↵
- ↵
- ↵
- ↵
- ↵
- ↵
- ↵
- ↵
- ↵
- ↵
- ↵
- ↵
- ↵
- ↵
- ↵
- ↵
- ↵
- ↵
- ↵
- ↵
- ↵
- ↵
- ↵
- ↵
- ↵
- ↵
- ↵
- ↵
- ↵
- ↵
- ↵
- ↵
- ↵
- ↵
- ↵
- ↵
- ↵
- ↵
- ↵
- ↵
- ↵
- ↵
- ↵
- ↵
- ↵
- ↵
- ↵
- ↵
- ↵
- ↵
- ↵
- ↵
- ↵
- ↵
- ↵
- ↵
- ↵
- ↵
- ↵
- ↵
- ↵
- ↵
- ↵
- ↵
- ↵
- ↵
- ↵
- ↵
- ↵
- ↵
- ↵
- ↵
- ↵
- ↵
- ↵
- ↵
- ↵
- ↵
- ↵
- ↵
- ↵
- ↵
- ↵
- ↵
- ↵
- ↵
- ↵
- ↵
- ↵
- ↵
- ↵
- ↵
- ↵
- ↵
- ↵
- ↵
- ↵
- ↵
- ↵
- ↵
- ↵
- ↵
- ↵
- ↵
- ↵
- ↵
- ↵
- ↵
- ↵
- ↵
- ↵
- ↵
- ↵
- ↵
- ↵
- ↵
- ↵
- ↵
- ↵
- ↵
- ↵
- ↵
- ↵
- ↵
- ↵
- ↵
Supplementary materials
Supplementary Data
This web only file has been produced by the BMJ Publishing Group from an electronic file supplied by the author(s) and has not been edited for content.
- Data supplement 1 - Online appendix 1
- Data supplement 2 - Online appendix 2
- Data supplement 3 - Online appendix 3
- Data supplement 4 - Online appendix 4
Footnotes
Contributors MEJC and DRB led the planning and conduct of the work that produced the guideline. MEJC, DRB, ARA, SB, PC, JD, KF, FG, RG, PM, MP, KR, MS, DW and IW contributed to the review of evidence, drafted the guideline document and approved the final document. MEJC and DRB are responsible for the overall publication.
Competing interests None declared.
Provenance and peer review Not commissioned; internally peer reviewed.
Linked Articles
- BTS guidelines
- Editorial
- Chest clinic
- Correction