Article Text

Abstract
Background Airway remodelling in bronchial asthma (BA) and COPD has been quantitatively assessed by analysing the airway wall area and the luminal area on cross-sectional CT images. To date, there have been no reports on assessment of the longitudinal structure of the airway lumen.
Methods Quantitative airway analysis using CT was performed on three groups consisting of 29 patients with BA, 58 patients with COPD and 59 healthy controls. To assess the longitudinal shape irregularity of the airway lumen, new quantitative CT parameters, validated by a phantom study, were established. The internal radii of imaginary inscribed spheres in the airway lumen were measured as a function of distance from the level of the carina to the fifth-order branches of the right posterior basal bronchus. The gaps of these radii from the regression line were calculated as parameters to reflect the longitudinal airway lumen shape irregularity. These new parameters were compared among the study groups as well as with the conventional parameters of airway wall thickening and luminal area.
Results Longitudinal airway lumen shape irregularity was significantly greater in patients with COPD than in those with BA and healthy controls. Wall thickening was significantly greater, and luminal area smaller, in patients with BA than in those with COPD and healthy controls. These results were consistent even among the BA and COPD subgroups with similar airflow limitation.
Conclusions The combination of cross-sectional and longitudinal airway structure analyses using CT images may suggest differences in the characteristics of airway remodelling between COPD and asthma.
- Imaging/CT MRI etc
- Asthma
Statistics from Altmetric.com
Key messages
What is the key question?
Is there any difference between bronchial asthma and COPD with regard to the longitudinal shape irregularity of the airway lumen?
What is the bottom line?
The longitudinal shape irregularity of the airway lumen was significantly greater in patients with COPD than in patients with bronchial asthma and controls, whereas wall thickening was significantly greater in patients with bronchial asthma than in those with COPD and controls.
Why read on?
This is the first report to investigate the longitudinal structure of the airway lumen using quantitative CT analysis to assess airway remodelling in obstructive pulmonary diseases.
Introduction
COPD is characterised by persistent airflow limitation due to a combination of airway disease and parenchymal destruction (emphysema).1 Chest CT is a useful technique for assessing these structural changes in vivo. Pulmonary emphysema is recognised on CT images as an area with low attenuation. Numerous studies have used the ratio of low attenuation area to total lung area as a useful parameter to quantitatively evaluate the extent of emphysema.2–4 Moreover, developments in CT and techniques of image analysis have been applied in the assessment of airway lesions. However, accurate quantitative evaluation of small airways, which are key sites of airway inflammation and airflow limitation in COPD, is not possible with these techniques.5 ,6 Hence, CT evaluation of airway remodelling usually entails measurement of airway dimensions from the proximal airways up to approximately sub-subsegmental airways.7–10 CT indices such as the ratio of airway wall area (WA) to total airway area (WA%) as well as luminal area (Ai) have been used for quantitative analysis of airway wall thickening and airway narrowing. These parameters have also been applied in clinical studies on bronchial asthma (BA), which is another common obstructive pulmonary disease.11–13 A study that compared multidetector-row CT (MDCT) airway dimensions among patients with COPD, patients with asthma and healthy controls reported that WA% was significantly larger, and Ai smaller, in patients with BA than in those with COPD and healthy controls; there were no differences in WA% and Ai between patients with COPD and healthy controls.14 However, these CT parameters were basically derived from an evaluation that focused on airway wall thickness at a specific cross-sectional slice. There are no reports establishing CT parameters that cover a wide range of airways in the longitudinal plane. This perspective is also an advantage for three-dimensional CT image analysis compared with a pathological approach, quantitative analysis of longitudinal airway dimensions by which is difficult to evaluate.
Thus, we hypothesised that the analysis of the longitudinal structure of airways using CT images could further characterise airway remodelling in patients with COPD, patients with asthma and healthy controls. In the present study, we focused on the longitudinal structure of the airway lumen, a feature closely related to airflow limitation. We established new parameters to reflect the shape irregularity of the airway lumen by measuring changes in the internal radii of imaginary inscribed spheres in the airway lumen from the level of the proximal carina to the peripheral bronchial subsegments on CT images. These new CT parameters, as well as WA% and Ai, were compared among patients with COPD, patients with asthma and healthy controls to investigate the characteristics of airway remodelling in obstructive lung diseases.
Methods
Subjects
A total of 29 patients with stable BA (BA group), 58 patients with stable COPD (COPD group) and 59 healthy controls (control group) were studied. BA was diagnosed according to the American Thoracic Society (ATS) criteria,15 and COPD was diagnosed according to the Global Initiative for Chronic Obstructive Lung Disease Workshop Report.1 All patients in the BA and COPD groups were studied at Kyoto University Hospital (Kyoto, Japan). Seventeen of the healthy controls were attending this hospital for further examination of chest X-ray abnormalities and underwent CT scanning, and the other 42 were attending Kitano Hospital (Osaka, Japan) for lung health screening, including spirometry and chest CT scan. No abnormal findings were observed on CT for any of the healthy controls. They had no respiratory symptoms and no history of respiratory disease, and had an FVC of ≥80% predicted and FEV1/FVC of ≥70% on spirometry.
All controls and asthmatic patients had a smoking history of ≤5 pack-years and had not smoked for ≥1 year before the CT examination. Eight patients in the COPD group were current smokers.
This study was approved by the ethics committees of all the institutions, and written informed consent was obtained from all subjects.
MDCT image acquisition
MDCT scans (Aquilion 64; Toshiba, Tokyo, Japan) were acquired at 0.5 mm collimation, with a scan time of 500 ms, 120 kV peak and auto-exposure control. The images were reconstructed with lung algorithm FC56. Both lungs were scanned from top to bottom with the subjects holding their breath at deep inspiration in the supine position. No contrast media were used.
Airway analysis using CT imaging
Cross-sectional airway dimensions were measured using software described previously.6 WA and Ai of the right apical bronchus and right posterior basal bronchus were measured using a full-width at half-maximum method for defining airway walls. The ratio of WA to total airway area (WA%) was calculated as WA/(Ai+WA)×100; Ai was corrected for body surface area (BSA).
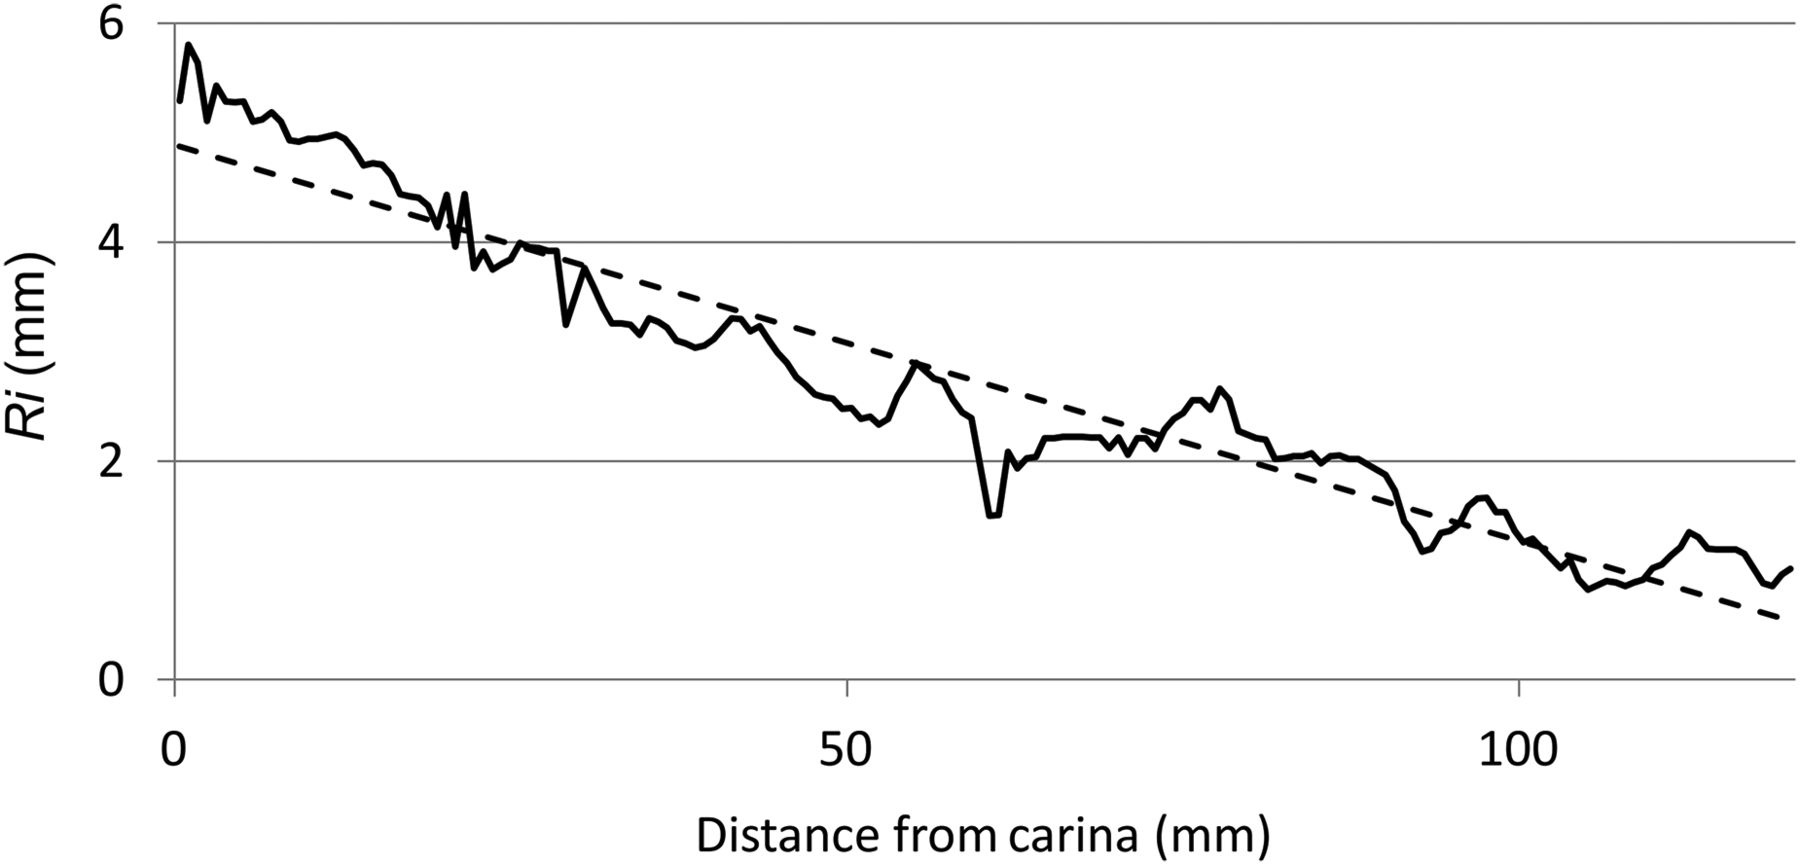
Next, we developed new software by modifying our previous software to investigate the luminal structure of the right bronchus in the longitudinal direction by calculating the internal radii of imaginary inscribed spheres (see online supplementary figure S1) in the airway lumen from the level of the carina to the fifth-order branches of the right posterior basal bronchus. The procedure of analysis using this software was as follows: first, a longitudinal line in the airway lumen was defined by connecting central points in the cross-sectional airway lumen from the carina to the fifth-order branch of the right posterior basal bronchus; second, a temporary radius was calculated by measuring the distance from the central longitudinal line to the airway wall in 128 directions, spanning 360°. This procedure was repeated on different sections by tilting the image plane every 180/64°. Thus, a total of 8192 values (128×64=8192) were obtained. The minimum value of these 8192 measurements was chosen as the first radius value. Next, we set another temporary centre just near the initial temporary centre and repeated the previous two steps, eventually obtaining the second radius value. This process was repeated to find the centre point with a maximum radius value. The final value of the radius (Ri) was the maximum value of these radius values, and the temporary centre point where this value was obtained was considered to be the final centre. This procedure was repeated from the carina to the fifth-order branch of the right posterior basal bronchus by a pixel dimension (0.68 mm) (figure 1). The values of Ri were expressed as a function of distance (l) from the carina. The Ri decreases with distance from the proximal carina to the periphery in a fluctuating manner (figure 2). To evaluate this longitudinal fluctuation of Ri, SD (SD_Ri) of gaps from the regression line was calculated from the relationship between Ri and l, and the coefficient of variation (CV_Ri) was defined as SD_Ri divided by mean values of Ri.

Schema of the longitudinal central line in the airway lumen, from which different radius measurements were made from the carina (start) to the fifth-order branch of the right posterior basal bronchus. The right panel shows a reconstructed image to represent the luminal structure, according to the longitudinal central line.

An example of continuous radius (Ri) measurements and regression line (dotted line) from the proximal carina to the distal bronchial segments.
To validate our method of measuring Ri, an airway phantom (Kyoto Kagaku, Kyoto, Japan) was scanned under the same conditions as those of the subjects. The measurements obtained by the software were compared with theoretical values. The correlation coefficient was high (r=0.995) and the slope of the regression line was close to 1.0 (see online appendix).
Spirometry
Subjects underwent spirometry using a Chestac-55V unit (Chest, Tokyo, Japan), according to ATS/European Respiratory Society (ERS) recommendations.16 FVC and FEV1 were examined, and their predicted values were calculated according to the guidelines of the Japanese Respiratory Society.17
Statistical analysis
All statistical analyses were performed using JMP V.6.0.3 software. Differences among groups were analysed using the Tukey–Kramer honestly significant difference test. The Student t test was used to assess differences between two subgroups. Relationships among data obtained from CT were assessed by the Pearson product–moment correlation coefficient test. p Values of <0.05 were considered significant.
Results
Characteristics of subjects
Table 1 shows the characteristics of the subjects in the three groups. The COPD group showed a preponderance of men and older patients and lower FEV1 and FEV1/FVC than the other two groups. Of the 58 patients with COPD, 4 were classified as stage 1, 29 as stage 2, 23 as stage 3, and 2 as stage 4.1 Although patients with COPD were taller than those with BA, there were no significant differences in BSA among the three groups. The BA group showed a preponderance of women and had lower FEV1 than the control group.
Characteristics of subjects
Comparison of CT parameters among the groups
With regard to airway wall thickness and luminal area at the apical and basal bronchi, the BA group had significantly lower Ai and higher WA% than the other two groups at both segmental bronchi; however, there were no significant differences between the COPD and control groups (table 2).
Comparison of CT parameters between the three groups
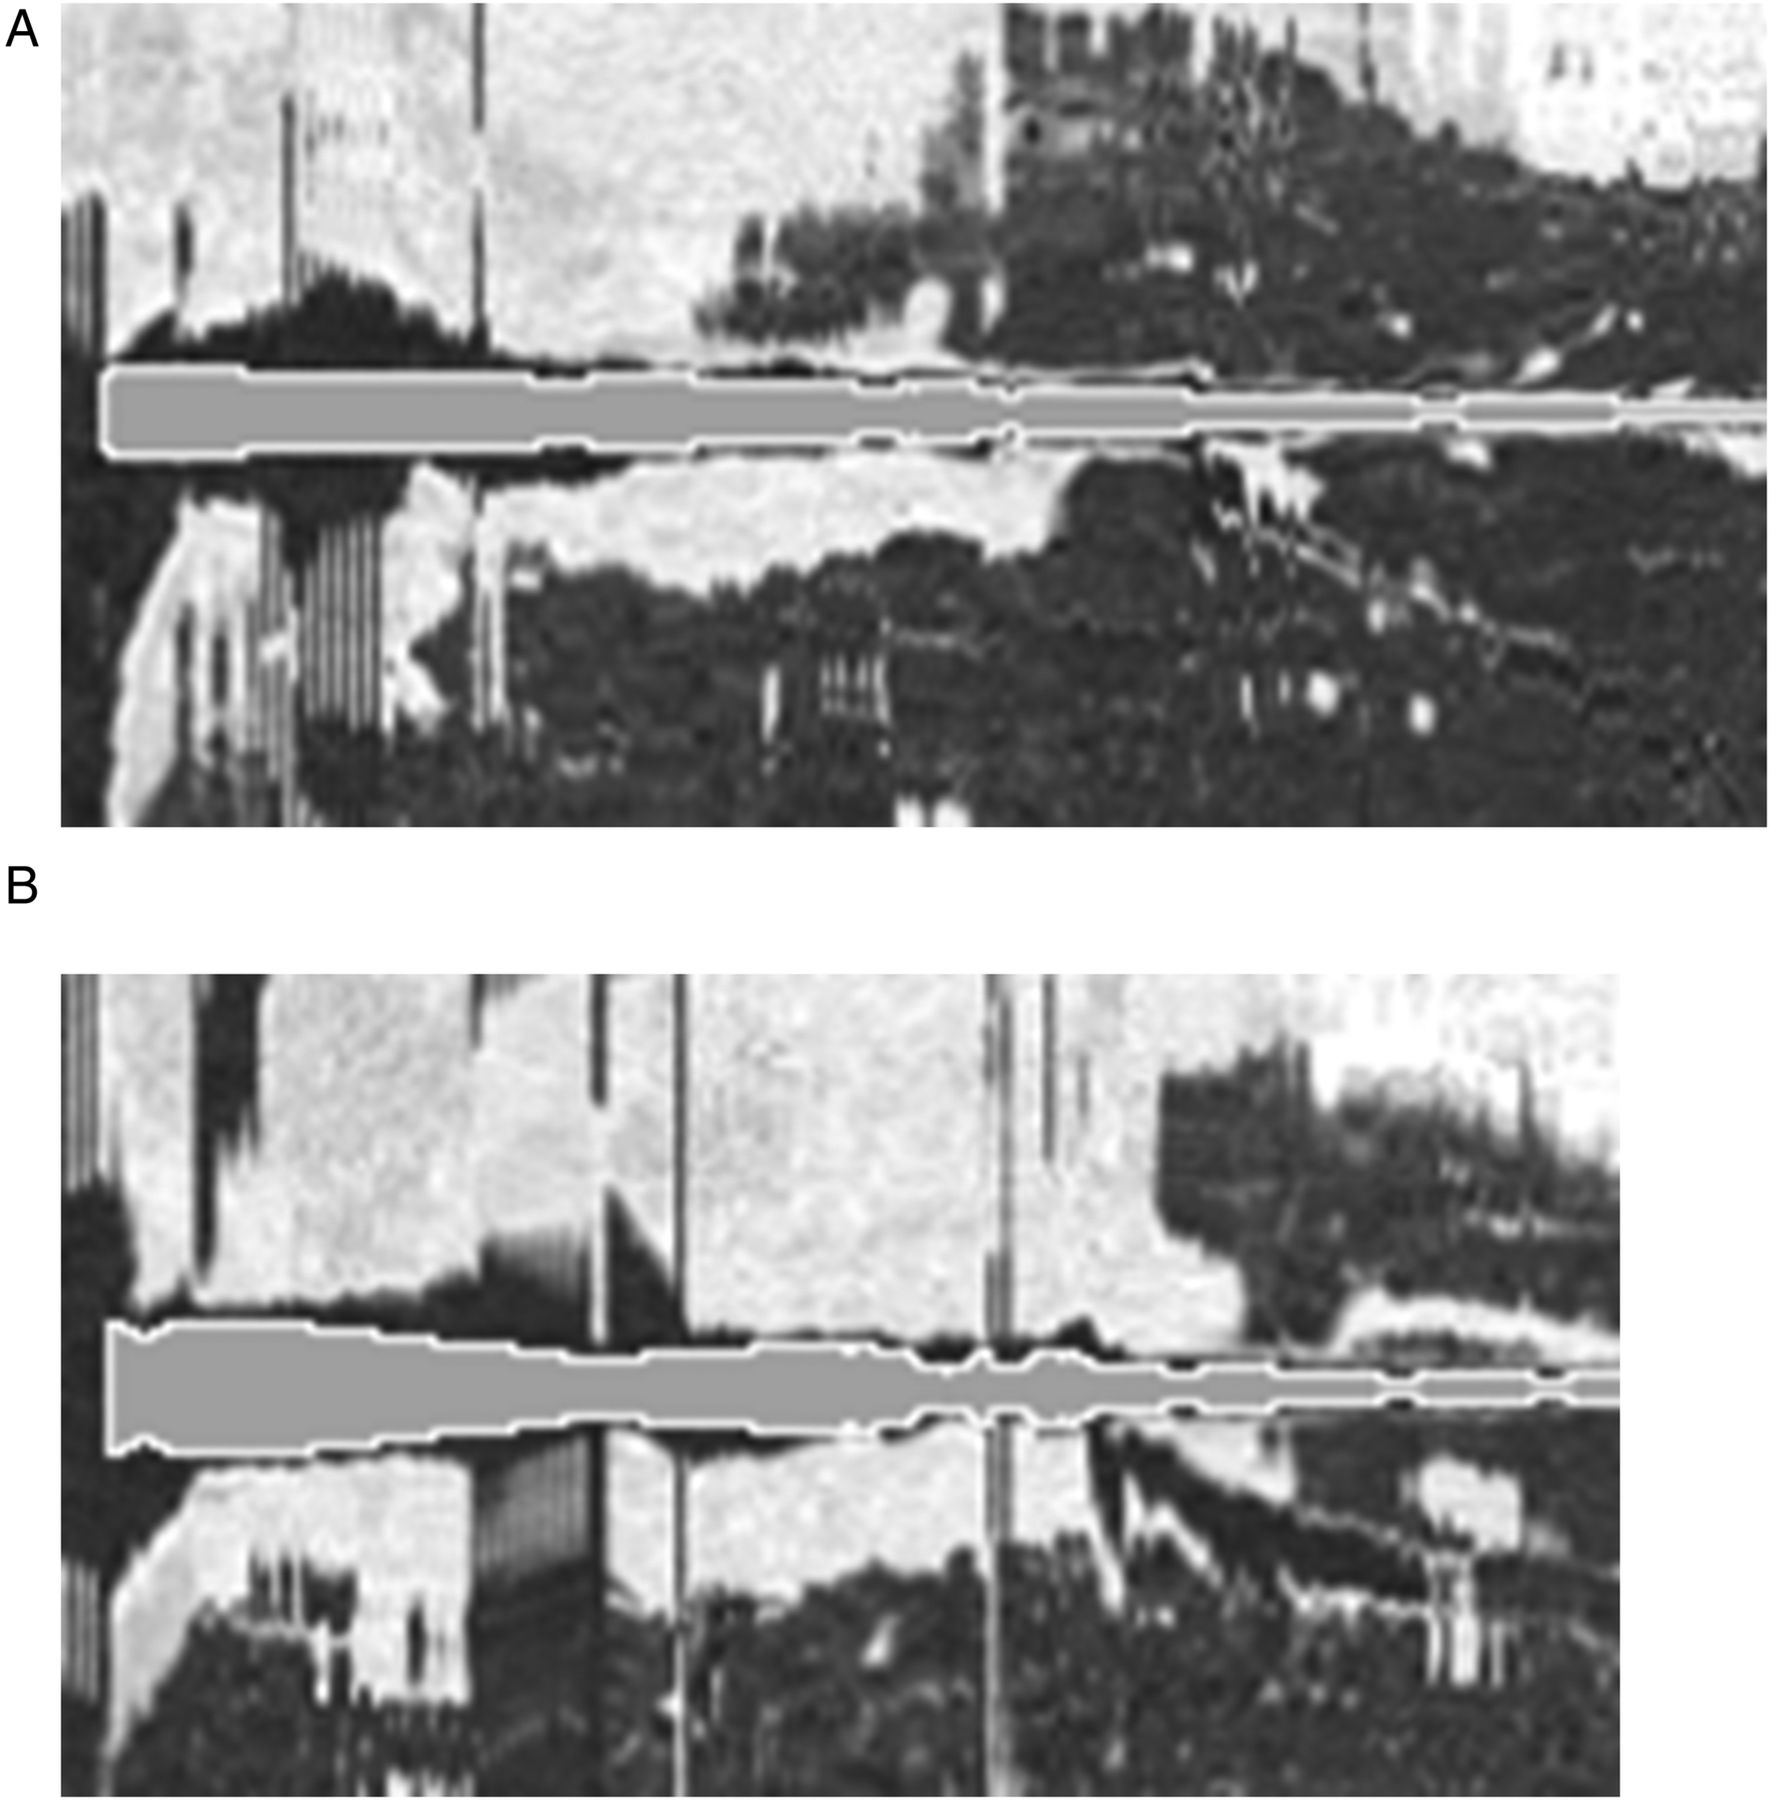
On the other hand, measures of the longitudinal shape irregularity of the airway lumen showed that the COPD group had significantly higher SD_Ri, SD_Ri/√BSA and CV_Ri than the other two groups. Figure 3 shows representative images of the greater fluctuation in internal diameter and the shape irregularity of the airway lumen in the longitudinal direction in a patient with COPD in comparison with a control subject.

Representative images of the airway lumen with (A) lower SD_Ri in a control subject and (B) higher SD_Ri in a patient with COPD. These images were reconstructed in the multiplanar plane along a central line in the right bronchial lumen from the carina to the fifth-order branch of the right posterior basal bronchus; the grey area with a white border represents the shape irregularity of the airway lumen, which was calculated from the radii of the inscribed sphere and was overlaid on the multiplanar reconstructed images. There were some black areas in the airway lumen at sites other than the bifurcation. This is because as the large cross-sectional area of the airway lumen (black) becomes further away from the circle, the more it deviates from the cross-section of the inscribed sphere (grey area with white border).
For further comparison of structural airway changes between the BA and COPD groups, subgroups of the BA group with percentage predicted FEV1 <80% and that of the group with mild to moderate COPD with ≥50% predicted FEV1 were investigated (table 3). Although there were no differences in age, height and airflow limitation between these groups, the BA subgroup still had significantly smaller Ai and higher WA%, whereas the COPD subgroup had significantly larger SD_Ri.
Comparison of characteristics and CT indices between the BA group with airway obstruction (FEV1% predicted <80) and the group with mild and moderate COPD (FEV1% predicted ≥50)
Effects of gender and age on CT indices in the control group
Table 4 shows that there were no significant differences in CT indices between the sexes. Moreover, SD_Ri and CV_Ri did not show any significant correlation with age (p=0.23 and p=0.61, respectively) and height (p=0.25 and. p=0.19, respectively).
Comparison of CT indices between male and female subjects in the control group
Relationships between CT indices and spirometry in COPD and BA group
Correlations between CT indices and spirometry in the COPD (table 5) and BA (table 6) groups are shown. In the COPD group, shape irregularity indices of the airway lumen revealed significant correlations with FEV1/FVC, and CV_Ri correlated significantly with percentage predicted FEV1 and mean forced expiratory flow between 25% and 75% of FVC (FEF25–75%). In contrast, in the BA group, none of the shape irregularity indices showed significant correlation with spirometry, whereas Ai/BSA and WA% of the basal bronchus correlated with % predicted FVC, % predicted FEV1 and FEF25–75%.
Correlation between CT indices and spirometry in the COPD group
Correlation between CT indices and spirometry in the BA group
Discussion
To the best of our knowledge, this is the first study to establish a new method, validated by a phantom study, for assessing the longitudinal structural changes in the airway lumen on CT images by measuring longitudinal fluctuation of internal radius from the carina. This method could provide additional evaluation of airway remodelling in obstructive pulmonary diseases, in combination with the parameters for cross-sectional airway wall thickness and luminal area, as described previously. The BA group showed significantly larger WA% and smaller Ai at both apical and basal segmental bronchi than the COPD and control groups. On the other hand, the COPD group showed significantly larger SD_Ri than the BA and control groups.
So far, quantitative evaluation of airway remodelling using CT images has been performed by measuring airway wall thickness and luminal area using cross-sectional images of airways at specific sites, such as the right apical bronchus. Asthmatic patients have increased airway wall thickness, which has been found to correlate with airflow limitation and airway hyper-responsiveness.12 ,13 In patients with COPD, WA% was found to correlate with airflow limitation.7 ,9 ,10 Pathologically, thickened reticular basement membrane, increased bronchial smooth muscle, especially at large airways, submucosal gland hypertrophy and proliferation of bronchial vessels have been reported in asthma; on the other hand, mucous metaplasia, increased bronchial smooth muscle and airway wall fibrosis in small airways are features of COPD.18 ,19 Structural changes in airways on CT images are considered to reflect a combination of these pathological changes. Similar to a previous report,14 in this study the BA group had significantly larger WA% and smaller Ai, at both apical and basal segmental bronchi, than the COPD and control groups. In addition, we developed new parameters for the shape irregularity of the airway lumen, such as SD_Ri and CV_Ri, to assess longitudinal fluctuation of the airway lumen from the trachea to the right basal bronchus. Although Ri is not always equal to the internal radius of the airway lumen, it can be measured even at the bifurcation of a bronchus; thus, it can be expressed as a continuous function that covers a wide range of the airway lumen in the longitudinal direction.
These parameters cannot be easily determined visually on CT images in the usual clinical setting, because they are derived from analysis of reconstructed three-dimensional images. These are different from previous parameters for airway wall thickening and WA% on cross-sectional images of airways. In this study, we found that the COPD group showed significantly larger SD_Ri than the BA and control groups. These results were still consistent with those for the subgroups of patients with COPD or BA with similar level of airflow limitation. Moreover, comparing the relationship between CT indices and spirometry, the longitudinal shape irregularity of the airway lumen correlated significantly with airflow limitation in the COPD group, but not in the BA group. Thus, these results may reflect the differences in pathogenesis of airway remodelling between COPD and BA.
Figure 4 shows a bubble chart that uses a combination of two CT parameters for the airway—that is, the longitudinal shape irregularity of the airway lumen (SD_Ri) and cross-sectional airway wall thickening (WA%)—among the three groups. This chart suggests overlapping differences in airway structure among the three groups, probably because of disease severity and heterogeneity.

Comparison of longitudinal luminal structure (SD_Ri) and cross-sectional airway wall thickening (percentage ratio of wall area to total airway area, WA%, apical) among the three groups. The centre of each ellipse corresponds to the mean value, and the radius represents SD.
The limitations of this study are the relatively small number of subjects in the BA group and the significant differences in sex and age among the three groups. However, there were no differences in SD_Ri between the sexes, and no correlation of SD_Ri with age in the control group. In addition, even in subgroup analysis, patients with COPD showed significantly larger values of SD_Ri and lower WA% and Ai than patients with BA who had a similar level of airflow limitation. Thus, SD_Ri may reflect disease-specific characteristics of airway remodelling. Another limitation is that the new parameters in this study, SD_Ri and CV_Ri, cannot represent all changes in the longitudinal shape of the airway lumen. Further studies that define other useful CT indices are warranted.
In conclusion, we have developed new CT indices to reflect longitudinal shape irregularity of the airway lumen to detect additional characteristics of airway structure in COPD. Longitudinal fluctuation in the airway internal radius was significantly larger in patients with COPD than in those with BA and healthy controls; wall thickening was significantly greater, and luminal area significantly smaller, in patients with BA than in those with COPD and controls. The combination of cross-sectional and longitudinal airway analyses may suggest differences in the characteristics of airway remodelling between COPD and asthma.
Acknowledgments
The authors wish to thank the following: Mr K Koizumi and Mr R Tanaka (both from the Clinical Radiology Service, Kyoto University Hospital) and Mr T Hamano (Department of Radiology, Tazuke Kofukai Medical Research Institute, Kitano Hospital) for their technical assistance with CT scanning, and Kyoto Kagaku (Kyoto, Japan) for their assistance with the development of the phantom.
References
Supplementary materials
Supplementary Data
This web only file has been produced by the BMJ Publishing Group from an electronic file supplied by the author(s) and has not been edited for content.
- Data supplement 1 - Online supplement
- Data supplement 2 - Online figures
Footnotes
Contributors TO, TH and MM contributed to the study concept and design. TO, TH, MF, NT, SM, HN, HI, SS, AN, II, HM and SM acquired the data. TO, TH, AN, HM and SM contributed to data interpretation. TO and TH analysed the data and wrote the manuscript. MM supervised the study.
Funding This study was partly supported by Grants-in-Aid for scientific research (No 25461156) and a grant to the Respiratory Failure Research Group from the Ministry of Health, Labour and Welfare, Japan.
Competing interests None declared.
Patient consent Obtained.
Ethics approval Ethics committees of Kyoto University and Kitano Hospital.
Provenance and peer review Not commissioned; externally peer reviewed.
Linked Articles
- Airwaves