Article Text

Abstract
Introduction In people with obesity hypoventilation syndrome (OHS), breathing 100% oxygen increases carbon dioxide (PCO2), but its effect on pH is unknown. This study investigated the effects of moderate concentrations of supplemental oxygen on PCO2, pH, minute ventilation (VE) and physiological dead space to tidal volume ratio (VD/VT) among people with stable untreated OHS, with comparison to healthy controls.
Methods In a double-blind randomised crossover study, participants breathed oxygen concentrations (FiO2) 0.28 and 0.50, each for 20 min, separated by a 45 min washout period. Arterialised-venous PCO2 (PavCO2) and pH, VE and VD/VT were measured at baseline, then every 5 min. Data were analysed using general linear model analysis.
Results 28 participants were recruited (14 OHS, 14 controls). Among OHS participants (mean±SD arterial PCO2 6.7±0.5 kPa; arterial oxygen 8.9±1.4 kPa) FiO2 0.28 and 0.50 maintained oxygen saturation 98–100%. After 20 min of FiO2 0.28, PavCO2 change (ΔPavCO2) was 0.3±0.2 kPa (p=0.013), with minimal change in VE and rises in VD/VT of 1±5% (p=0.012). FiO2 0.50 increased PavCO2 by 0.5±0.4 kPa (p=0.012), induced acidaemia and increased VD/VT by 3±3% (p=0.012). VE fell by 1.2±2.1 L/min within 5 min then recovered individually to varying degrees. A negative correlation between ΔVE and ΔPavCO2 (r=−0.60, p=0.024) suggested that ventilatory responses were the key determinant of PavCO2 rises. Among controls, FiO2 0.28 and 0.50 did not change PavCO2 or pH, but FiO2 0.50 significantly increased VE and VD/VT.
Conclusion Commonly used oxygen concentrations caused hypoventilation, PavCO2 rises and acidaemia among people with stable OHS. This highlights the potential dangers of this common intervention in this group.
- Lung Physiology
Statistics from Altmetric.com
Key messages
What is the key question?
-
What are the effects of moderate concentrations of supplemental oxygen on CO2, pH, ventilation and physiological dead space to tidal volume ratio (VD/VT) in people with obesity hypoventilation syndrome (OHS)?
What is the bottom line?
-
In OHS, breathing moderate concentration supplemental oxygen for 20 min worsened hypercapnia and induced acidaemia due to hypoventilation and a worsening of VD/VT.
Why read on?
-
This is the first study to evaluate the effects of moderate concentration supplemental oxygen on blood gases and respiratory variables in OHS and highlights the potential risks of this common intervention among this unique population.
Introduction
In obesity hypoventilation syndrome (OHS), chronic hypercapnia develops as a consequence of obesity. This condition is associated with alveolar hypoventilation, restricted pulmonary function, severe sleep-disordered breathing and higher rates of morbidity, mortality and healthcare costs compared with eucapnic obesity.1–4 OHS affects approximately 0.15–0.3% of the US population5 and over 50% of hospital inpatients with body mass index (BMI)>50 kg/m2.1 Despite this, OHS frequently goes undiagnosed among hospital inpatients with obesity.1
Supplemental oxygen is a common medical intervention6 and may be administered to patients with OHS in a range of healthcare settings. British Thoracic Society guidelines on emergency oxygen prescription identify patients with OHS as a group among whom excessive concentrations of supplemental oxygen, causing hyperoxia, could increase carbon dioxide (CO2) levels and lower pH.6 The basis of the guidelines relies upon expert opinion and data from COPD, because very few studies have investigated the effects of supplemental oxygen in OHS. Among patients with obesity and elevated transcutaneous CO2 pressure (PCO2), breathing 100% oxygen induced an average rise in transcutaneous PCO2 of 0.7 kPa (with rises of >1.3 kPa in three patients).7 However, the effect of oxygen on pH, an important prognostic indicator,2 ,8 ,9 was not reported. Furthermore, 100% oxygen is rarely used in clinical practice.7 Hence, the clinical relevance of these data is uncertain.
During acute exacerbations of COPD, hyperoxia arising from supplemental oxygen worsens hypercapnia and pH, and has been linked to more frequent admission to intensive care and increased hospital length of stay and mortality.9–11 Hyperoxia-induced hypercapnia in COPD has been attributed to increased ventilation/perfusion (V/Q) inequality, mediated by the reversal of hypoxic vasoconstriction12–14; however recent evidence suggests that hypoventilation may be a quantitatively more important mechanism.15 ,16 Whether or not these mechanisms apply to OHS, which has a vastly different pathophysiology to COPD, has yet to be determined.
The aims of the present study were to document the time course of changes in PCO2, pH and respiratory variables in response to clinically relevant, moderate concentrations of supplemental oxygen among people with OHS in comparison to a healthy control group; and to examine physiological mechanisms that may explain any oxygen-induced changes in PCO2.
Methods
Written informed consent was obtained from all participants. The study was approved by the Ethics Committees of Royal Prince Alfred Hospital (protocol no. X12–0067 and HREC/12/RPAH/109) and the University of Sydney (Ref. 14935) and registered on the Australian and New Zealand Clinical Trials Registry (ACTRN1260800172303).
Participants
Patients referred to the Sleep Unit, Royal Prince Alfred Hospital with obesity and possible hypercapnia were screened for eligibility. Inclusion criteria were the combination of obesity (BMI ≥ 30 kg/m2) and daytime hypercapnia (arterial PCO2 (PaCO2) > 6 kPa). Patients were excluded in the case of any other potential cause of hypercapnia, current use of positive airway pressure, acute respiratory/cardiac illness within the previous month, acidaemia or psychiatric illness. A control group was recruited concurrently from a sample of convenience. Each control participant was age (±3 years) and gender matched with an OHS participant, non-smoking, with BMI < 30 kg/m2, normal spirometry and no history of cardiorespiratory disease.
Study design and protocol
Using a double-blind randomised crossover design (figure 1), each participant breathed two fractions of inspired oxygen (FiO2) 0.28 and 0.50 in random order (sequence 1 or 2), via a breathing circuit, after a circuit acclimatisation period. Each test began with a 10 min period of breathing room air via the circuit (baseline), followed by a 20 min period of supplemental oxygen (FiO2 0.28 or 0.50), and then a 10 min period of breathing room air (recovery). A 45 min washout period separated the two supplemental oxygen tests.

Study design. FiO2, inspired oxygen fraction.
Randomisation of sequence was generated using an online randomisation programme (http://www.randomization.com), with allocation concealed via sealed opaque envelopes. The chief investigator and participants remained blinded throughout. An unblinded coinvestigator operated equipment and instructed participants. Testing began between 8:30am and 10:00am. All participants had fasted and abstained from caffeine from midnight.
Instrumentation
The closed breathing circuit comprised a dry rolling-seal spirometer, a bias-flow generator, a soda-lime CO2 absorber and a T-connector at the participant interface. Gas was continuously sampled at the interface using oxygen/CO2 sensors. A stable FiO2 was maintained through titration of bottled air and oxygen using continuous real-time feedback from the oxygen sensor. Immediately after each FiO2 change, the circuit was flushed to allow stabilisation at the new FiO2 within 2 min. Participants breathed through the circuit via a nasal mask (dead space 175 mL) with the mouth closed (n=25), or in the case of nasal obstruction, via a mouthpiece (dead space 100 mL) with a nose peg (n=3).
Outcome measures
On the day of testing, baseline measures of height, weight, spirometry and arterial blood gases (ABGs) were performed.
Arterialised-venous blood was repeatedly sampled to obtain surrogate measures of arterial PCO2 (PavCO2) and pH. We previously described and validated this method in OHS.17 An oximeter continuously measured pulse oxygen saturation (SpO2) (Radical, Masimo, Irvine, California, USA). Signals from the oxygen/CO2 sensors and spirometer were recorded by a computer programme and used to derive and/or display breath-by-breath minute ventilation (VE), tidal volume (VT) and respiratory rate (RR). Breath-by-breath physiological dead space (VDphys) was calculated using a CO2 expirogram method18 and adjusted by subtracting apparatus dead space, then divided by VT to obtain VDphys to VT ratio (VD/VT). Data affected by leak or artefact were systematically excluded. Subsequently, breath-by-breath data were averaged over 60 s.
For final analysis, data obtained during the following periods were included: the final minute of the 10 min baseline, the final minute of each 5 min epoch of supplemental oxygen, and the final minute of the 10 min recovery. Arterialised-venous blood samples were drawn within the last 10 s of each of these periods.
Statistical analysis
Data are presented as mean±SD or median (IQR), and mean difference (MD) and 95% CI for between-group comparisons. A significance level of p<0.05 was used for all comparisons. Between-group MDs in baseline variables were compared using independent t-tests. General linear model (univariate, repeated measures) analysis compared responses to supplemental oxygen between participant groups (factor: group; factor interaction: time-by-group) for primary (PavCO2) and secondary (pH, VE and VD/VT) outcomes; between baseline and supplemental oxygen (factor: time) for primary, secondary and tertiary (VT, RR, VDPhys) outcomes; and between the two oxygen concentrations (factor: concentration) for PavCO2. For non-parametric data, the Friedman test was used to evaluate effects of time. To account for multiple comparisons the level of significance was adjusted (adj.p) using Holm's Bonferroni procedure.19 Within the OHS group only, Pearson's correlation coefficient was calculated to examine potential factors associated with the change in PavCO2 after 20 min (ΔPavCO2) of FiO2 0.50, including baseline PaCO2, bicarbonate (HCO3−) and arterial oxygen saturation (SaO2), ΔVE, and ΔVD/VT. The study was powered to detect a ΔPavCO2 of 0.4 kPa16 from baseline during supplemental oxygen within the OHS group, with an SD estimate of 0.45 kPa (using data from the first five OHS participants), power of 0.8, α of 0.05. A sample of 14 OHS participants (hence 14 matched controls) was required. Data were analysed using PASW 18 (IBM, Armonk, New York, USA).
Results
Fourteen participants with OHS and 14 controls were recruited between August 2008 and February 2012 (figure 2). Baseline characteristics (table 1) show that groups were well matched for age and gender. Participants with OHS presented with super-obesity, mild hypercapnia and hypoxaemia, and mild pulmonary restriction.
Participant characteristics, baseline arterial blood gases and spirometry
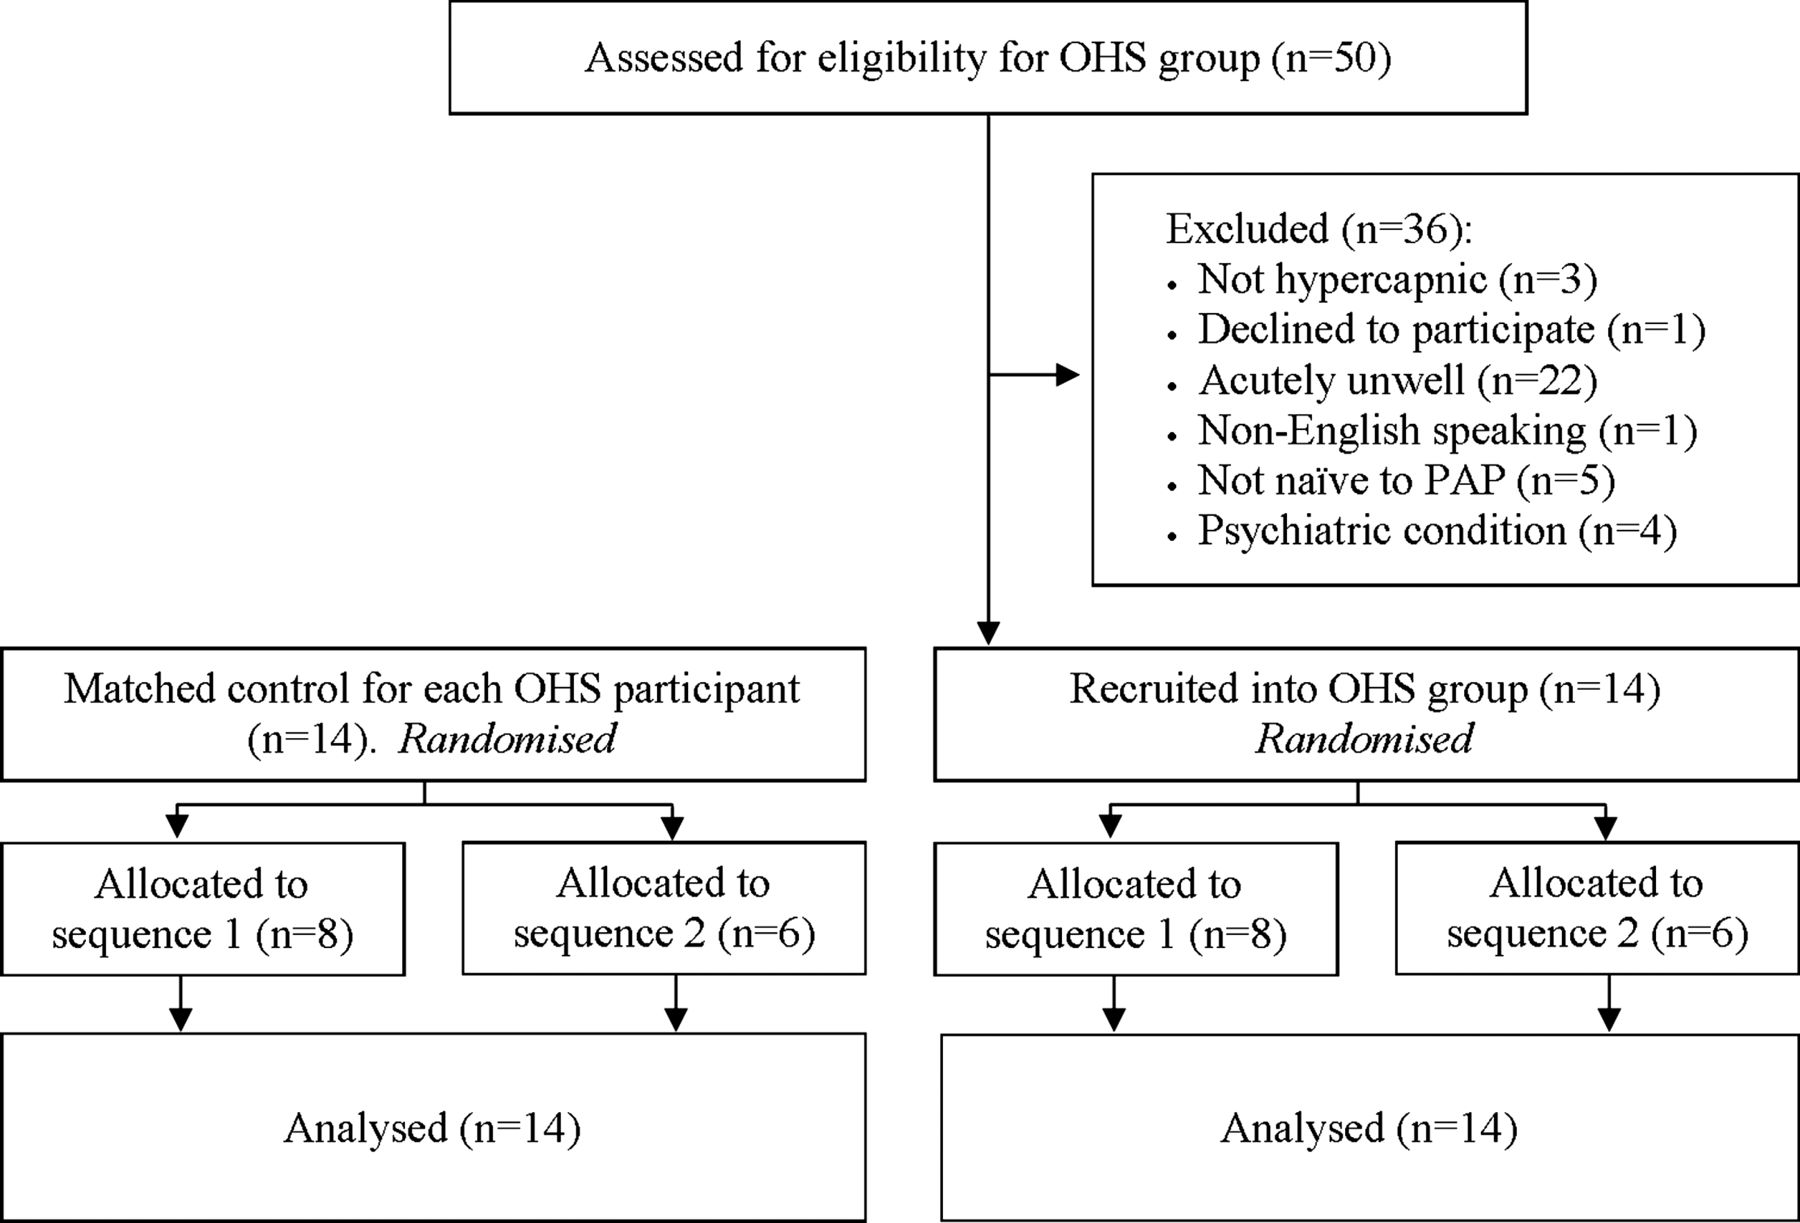
Flow diagram of enrolment, randomisation/allocation and analysis phases. OHS, obesity hypoventilation syndrome, PAP, positive airway pressure.
Table 2 shows all variables at baseline and after 20 min of breathing each oxygen concentration. In both groups, supplemental oxygen induced hyperoxia, with SpO2 in OHS increasing to 99±1% during FiO2 0.28 and 100±0% during FiO2 0.50. Figure 3 depicts time courses of PavCO2, VE and VD/VT. There was no significant effect of test order on PavCO2 for either group. General linear model comparisons are detailed in table E1, online data supplement.
Physiological variables at baseline and at the end of FiO2 0.28 and FiO2 0.50 tests

Time course of changes in PavCO2, VE and VD/VT during air/oxygen breathing tests for OHS group (open circles) and control group (closed circles), with results of general linear model analysis of between-group differences (factor: group, and group by time). †Adjusted p value=0.01; FiO2, inspired oxygen fraction; NS, non-significant; OHS, obesity hypoventilation syndrome; PavCO2, arterialised-venous CO2; VE, minute ventilation; VD/VT, dead space to tidal volume ratio.
Between-group comparisons
Responses to supplemental oxygen were significantly different between groups for PavCO2 and pH (figure 3, table 3), but not for VE after adjustment. There were no significant between-group differences or interaction effects for VD/VT, hence data from both groups were combined to analyse the effects of time for VD/VT.
Between-group comparisons of responses to supplemental oxygen
OHS group: responses to supplemental oxygen
Amongst OHS participants, significant increases in PavCO2 occurred after 20 min of FiO2 0.28 (0.3±0.2 kPa, adj.p=0.013) and FiO2 0.50 (0.5±0.4 kPa, adj.p=0.012) (table 2, figure 3). Consequently, proportional changes in pH were observed, resulting in acidaemia after 20 min of FiO2 0.50 (7.346±0.030, adj. p=0.011). There was a significant difference in PavCO2 between the two oxygen concentrations, but this became non-significant after adjustment (raw p=0.021, adj.p=0.315).
There was a positive correlation between ΔPavCO2 (FiO2 0.50) and PaCO2 (r=0.60, p=0.023) and HCO3− (r=0.58, p=0.030), but not SaO2 (r=−0.48, p=0.08). Furthermore, a negative correlation between ΔPavCO2 and ΔVE was found (r=−0.60, p=0.024), but not ΔVD/VT (r=0.42, p=0.18).
There was no significant change in VE when breathing FiO2 0.28 (table 2). In contrast, during FiO2 0.50 a consistent fall in VE of 1.2±2.1 L/min (12±22%) below baseline occurred within 5 min (figure 3). Thereafter, a varying recovery in VE was observed (figure 4C), such that after 20 min VE remained below baseline in six participants, returned to baseline in four participants and exceeded baseline VE by >5% in four participants. After 20 min, group mean VE was 3±20% below baseline, which became non-significant after adjustment (raw p=0.014, adj.p=0.224). Decreases in VE were attributable to significant falls in VT, as RR was unchanged.

Individual and group responses to supplemental oxygen concentration (FiO2) 0.28 and 0.50 for OHS group (A and C) and control group (A and D), showing change in arterialised-venous carbon dioxide from room air baseline (▵PavCO2) (A and B), and change in minute ventilation from room air baseline (VE) (C and D). Each figure includes individual changes at 20 min for FiO2 0.28 and group mean±SD on the left, and individual changes at 20 min for FiO2 0.50 and group mean±SD on the right. OHS, obesity hypoventilation syndrome.
During FiO2 0.28 and 0.50, VD/VT increased by 1±5% and 3±3%, respectively (adj.p=0.012), in the absence of significant changes in VDphys.
Control group: responses to supplemental oxygen
Among the controls, there were no significant changes in PavCO2 or pH during either FiO2 (table 2, figure 3), and no significant differences for PavCO2 between concentrations. During FiO2 0.28 there were no significant changes in VE, VT or RR. However, breathing FiO2 0.50 increased VE by 15±11% after 20 min (adj.p=0.019), due to a slight, non-significant increase in RR (raw p=0.01, adj.p=0.170).
Significant increases in VD/VT of 1±3% and 4±3% were observed during FiO2 0.28 and 0.50 respectively (adj.p=0.012). This was accompanied by small rises in VDphys which became non-significant after adjustment (raw p<0.001, adj.p=0.085).
Discussion
To our knowledge, this is the first study to investigate the effects of clinically relevant, moderate concentrations of supplemental oxygen on PCO2 and pH, VD/VT and VE and its determinants among people with OHS. In OHS, hyperoxia induced by breathing FiO2 0.28 and FiO2 0.50 caused significant rises in PavCO2. Accordingly, pH decreased, resulting in acidaemia during FiO2 0.50. Breathing FiO2 0.50 was accompanied by hypoventilation and increases in VD/VT. However, changes in VE were the key determinant of PavCO2 rises. Breathing FiO2 0.50 also increased VD/VT in the control group, but controls maintained a stable PavCO2 and pH through a 15% increase in VE. The findings of the present study bring into question the safety of moderate concentrations of supplemental oxygen among patients with untreated OHS and provide evidence to substantiate current clinical guidelines on oxygen prescription.6
Among participants with OHS, hyperoxia induced by supplemental oxygen significantly worsened hypercapnia and lowered pH. In an earlier study, breathing 100% oxygen increased transcutaneous PCO2 in obesity-associated hypercapnia,7 but the clinical relevance of this report was unclear because pH was not measured and transcutaneous PCO2 was used, inherently adding potential errors to PCO2 measures and preventing a definitive diagnosis of OHS.5 The present study provided further physiological detail and insight into the clinical relevance of the effects of hyperoxia in OHS. Although the minimal important difference for PCO2 in OHS has not been defined, in the present study the rise in PavCO2 during FiO2 0.50 (0.5±04 kPa) was considered clinically significant because it induced acidaemia. In patients with COPD, hyperoxia-related acidaemia is associated with higher in-hospital morbidity,9 and this may apply to acutely unwell patients with OHS2 ,8 but has not been addressed. Therefore, in light of the results of the present study, the influence of supplemental oxygen usage on morbidity, mortality and healthcare utilisation in people with OHS requires investigation.
Ventilatory responses to hyperoxia
Controls
Interestingly, VD/VT increased among the control group with both oxygen concentrations, with rises of the same magnitude as those of the OHS group (figure 3). Despite this, PavCO2 and pH remained relatively stable, albeit with some individual variation (figure 4B). During FiO2 0.50, stable PavCO2 levels were achieved by a 15±11% increase in VE. This is consistent with previous observations among healthy controls breathing 100% O220–23 and is indicative of normal ventilatory control. Hyperoxic hyperventilation in healthy individuals is usually preceded by a fall in VE (∼5–12%) within the first 30 s to 2 min of breathing 100% oxygen via inhibition of the peripheral chemoreceptors, which are tonically active within a normal PaO2 range.20 ,21 ,23 However, the washout time of circuit gases prevented this being captured in the present study. Quickly thereafter, VE increases above baseline due to transient increases in PaCO2 from initial hypoventilation,22 ,23 the Haldane effect,22 increases in VD/VT and possibly in part through direct stimulation of chemoreceptors.22
Obesity hypoventilation syndrome
Participants with OHS also experienced increases in VD/VT during hyperoxia. However, unlike the controls, breathing FiO2 0.50 was invariably characterised by marked hypoventilation for the first 5–10 min, followed by a partial recovery in VE. The recovery of VE was usually insufficient to overcome the increase in VD/VT, hence PavCO2 was elevated after 20 min of FiO2 0.50 in most participants (figure 4). There was a negative correlation between ΔVE and ΔPavCO2, but ΔVD/VT was not associated with ΔPavCO2. These results suggest that the PavCO2 rises observed amongst OHS participants were largely a result of inadequate ventilatory control. Impaired respiratory chemosensitivity is a common feature of OHS24–26 and may explain why the initial decrease in VE during hyperoxia was of a larger magnitude, with much slower recovery, than that reported in controls.21 ,23 Blunted hypercapnic ventilatory responses could also explain why an elevation of PavCO2 at 20 min was tolerated by most participants. However, hypercapnic ventilatory responses are highly variable between individuals with OHS and are sometimes within the normal range in patients with mild hypercapnia,24–26 which may explain the variability in ventilatory responses to hyperoxia in the OHS group. We did not test ventilatory responses and are therefore unable to confirm their role in the changes in PavCO2 observed during hyperoxia.
Factors potentially influencing VD/VT in controls and OHS
In both groups, VD/VT increased significantly during hyperoxia, although the contribution of this small change towards potential PavCO2 rises is uncertain. Increased VD/VT could arise from an increase in VDphys, a decrease in VT or both. In studies measuring V/Q distributions in healthy controls,27 and patients with OHS,28 breathing 100% oxygen has been shown to increase perfusion to poorly ventilated regions of lung through the release of local hypoxic vascoconstriction.27 This results in underperfusion of well ventilated regions, thereby increasing VDphys.27 This mechanism is plausible among the control group, in whom a small increase in VDphys was observed during FiO2 0.50. However, this change became non-significant after statistical adjustment. In contrast, no change was observed in VDphys among the OHS group. It has been shown that VDphys has a proportional relationship with VT.29 ,30 Therefore in OHS participants, increases in VDphys occurring due to increased V/Q inequality may have been offset by the concomitant fall in VT. Given the lack of increase in VDphys during hyperoxia among OHS participants, rises in VD/VT are largely attributable to the reduction in VE (via the reduction in VT), which is consistent with previous observations in patients with obesity-associated hypercapnia whilst breathing 100% oxygen.7 However, we did not perform invasive V/Q measures and therefore were unable to characterise the complex interactions between pulmonary ventilation and perfusion, gas exchange and breathing pattern when patients were breathing moderate oxygen concentrations.
Clinical implications
Clinically important differences between the two concentrations of oxygen were observed in the present study, that is, hyperoxia induced by FiO2 0.28 caused minimal changes in pH or VE, while FiO2 0.50 caused hypoventilation and acidaemia. Furthermore, compared with responses to FiO2 0.50 in our OHS participants, even more marked changes in PCO2 and VE occurred during 100% oxygen in obesity-associated hypercapnia.7 The mechanisms by which hyperoxia induces hypoventilation in OHS remain unclear. However, these findings suggest that a greater degree of respiratory depression occurs with higher oxygen concentrations. Therefore, in stable OHS, hyperoxia caused by breathing FiO2 0.28 may be less harmful than FiO2 0.50 or 1.0.
Substantial inter-individual variability in ΔPavCO2 during hyperoxia was evident among the OHS group; as has been reported in obesity-associated hypercapnia7 and COPD.16 Therefore it would be clinically useful to identify features that may predict adverse responses to hyperoxia. Strong associations between ΔPavCO2 and baseline PaCO2 and HCO3− were observed, suggesting that patients with OHS and severe hypercapnia (and associated elevated HCO3− levels) are more likely to develop worsening hypercapnia during hyperoxia. This is plausible, given the tendency for people with OHS and a higher PaCO2 to have lower hypercapnic ventilatory responses than those with lower PaCO2.24–26 Elevated HCO3− may also directly blunt hypercapnic ventilatory responses in OHS, through an increased acid-buffering capacity.31 ,32 Previous data also suggest that people with more severe hypoxaemia may experience larger PCO2 rises during hyperoxia,7 although this was not evident amongst our mildly hypoxaemic group.
Participants in the present study were clinically stable, with mild hypercapnia and hypoxaemia. Therefore our findings probably underestimate the dangers of hyperoxia in people with OHS with severe hypercapnia and/or acute cardiorespiratory illness. The effects of supplemental oxygen in this population warrant further investigation. Even so, the findings of the present study highlight the potential risks associated with the administration of moderate concentrations of supplemental oxygen among people with OHS. These findings also provide an evidence base for current guidelines,6 which recommend that in OHS, supplemental oxygen should be titrated to maintain SpO2 88–92%, thereby avoiding hyperoxia and hypoxaemia. Oxygen supplementation should also include close monitoring and periodic reassessment of ABGs.6
Limitations
In this study, we documented acute responses to breathing supplemental oxygen for 20 min. Based on the time course of PavCO2 (figure 3), a plateau in PavCO2 occurred after 10 min of breathing oxygen. However, due to the large capacity of the body for CO2 storage, CO2 equilibrium is not usually achieved until 20–30 min after a change in ventilation33 and therefore participants may not have reached CO2 steady state. In clinical practice, patients are usually treated with supplemental oxygen for extended periods. Hence, the effects of longer periods of supplemental oxygen require evaluation to further strengthen clinical practice guidelines.
Conclusion
Among people with mild, stable untreated OHS, breathing moderate concentrations of supplemental oxygen increased PavCO2, sufficient to induce acidaemia during FiO2 0.50. These findings highlight the need for caution during supplemental oxygen administration among people with OHS and support current clinical guidelines which recommend targeting an SpO2 range and monitoring of ABGs during supplemental oxygen administration.
Acknowledgments
The authors thank each of the study participants, and Associate Professor Brendon Yee for his assistance.
References
Supplementary materials
Supplementary Data
This web only file has been produced by the BMJ Publishing Group from an electronic file supplied by the author(s) and has not been edited for content.
Files in this Data Supplement:
- Data supplement 1 - Online table
Footnotes
-
Contributors CAH: contributed to design and implementation of the study, data collection, statistical analysis, preparation and editing of manuscript; ARH, LJM, CM: contributed to design and implementation of the study, data collection, and editing of manuscript; GNW: contributed to original concept and design of the study, and editing of manuscript; GU: designed and built breathing circuit and data acquisition/analysis programmes, and contributed to study design, data analysis and editing of manuscript; DF: contributed to design and implementation of study, data collection and editing of the manuscript; DAB: contributed to design of the study, and editing of manuscript; AJP: contributed to design and implementation of the study, and editing of manuscript.
-
Funding The study was supported by a Cardiorespiratory Physiotherapy Australia Research Grant from the Physiotherapy Research Foundation (grant no. T08-CAR/JN016).
-
Competing interests AJP received fees for lectures from ResMed, Asia Pacific and Philips Respironics, Australia. She has also received a grant to evaluate therapy in obesity hypoventilation syndrome from the ResMed Foundation. GNW has previously been a consultant to ResMed, Asia Pacific. He has received fees for lectures from ResMed, Asia Pacific. All other authors have no actual or potential competing interests to disclose.
-
Ethics approval Respective ethics committees of Royal Prince Alfred Hospital and The University of Sydney, Sydney Australia.
-
Provenance and peer review Not commissioned; externally peer reviewed.