Article Text

Abstract
Background Idiopathic pulmonary fibrosis (IPF) is an untreatable lung disease with a median survival of only 3–5 years that is diagnosed using a combination of clinical, radiographic and pathologic criteria. Histologically, IPF is characterised by usual interstitial pneumonia (UIP), a fibrosing interstitial pneumonia with a pattern of heterogeneous, subpleural regions of fibrotic and remodelled lung. We hypothesised that gene expression profiles of lung tissue may identify molecular subtypes of disease that could classify subtypes of IPF/UIP that have clinical implications.
Methods and findings We collected transcriptional profiles on lung tissue from 119 patients with IPF/UIP and 50 non-diseased controls. Differential expression of individual transcripts was identified using an analysis of covariance (ANCOVA) model incorporating the clinical diagnosis of each patient as well as age, gender and smoking status. Validation was performed in an independent cohort of 111 IPF/UIP and 39 non-diseased controls. Our analysis identified two subtypes of IPF/UIP based on a strong molecular signature associated with expression of genes previously associated with fibrosis (matrix metalloproteinases, osteopontin, keratins), cilium genes and genes with unknown function. We demonstrate that elevated expression of cilium genes is associated with more extensive microscopic honeycombing and higher expression of both the airway mucin gene MUC5B and the metalloproteinase MMP7, a gene recently implicated in attenuating ciliated cell differentiation during wound repair.
Conclusions Expression of cilium genes appears to identify two unique molecular phenotypes of IPF/UIP. The different molecular profiles may be relevant to therapeutic responsiveness in patients with IPF/UIP.
- Interstitial Fibrosis
Statistics from Altmetric.com
Key messages
What is the key question?
-
Although progress has been made in the clinical approaches to idiopathic pulmonary fibrosis (IPF), there remain questions about the accuracy of diagnosis, the ability to predict both response to therapy and prognosis, and understanding the aetiology and pathogenesis of this disease. The key question of this study is whether there are molecular subtypes of IPF based on gene expression signatures.
What is the bottom line?
-
In this study, two novel molecular subtypes of IPF characterised by expression of cilium genes were identified; higher expression of cilium genes is associated with microscopic honeycombing, MUC5B and MMP7 gene expression.
Why read on?
-
Gene expression in IPF could potentially predict those IPF patients with different outcomes and response to pharmacological intervention. The application of gene expression profiling to identify unique molecular signatures of disease has proven useful in predicting the clinical course and response to therapy for several types of cancer and could prove equally important in IPF/UIP.
Introduction
Although progress has been made in the clinical characterisation of the idiopathic interstitial pneumonias (IIP), there remain questions about the accuracy of diagnosis, the ability to predict both response to therapy and prognosis, and understanding the aetiology and pathogenesis of this disease. Idiopathic pulmonary fibrosis (IPF), the most common type of IIP, is histopathologically defined by the presence of the prototypical form of pulmonary fibrosis, usual interstitial pneumonia (UIP). UIP is a fibrosing interstitial pneumonia characterised by a pattern of heterogeneous, subpleural regions of fibrotic and remodelled lung that often results in death within 3 years of diagnosis.1 Despite recent efforts to develop antifibrotic treatments, the drugs tested to date have not proven to be clinically beneficial, and lung transplantation remains the only viable treatment for IPF.
Gene expression profiling studies have demonstrated that transcriptional changes are present in the lung parenchyma of individuals with IPF/UIP.2–5 In aggregate, these studies have consistently identified similar genes and pathways that are differentially expressed in fibrotic lungs. We hypothesised that gene expression profiling of a large set of IPF/UIP cases may allow us to identify novel molecular subcategories and develop a method to classify this group of complex diseases which is ultimately more predictive of clinically meaningful endpoints. Herein, we collected transcriptional profiles on lung tissue from 119 patients with IPF/UIP and 50 non-diseased controls. We identified a strong molecular signature associated with the expression of cilium genes that divides IPF/UIP into two subtypes, one with increased cilium gene expression and one with low expression of cilium genes. Higher expression of cilium-associated genes was associated with microscopic honeycombing, and this was validated in an independent cohort of 111 patients with IPF/UIP.
Methods
Patients and tissue samples
All human tissue was collected with appropriate ethical review for the protection of the patients. The Lung Tissue Research Consortium (LTRC; http://www.ltrcpublic.com/) IPF/UIP cohort was used to derive gene expression signatures. National Jewish Health (NJH) IPF/UIP cohort was used to validate gene expression signatures. The control tissue cohort was divided to provide control lung expression profiles for both derivation and validation stages.
Patients and tissue samples
Lung tissue specimens from lower (n=90), upper (n=20) and middle/lingula (n=9) lobes from patients with IIP (final LTRC diagnosis based on clinical, radiologic and pathologic diagnoses) were obtained from the LTRC. Samples were selected based on tissue availability from the LTRC. We prioritised samples from lower lobes (left or right) followed by upper lobes (left or right) followed by right middle or lingula. We also prioritised flash-frozen over RNALater-preserved tissue. The LTRC is a resource created by the National Heart Lung and Blood Institute (NHLBI) to provide human lung tissue and DNA to qualified investigators for use in research. The programme enrols donors who are anticipating lung surgery, collects blood and extensive phenotypic data from them, and then processes their surgical waste tissues for research use. Most donors have fibrotic interstitial lung disease or chronic obstructive pulmonary disease (COPD). Clinical data include clinical and pathological diagnoses, chest CT images, pulmonary function tests (spirometry, DLCO and ABG), exposure (including cigarette smoking history) and symptom questionnaires (including Borg dyspnoea scale), and family history of lung disease.
Additional specimens from the same individuals in the LTRC cohort were selected to examine consistency of the gene expression signature in additional lung lobes. For this, we used an additional 50 specimens (2 lower, 11 upper and 37 middle/lingula lobes) from 45 individuals (one additional specimen for 40 and two additional specimens for five individuals).
Control, non-diseased lung tissue from lower (n=86), and middle (n=4) lobes was obtained from the International Institute for Advancement of Medicine, formerly Tissue Transformation Technologies (Edison, New Jersey, USA). All individuals had suffered brain death and were evaluated for organ transplantation before research consent. Informed consent was obtained at the time of transplant evaluation. All specimens failed regional lung selection criteria for transplantation. Individuals had to demonstrate no evidence of active infection or chest radiographic abnormalities, mechanical ventilation <48 h, PaO2/FiO2 ratio >200, and no past medical history of underlying lung disease or systemic disease that involves the lungs (eg, rheumatoid arthritis). Lung samples were procured within 34 h after brain death (mean, 16.2 h; range, 4.5–33.25 h).
The NJH IPF cohort consists of 111 IPF/UIP patients that were clinically evaluated by investigators at NJH. All persons in this cohort have undergone a standardised evaluation designed to provide a specific diagnosis. The evaluation included a standardised history focused on the presence of current or previous systemic disease; medications; tobacco and recreational drug use; familial lung disease; avocational, occupational, environmental and accidental exposures. Additional testing includes serologic evaluation for evidence of systemic disease, chest radiography, pulmonary physiology (including lung volumes by body plethysmography, spirometry before and after inhaled bronchodilator and diffusing capacity), pressure volume curves and gas exchange with exercise (formal 6 min walk testing and/or cardiopulmonary exercise testing). Video-assisted thorascopic or open surgical lung biopsy was performed as clinically indicated. The diagnosis of IIP was established using the criteria defined in the American Thoracic Society (ATS)/European Respiratory Society (ERS) consensus statement.1 ,6
Microarray data generation
Total RNA was isolated from approximately 100 mg of flash-frozen lung tissue using the mirVana kit (Ambion). RNA purity and concentration were determined by spectrophotometry, and RNA integrity was determined using the Bioanalyzer (Agilent). mRNA microarray target labelling was conducted using 300 ng of total RNA and the Message Amp II kit (Ambion), hybridised to the Human Gene 1.0 ST Array (Affymetrix) and processed according to the manufacturer's instructions. All microarray data met the quality control criteria established by the Tumour Analysis Best Practices Working Group7 and are available in the Gene Expression Omnibus repository as GSE31962.
Microarray data analysis
Expression data from 169 mRNA arrays (119 LTRC IPF/UIP patients and 50 controls) were analysed using analysis of covariance (ANCOVA) and hierarchical clustering methods implemented in Partek. Intensity data were imported, log2-transformed and quantile normalised using robust multi-array average (RMA),8 and expression levels were summarised on a transcript level using the mean value of all probe sets mapping to a transcript. Non-expressed and invariant transcripts were removed using a median variance filter, corrected by a Benjamini–Hochberg false discovery rate (FDR) of 0.10,9 resulting in a final dataset of 11 950 transcript measurements across 169 samples. Differential expression of individual transcripts between IPF and control groups was identified using an ANCOVA model incorporating the final clinical diagnosis of each patient as well as age, gender and smoking status. Additional lobe and NJH IPF/UIP mRNA expression profiles were collected and processed in the same manner as the LTRC IPF/UIP samples, with the exception of the final filtering step; in this case, 11 950 transcripts from the LTRC dataset were retained in the dataset. Additional lobe and NJH datasets were only used for hierarchical clustering/principal components analysis, and no statistical tests were performed on these datasets. Transcriptional network analysis was performed using the Ingenuity Pathway Analysis (IPA) software.
Histological evaluation
Histological correlates of differential expression were examined using haematoxylin and eosin-stained tissue sections of all IPF/UIP cases. Slides were obtained from formalin fixed tissue blocks of lung tissue adjacent to the frozen tissue used for transcriptional profiling, and each slide was examined independently and blindly by two established pulmonary pathologists. In the case of disagreement (∼25% of the cases), the two pathologists met and agreed on a final score. Each sample was given a score from 0 to 2 on the presence and extent of microscopic honeycombing and fibroblastic foci in the sample.
Quantitative RT-PCR
Primers for SYBR Green assays for DNAH6, DNAH7, DNAI1, RPGRIP1L and GAPDH were designed using Primer-BLAST, and are listed in online supplementary table S1. MUC5B expression levels were determined using a prevalidated MUC5B (Hs00861588_m1) Taqman gene expression assay, and normalised to the prevalidated GAPDH (Hs99999905_g1). RNA was normalised to a concentration of 100 ng/µL and reverse transcribed to cDNA using the Applied Biosystems High Capacity cDNA Reverse Transcription Kit. Each 20-µL SYBRGreen PCR contained 15 ng cDNA, 0.5 µM final concentration of forward and reverse primers, and 1× final concentration of the Power SYBR Green master mix. Real-time PCR was performed on an Applied Biosystems Viia 7 instrument using the following profile: 50°C for 2 min, 95°C for 10 min, and 40 cycles of 95°C for 15 s, and 60°C for 1 min. Dissociation curves were collected at the end of each run. Taqman assays were performed according to manufacturer's instructions. Both SYBRGreen and Taqman data were analysed using the ΔΔCT relative quantification method.10 ΔCT values were calculated relative to GAPDH, and ΔΔCT values were calculated by comparison among different groups of samples.
Results
Demographic characteristics
Table 1 summarises demographic and clinical characteristics of the LTRC IPF/UIP patients and the non-diseased control cohort used in the derivation analysis. The IPF/UIP cohort is older and composed of more Caucasians than the controls. Although there are no statistically significant differences in gender between the two groups, there are more men in the IPF/UIP cohort than in the controls. Approximately half the individuals with IPF/UIP are former smokers, as compared with controls who are almost 50% current smokers. IPF/UIP individuals, on average, have smoked more cigarettes than controls, but there is substantial variability in pack years in the IPF/UIP cohort.
Patient demographics and clinical characteristics of the derivation (LTRC) cohort
Novel molecular subtype of IPF/UIP
To identify molecular profiles associated with clinically defined subtypes of IPF/UIP, we used an ANCOVA model that incorporates disease status, age, gender and smoking status as factors. Although gender is not statistically different between cases and controls, there are more men in the IPF cohort, and being male is a known risk factor for development of IPF; we therefore chose to include it in the model. We initially considered the impact of several technical variables (array batch, RNA preservative and RNA quality (Bioanalyzer RIN)) as well as additional demographic (race) and clinical variables (lobe-specific emphysema and sum emphysema on high-resolution CT scan). Minimal expression changes were associated with these variables, and we therefore did not include them in the final model (data not shown). Disease status had the largest impact on gene expression with 5465 transcripts meeting the 5% FDR criteria for differential expression in IPF/UIP compared with controls (see online supplementary table S2), while other factors had substantially fewer differentially expressed transcripts associated with them. We also controlled for smoking using pack years instead of smoking status; this also did not significantly change the results (data not shown). To focus on the most prominent changes in mRNA profiles, we conducted posthoc clustering of the 472 differentially expressed mRNA transcripts using 5% FDR and two-fold change criteria. Hierarchical clustering of IPF/UIP and control samples is shown in online supplementary figure S1A and IPF/UIP samples only in figure 1. Figure 1 also illustrates the presence of two groups of patients with IPF/UIP and six clusters of transcripts (A–F). The most prominent feature of the heatmap is the group of 51 patients (43%; patient Group II) with relatively high expression compared with 68 patients (57%; patient Group I) of a large set of transcripts (transcript clusters A and B) and low expression of another set of transcripts (transcript cluster C).
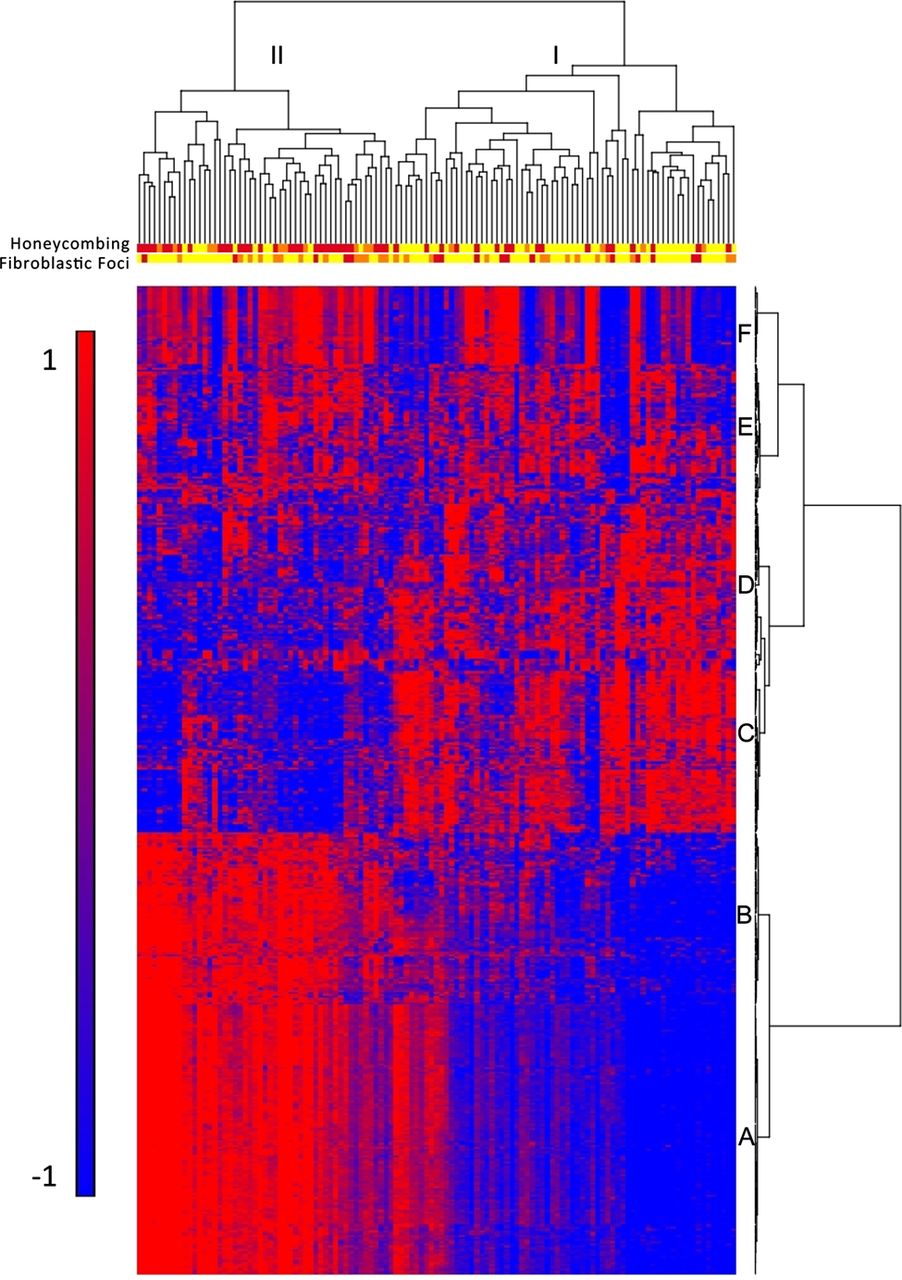
Gene expression profiling identifies two subtypes of idiopathic pulmonary fibrosis/usual interstitial pneumonia (IPF/UIP). mRNA Profiles from 119 IPF/UIP lungs were subject to hierarchical clustering based on the expression of 472 transcripts that are differentially expressed at 5% false discovery rate (FDR) and with greater than twofold change in IPF/UIP compared with control lung. The distance metric is Euclidean, with complete linkage across samples and Ward's linkage across genes. Extent of honeycombing and fibroblastic foci in each sample as assessed by pathology is depicted by the color: yellow (unscored/not present), orange (rare), red (present).
Transcript cluster B contains 80 unique transcripts upregulated in Group II compared with Group I IPF (see online supplementary table S3) that include a number of genes that have been previously shown to be upregulated in IPF/UIP, namely osteopontin, MMP1, MMP7, PLUNC, MUC5B, collagen COL17A1 and keratins 5, 6C, 15 and 17. However, we now demonstrate that these IPF/UIP-associated genes differentiate two subpopulations of patients with IPF/UIP (see online supplementary figure S2 for MUC5B and online supplementary figure S3 for MMP7 expression in Groups I and II IPF). Cluster C contains 71 unique transcripts that are downregulated in Group II compared with Group I IPF (see online supplementary table S4) with a few previously implicated in IPF (Advanced Glycosylation End Product-specific Receptor (AGER)2) or other chronic lung diseases (Hedgehog Interacting Protein (HHIP)11 ,12), and many novel IPF candidate genes. Functional enrichment analysis, using Fisher exact test, of the 121 unique transcripts in cluster A (see online supplementary table S5) showed it to be strongly enriched in transcripts associated with the cilium genes (Benjamini corrected p value 3.7×10⁻¹¹) and their structural components (axoneme, 3.9×10⁻¹¹, dynein, 9.4×10⁻⁷). This cluster also contains a number of genes with unknown function. We confirmed expression of cilium-associated mRNAs (DNAH6, DNAH7, DNAI1 and RPGRIP1L) as well as MUC5B in the LTRC patients with IPF/UIP and controls by quantitative RT-PCR (figure 2).

Quantitative real-time PCR confirms increased expression of cilium-associated genes in patient Group II. Plotted are average fold change for Group I idiopathic pulmonary fibrosis/ usual interstitial pneumonia (IPF/UIP) compared with control lung (blue bars) and Group II IPF/UIP compared with controls (red bars) for four cilium-associated genes and MUC5B. Y axis is logarithmic scale and error bars represent standard deviations. Significant gene expression differences, as assessed by a two-tailed Student t test, between Group II and Group I IPF/UIP were observed for all genes (p=2.26×10⁻⁴ for RPGRIP1, p=4.94×10⁻¹⁶ for DNAH6, p=1.57×10⁻²² for DNAH7, p=4.96×10⁻¹³ for DNAI1, and p=1.28×10⁻¹¹ for MUC5B).
LTRC patients with IPF/UIP in Group II do not differ in age, gender or smoking status from those in Group I (table 2). They also do not differ in St George's score of overall lung health, medication use (corticosteroids and immunosuppressants), lung function measures, nor the extent of honeycombing determined by radiological examination (high-resolution CT scan) (table 2). To evaluate whether patients in Group II have a unique clinical presentation of IPF/UIP, we assessed the extent of microscopic honeycombing and fibroblastic foci, which are histologic characteristics of IPF/UIP. We performed semiquantitative assessment (scores 0–2) of these two pathological features on H&E stained sections of lung tissue of all 119 IPF/UIP cases. Among patients with IPF/UIP, there were more individuals with higher scores for microscopic honeycombing (p<0.0001; OR=7.60; 95% CI 3.29 to 17.6, Fisher Exact test) but not fibroblastic foci (p=1.00; OR=1.00; 95% CI 0.468 to 2.14; Fisher Exact test) in Group II compared with Group I (table 2). The histologic differences between the two groups of patients with IPF/UIP are depicted in the dendogram in figure 1. Taken together, these findings suggest that Groups I and II represent novel molecular phenotypes of IPF/UIP and may be important in distinguishing clinical subtypes of this disease.
Patient demographics and clinical characteristics of the idiopathic pulmonary fibrosis/usual interstitial pneumonia (IPF/UIP) cohort by Groups I and II from figure 1
Transcriptional network analysis of genes that define novel molecular phenotypes
We next sought to identify transcriptional networks associated with changes in gene expression between Group I and Group II IPF/UIP. From 5465 significantly differentially expressed transcripts in IPF/UIP versus controls (5% FDR in the ANCOVA model), we selected genes that are upregulated or downregulated by >1.5-fold change in Group II compared with Group I IPF/UIP. The two sets of genes (upregulated and downregulated) were separately analysed in IPA to identify three highly significant (score >40) transcriptional networks in each dataset. The most significant network of upregulated genes (figure 3) contains cilium genes as well as transcription factors that regulate expression of cilium genes (FOXJ1, RFX2 and RFX3). The second and third networks of upregulated genes (see online supplementary figure S4) consist of keratins, G-protein-coupled receptors, glutathione-S-transferases (Network 2), collagens, mucins, and MMP13 (Network 3). Downregulated genes form networks (see online supplementary figure S5) of surfactant proteins and genes involved in coagulation (Network 1), G-protein-coupled receptors (Network 2), T-box transcription factors, immune genes (AGER, IL7R), and adhesion molecules (ICAM2, cadherin 5) (Network 3).

The most significant network (Network 1; score=51) of genes that are upregulated at >1.5-fold change in Group II compared with Group I IPF/UIP. The score is defined as –log (p value) of the likelihood of the focus genes in a network being found together due to random chance. Networks were constructed using only direct relationships (solid lines). Genes are coloured by fold change. Legend: horizontal ellipse=transcriptional regulator, square=cytokine, double circle=group/complex, diamond=enzyme, trapezoid=transporter, rectangle=ion channel, circle=other.
We also used the upstream regulator module in IPA to identify transcription factors whose binding sites are enriched in promoters of differentially expressed genes in Groups I and II IPF/UIP (see online supplementary table S6). The most significant transcription factor in the upregulated dataset (Group II vs Group I) is RFX3 (2.55E-07), the transcription factor with central importance in expression of axonemal dyneins involved in ciliary motility.13 Other significant transcription factors in the upregulated dataset (ETV3, FOSL1, ZNF384 and CDX2) regulate expression of metalloproteinases and osteopontin, among others. Significant transcription factors in the downregulated set of genes include CEBPA, SP1, NKX2 and NFATC3, all involved in immune gene regulation, among others. The results of the transcriptional network analysis, similar to hierarchical clustering (figure 1) suggest that the most novel and statistically significant set of genes that differentiated Groups I and II IPF/UIP are the cilium genes.
Cilium genes and novel molecular phenotypes
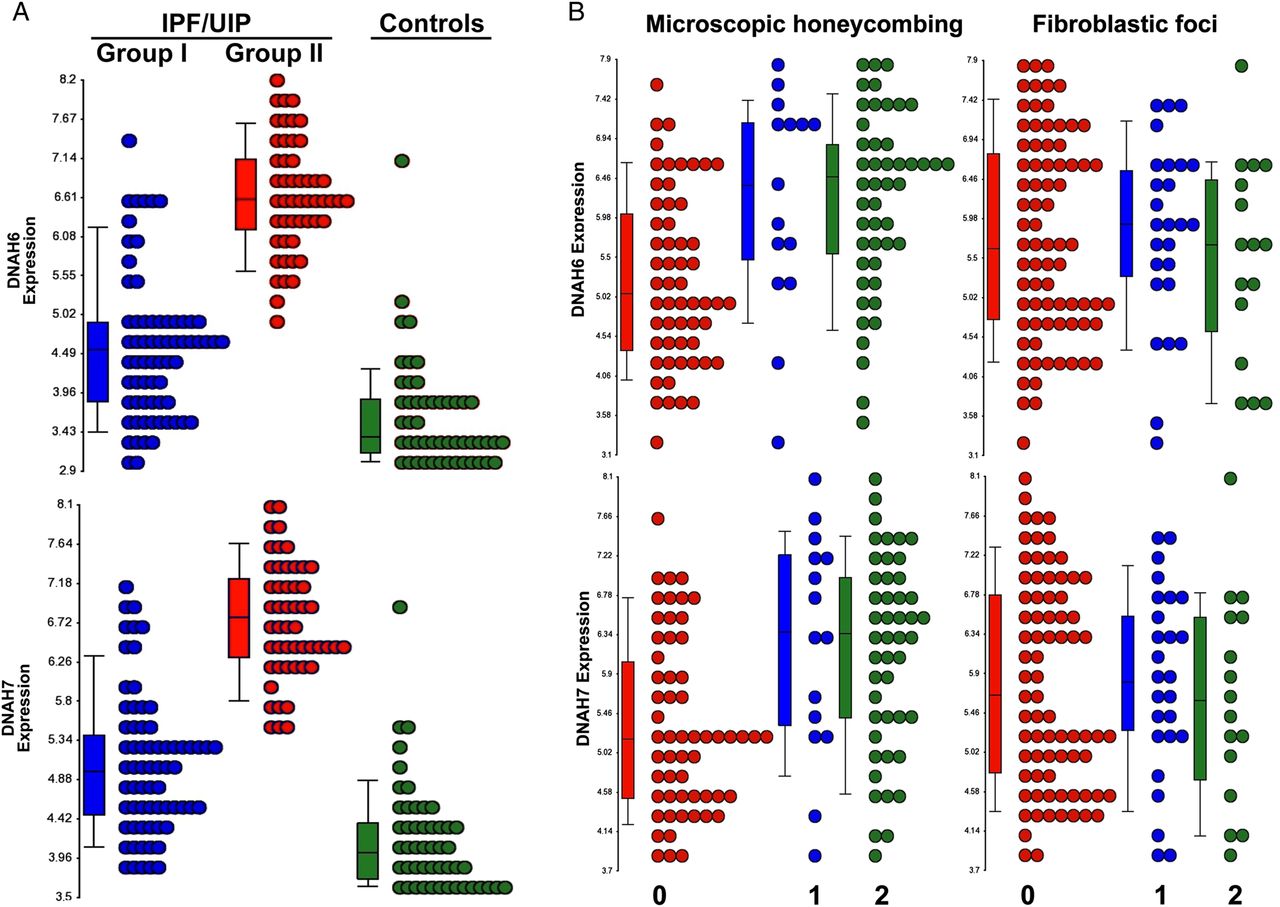
To further explore the role of the cilium and its structural components in defining these novel molecular phenotypes of IPF/UIP, we examined expression levels of all cilium-associated transcripts (Gene Ontology (GO) category 0005929, cellular component cilium) in LTRC IPF/UIP patients. This analysis (see online supplementary figure S6) reveals that the majority of the transcripts (40/59) exhibit the pattern of higher gene expression in Group II compared with Group I. Shown in figure 4A are representative dot plots for two dynein genes, DNAH6 and DNAH7, in the LTRC IPF/UIP cohort and non-diseased controls, that demonstrate bimodal distribution with a subset of IPF/UIP samples expressing lower levels (Group I) and another group of IPF/UIP patients with a significantly higher expression of these cilium genes (Group II). We also examined dot plots of expression levels of the two genes grouped by the extent of honeycombing and fibroblastic foci, and demonstrated a correlation between higher expression of cilium-associated genes and microscopic honeycombing but not fibroblastic foci (figure 4B). Taken together, these data suggest that two novel subtypes of IPF/UIP are defined largely by the expression of cilium-associated genes, and that the expression of cilium-associated genes is also associated with microscopic honeycombing.

Expression of cilium-associated genes distinguishes Groups I and II and defines two subcategories of idiopathic pulmonary fibrosis/usual interstitial pneumonia (IPF/UIP). (A) Representative dot plots of two cilium-associated genes DNAH6 and DNAH7 illustrate bimodal distribution of gene expression in IPF; Group I IPF=blue, Group II IPF=red, control=green. One-way analysis of variance (ANOVA) p values are: <0.0001 for both DNAH6 and DNAH7 and association with disease category. (B) Expression levels of DNAH6 and DNAH7 correlate with the extent of microscopic honeycombing (left) but not with the presence of fibroblastic foci (right). Scores: 0=not present, 1=rare, 2=present. One-way ANOVA p values are: <0.0001 for DNAH6 and 0.0001 for DNAH7 and association with microscopic honeycombing scores; 0.705 for DNAH6 and 0.840 for DNAH7 and association with fibroblastic foci scores.
Validation of gene expression in additional lobes from the same IPF/UIP patients
To assess generalisability of our findings, we profiled additional lung lobes from 23 Group I and 22 Group II IPF/UIP patients. Given that initial profiling was done on mostly lower lobes, the additional specimens were largely from either middle/lingula or upper lobes. Forty patients had one additional sample profiled, while five had two additional sample profiled. Principal components analysis of 472 genes that were selected in the derivation analysis (figure 1) revealed that expression profiles of middle and upper lobes from Group I and Group II IPF/UIP are distinguishable, but that differences are attenuated compared with the initial analysis of lower lobes (see online Supplementary figure S7A). The same conclusion can be reached by examining expression levels of selected individual genes, DNAH6, DNAH7, MUC5B and MMP7 (see online supplementary figure S7B). These data are consistent with the presence of more extensive disease in lower than in the middle and upper lobes, however, they suggest that the gene expression signature is generalisable and reflective of the disease process.
Validation of gene expression in an independent IPF/UIP cohort
Expression of cilium-associated genes was validated in an independent cohort of 111 IPF/UIP (NJH cohort; see online supplementary table S7). Similar to the LTRC cohort, patients in Group II are slightly older than patients in Group I, but are comparable in gender, smoking status and lung function with IPF/UIP patients in Group I. Hierarchical clustering of samples based on expression profiles of cilium genes recapitulated our findings from the LTRC cohort and divided samples into two groups, 72 (65%) with low cilium gene expression and 39 (35%) with high cilium gene expression (see online supplementary figure S8). Histopathological examination of sections adjacent to the tissue that was profiled identified a borderline significant association of presence in Group II IPF and higher microscopic honeycombing score (p=0.054; OR=2.14; 95% CI0.94 to 4.88; Fisher Exact test) but not fibroblastic foci score (p=0.53; OR=1.06; 95% CI 0.46 to 2.46: Fisher Exact test). The strength of association of being classified as belonging to Group II IPF with higher incidence of microscopic honeycombing is weaker in the NJH than in LTRC cohort. One potential explanation for this finding is the fact that the NJH cohort may represent milder disease as assessed by more preserved lung function (% predicted FVC and DLCO; figure 1 and online supplementary table S7). Finally, we also validated elevated expression of MUC5B in Group II IPF in the NJH cohort both by array and qPCR and MMP7 by arrays (see online supplementary figure S2).
Discussion
Our findings demonstrate that expression of cilium genes identifies two unique clinical phenotypes of IPF/UIP. Patients with high cilium gene expression demonstrate more microscopic honeycombing, but not fibroblastic foci, and have elevated tissue expression of MUC5B and MMP7. This novel expression signature of IPF/UIP was validated in an independent cohort of patients with IPF/UIP.
The results indicate that the IPF/UIP phenotype is heterogeneous and consists of at least two subtypes. The two molecular phenotypes of IPF/UIP shown here are characterised by differences in expression of several genes that have been extensively studied in the context of lung fibrosis, as well as cilium-associated genes that have not been previously implicated in IPF/UIP. However, development-related signalling pathways in the primary cilium (Sonic Hedgehog,12 ,14 fibroblast growth factor,15 ,16 platelet-derived growth factor,17 ,18 and canonical and non-canonical Wnt19 ,20 signalling) have all been extensively studied in IPF/UIP, and provide further support for the importance of cilia in this disease. The GO category we used in our analysis captures both motile and primary cilium genes. Although it is likely that motile cilia on airway epithelial cells are the main contributor to the molecular subtypes we have identified, it remains possible that other cell types in the distal airway contribute to the novel molecular subtype of IPF. While the prevailing opinion is that IPF/UIP develops as a result of excessive, sequential lung injury and/or aberrant wound healing,21 the mechanisms that account for excessive lung injury or aberrant repair in those with increased cilium gene expression remain unknown. However, these findings, in conjunction with the recent discovery that multiple cell types contribute to the proliferation in the fibrotic lesion,22 our observation that a polymorphism in the promoter of MUC5B is associated with a high risk of developing IPF/UIP,23 and the role of MMP7 in attenuating ciliated cell differentiation during wound repair24 suggest that a heterogeneous population of cells in the distal airspace may be important in the development of this disease, and that the prominence of one cell type over another may account for these unique patterns of gene expression.
A confounding factor in our analysis is the possibility that the two molecular subtypes of IPF are a result of differences in sampling of lung tissue, and that the increased expression of cilium genes represents the extent of honeycombing in an individual biopsy specimen, as honeycomb cysts are lined with ciliated epithelia. The strongest evidence against this possibility is that many other genes that are functionally unrelated to cilium (genes in clusters B and C) are differentially expressed in the two molecular subtypes of IPF. Moreover, our analysis identified transcription factors that regulate cilium expression and motility13 as significant regulators of expression profiles that differentiate Group II from Group I IPF/UIP, arguing for the involvement of transcriptional control rather than lung tissue sampling as the cause of differential cilium expression. Finally, gene expression profiles from different lung lobes from the same patients demonstrate the presence of the cilium gene expression signature throughout the lung. Moreover, the strength of the molecular signature correlates with known disease distribution in the lung (predominant presence in lower lobes). Another way to address this issue in the future is by isolating specific cell types or areas of the lung by laser capture microdissection and studying expression of cilium genes in these more homogeneous samples.
The molecular attributes of IPF/UIP are likely to be far more complex than is illustrated by the high cilium/low cilium expression profiles we identified in this analysis. Environmental exposures (cigarette smoke) and gene variants (MUC5B, surfactant protein C, surfactant protein A2, and two telomerase genes) associated with the development of IPF/UIP and the dynamic nature of this disease are likely to further influence these molecular phenotypes. Despite this anticipated complexity, it is likely that the molecular attributes of this disease are as informative as the radiographic and pathologic features of this disease. We found that high versus low cilium gene expression was associated with pathological features of IPF/UIP (eg, honeycombing). This further suggests that differential gene expression in IPF/UIP could potentially predict those IPF/UIP patients with different outcomes and response to pharmacological intervention. The application of gene expression profiling to identify unique molecular signatures of disease has proven useful in predicting the clinical course and response to therapy for several types of cancer, including lymphoma,25 ,26 breast cancer27 ,28 and lung cancer,29 ,30 and could prove equally important in IPF/UIP. In fact, we predict that gene variants, epigenetic changes and gene expression will eventually guide the clinician for pharmacological intervention in IPF/UIP.
References
Supplementary materials
Supplementary Data
This web only file has been produced by the BMJ Publishing Group from an electronic file supplied by the author(s) and has not been edited for content.
Files in this Data Supplement:
- Data supplement 1 - Online figures
- Data supplement 2 - Online tables
Footnotes
-
Contributors IVY, CDC, SML and MAS analysed the data; IVY, CDC, SML, TEF, MIS and DAS developed the conceptual approaches to data analysis; IVY, TEF and DAS designed the study; IVY, MIS and DAS wrote the manuscript; SDG, CDC, GPC, DAL, KKB and MIS performed clinical and pathological phenotyping of lung specimens; EM, JL, RR and AJN performed laboratory work; DFM performed database analyses.
-
Funding Supported by the National Heart, Lung and, Blood Institute (R01-HL095393). The funders had no role in study design, data collection and analysis, decision to publish, or preparation of the manuscript.
-
Competing interests DAL is a Board Member for Actelion and consultant for Actelion, Centocor, Gilead, Intermune, and Perceptive. He also receives grant funding from Siemens. KKB is a consultant for Amgen, Array Biopharma, Celgene, Centocor, Genentech, Genzyme, GeNO, Gilead, Glaxo SmithKline, Fibrogen, Ikaria, MondBiotech, Novartis, Pfizer and Stromedix. Other authors declare no competing interests.
-
Patient consent Obtained.
-
Ethics approval University of Colorado and National Jewish Health IRBs.
-
Provenance and peer review Not commissioned; externally peer reviewed.