Article Text

Abstract
Background The aims of this study were to retrospectively assess the change in findings on follow-up CT scans of patients with non-specific interstitial pneumonia (NSIP; median, 72 months; range, 3–216 months) and to clarify the correlation between the baseline CT findings and mortality.
Methods The study included 50 patients with a histologic diagnosis of NSIP. Two observers evaluated the high-resolution CT (HRCT) findings independently and classified each case into one of the following three categories: (1) compatible with NSIP, (2) compatible with UIP or (3) suggestive of alternative diagnosis. The correlation between the HRCT findings and mortality was evaluated using the Kaplan–Meier method and the log-rank test, as well as Cox proportional hazards regression models.
Results Ground-glass opacity and consolidation decreased, whereas coarseness of fibrosis and traction bronchiectasis increased on the follow-up HRCT scans, however, in 78% of cases the overall extent of parenchymal abnormalities had no change or decreased. Patients with HRCT diagnosed compatible with NSIP had a longer survival than those with HRCT findings more compatible UIP or an alternative diagnosis. On multivariate analysis, the coarseness of fibrosis alone was associated with prognosis (HR: 1.480; 95% CIs 1.100 to 1.990).
Conclusions The HRCT patterns seen in patients with a histopathologic diagnosis of NSIP progress in a variable manner. Overall disease extent may decrease over time in some, while fibrosis may progress in others. The initial HRCT diagnosis may impact survival in this group of patients.
- Interstitial pneumonia
- non-specific interstitial pneumonia
- idiopathic pulmonary fibrosis
- CT
- lung
- imaging/CT MRI
- interstitial fibrosis
- pneumonia
Statistics from Altmetric.com
- Interstitial pneumonia
- non-specific interstitial pneumonia
- idiopathic pulmonary fibrosis
- CT
- lung
- imaging/CT MRI
- interstitial fibrosis
- pneumonia
Introduction
The 2002 American Thoracic Society (ATS) and the European Respiratory Society (ERS) International Consensus Panel for the Classification of Interstitial Lung Disease included idiopathic non-specific interstitial pneumonia (NSIP) as a provisional clinical diagnosis and recommended further study and characterisation of this condition.1 The multidisciplinary workshop2 showed that there is a consensus among experts that idiopathic NSIP is a distinct clinical entity with characteristic clinical, radiologic and pathologic features that differ from other idiopathic interstitial pneumonias (IIPs). The outcome is substantially better in NSIP than in idiopathic pulmonary fibrosis (IPF).
There is limited information regarding the change in pattern and distribution of HRCT findings of NSIP at long-term follow-up.3–8 Recently, Silva et al8 assessed initial CT and follow-up CT scans of 23 patients with NSIP and 25 patients with IPF, and concluded that at follow-up CT 28% (five cases) of patients with initial CT findings suggestive of NSIP progressed to findings suggestive of IPF. The purpose of our study was to retrospectively assess the change in CT pattern of NSIP at long-term follow-up and to clarify the correlation between CT findings and mortality.
Methods
Patients
Institutional review board approval was obtained for this retrospective study; informed consent was not required.
Patient selection was made by a review of the medical records of all patients who had received a histologic diagnosis of NSIP on the basis of surgical lung biopsy between 1992 and 2006. Ninety-nine patients were found and only those patients with a final clinical diagnosis of idiopathic NSIP were included. Patients with a defined connective tissue disease or a known cause of interstitial lung disease (eg, hypersensitivity pneumonitis, drug-induced lung disease) were excluded. Patients with connective tissue diseases (n=18), occupational and/or environmental exposure to a fibrogenic agent (n=5), or history of ingestion of a drug or agent known to cause pulmonary fibrosis (n=3) were excluded from the study. In all patients, the histologic diagnosis of NSIP was made by consensus agreement of two or more pathologists (9–30 years experience in lung pathology) by using the American Thoracic Society and European Respiratory Society Consensus Classification criteria.1 Seven patients did not meet the diagnosis, so were excluded. All patients underwent surgical biopsy of two or more lobes. Six patients revealed established connective tissue disease (CTD) during the follow-up. These six patients were excluded in this study. In addition, 10 had to be excluded because their thin-section CT and/or follow-up CT scans were not available. The study therefore included 50 patients.
HRCT images
The initial HRCT scans were obtained within 1 month before surgical lung biopsy. The initial and last HRCT scan findings of 50 patients with NSIP were evaluated retrospectively. The interval between the initial and last HRCT scans ranged from 3 to 216 months (median, 72 months). The protocols consisted of 1–2-mm collimation sections reconstructed with a high-spatial-frequency algorithm at 1- or 2-cm intervals. The images were reviewed in random order by two radiologists. The images were assessed independently without knowledge of the clinical information, histologic diagnosis or whether the scans were initial or follow-up studies. Findings were agreed upon by consensus between two radiologists. Patterns of ground glass attenuation, airspace consolidation, irregular intralobular reticular opacities, honeycombing, cysts, emphysema and traction bronchiectasis. Patterns were defined in accordance with the current Fleischner recommendations.9 The observers evaluated the overall extent of parenchymal abnormalities and the extents of ground-glass opacity, consolidation, reticulation, emphysema and honeycombing, that were present in both lungs, to determine the percentage of lung parenchyma occupied by the disease. The lungs were divided into six zones and each zone was evaluated separately. The six areas of the lung included the upper zones, above the level of the carina; the middle zones, between the level of the carina and the level of the inferior pulmonary veins; and the lower zones, under the level of the inferior pulmonary veins. The score was based on the percentage of the lung parenchyma that showed evidence of the abnormality and was estimated to the nearest 10% of parenchymal involvement. The overall percentage of lung involvement was calculated by averaging the six lung zones.
The extent of traction bronchiectasis was quantified by assessing the generations of the most proximal bronchial branches that were involved.10 The images were also scored for the coarseness of fibrosis as described by Copley et al.11
After review of the findings, the HRCT scans in each case were classified by consensus between the two observers into one of the following three categories: compatible with NSIP; compatible with UIP or suggestive of alternative diagnosis. HRCT diagnosis compatible with NSIP included extensive ground-glass opacity, no or only mild reticulation, traction bronchiectasis, no or only minimal honeycombing, basal predominance and relatively subpleural sparing; or moderate ground-glass opacity with overall extent greater than the extent of reticulation, traction bronchiectasis, no or only minimal honeycombing and basal predominance of abnormalities. HRCT diagnosis compatible with UIP included reticulation in all lobes, moderate or extensive honeycombing, no or minimal ground-glass opacity and peripheral and basal predominance; or bilateral reticulation, mild honeycombing, mild to moderate ground-glass opacity with overall extent of ground-glass opacity being less than the extent of reticulation and peripheral and basal predominance of abnormalities.8 The HRCT scan was also classified as showing a UIP pattern when it demonstrated moderate or extensive reticulation, no or minimal ground-glass opacity, inhomogeneity of parenchymal abnormalities, and peripheral and basal predominance, even if there was no honeycombing. The HRCT was classified as suggestive of alternative diagnosis when alternatives to UIP or NSIP were more appropriate. In addition, to assess changes that occurred over time, the HRCT scans in each patient were examined in sequence. The pattern, extent and distribution of abnormal HRCT findings were compared with findings in the same region on previous and subsequent HRCT scans.
Statistical analysis
All statistical analyses were performed using SPSS statistical software (version 12.0J, 2003; SPSS, Inc.). Interobserver agreement for the existence of parenchymal abnormalities was analysed with the Cohen's κ statistic. Variations in quantitative data were expressed as a single determination SD.12 Group comparisons were made by using a paired t test or χ2 statistic. Univariate and multivariate Cox proportional hazards regression models were used to identify independent CT predictors of outcome. On multivariate analysis, the variables included overall extent, ground-glass opacity, reticular opacities, honeycombing, consolidation, traction bronchiectasis, and coarseness of fibrosis, adjusting for demographic characteristics (age, sex and smoking habit) and physiologic data (FVC, DLco and PaO2). We assessed multicollinearity by using the Variance Inflation Factor (VIF). The variable was excluded from the model if values of VIF exceed 10. Thereafter, a stepwise logistic regression model was built using variables with univariate p values of less than 0.20, entering variables at the 0.05 significant level and removing them at the 0.10 level. The potential predictors were identified by means of stepwise backwards regression. Proportional hazard assumptions were tested by using supremum tests and the exact method was used for ties.
Patient survival between the CT patterns was determined using the log-rank test and displayed using Kaplan–Meier curves. A p value of less than 0.05 was considered to indicate statistical significant.
Results
The patients studied consisted of 26 men and 24 women, with a mean age of 56 years (range, 20–75 year). Smokers were seven patients, non-smokers were 25 patients and ex-smokers were 18 patients. The treatments were started after surgical lung biopsy. Twenty-four patients received prednisone alone, nine patients prednisone and cyclosporine A, seven patients prednisone and azathioprine, six patients prednisone and cyclophosphamide, and four patients prednisone, azathioprine and cyclophosphamide. Clinical and demographic features at the initial HRCT scan are shown in table 1.
Baseline clinical and demographic features of patients
Interobserver agreement for the presence of HRCT features was moderate to good (κ=0.43–0.89). Interobserver variation in quantitative data, expressed as the single determination SD, ranging from 4.2% to 8.9%. The parenchymal abnormalities found on the initial and last HRCT scans of all patients are presented in table 2. The mean overall extent of abnormal lung parenchyma on the initial CT was 16.6%. There was a significant reduction (>10% reduction) in overall extent in 19 patients and increase (>10% increase) in 11 patients (figure 1). The parenchymal abnormalities had resolved completely in five patients. Ground-glass opacity and consolidation decreased, whereas coarseness of fibrosis increased in both patients with no change and a significant increase in overall extent (figure 2). There was an improvement in traction bronchiectasis in seven patients and worsening in 32 patients. There were statistically significant differences between scans in honeycombing, consolidation, the coarseness of fibrosis and traction bronchiectasis. In 13 (26%) patients, honeycombing newly appeared on the last HRCT scans. The honeycombing was seen in focal areas of the lungs on one transverse section in five (38%) of these 13 patients. In four (31%) of these 13 patients, the honeycombing showed atypical distribution compared to that of IPF. The honeycombing was seen on several sites in upper or middle lungs in two of these four. In the remaining two patients, the cluster of cysts was distributed along with the bronchovascular bundles in central portion of the lung, suggesting that they consisted of traction bronchiectasis with collapse. In two patients, the honeycombing was in unilateral distribution. Another two patients showed fine honeycombing (figure 3). The honeycombing seen on the initial HRCT scans in four patients was focal and had no change on the follow-up HRCT scans during 3 months, 36 months, 48 months and 71 months interval, respectively. Isolated large cysts were seen in six patients on the initial scans and in 11 patients on the last scans (online supplement figure).
High-resolution CT findings in initial and last scans

Changes in overall extent of parenchymal abnormalities during the follow-up period.

Non-specific interstitial pneumonia in 57-year-old man. The initial HRCT scan (A) shows patchy areas of ground-glass attenuation and consolidation with reticulation and traction bronchiectasis. The last HRCT scan obtained at 5 year follow-up (B) shows decrease of ground-glass opacity and consolidation and increase of reticulation and traction bronchiectasis.

Non-specific interstitial pneumonia in 43-year-old woman. The initial HRCT scan (A) shows areas of ground-glass attenuation and consolidation in peribronchovascular distribution. The last HRCT scan obtained at 9 year follow-up (B) shows decrease of consolidation and uniform minute cystic spaces of honeycombing.
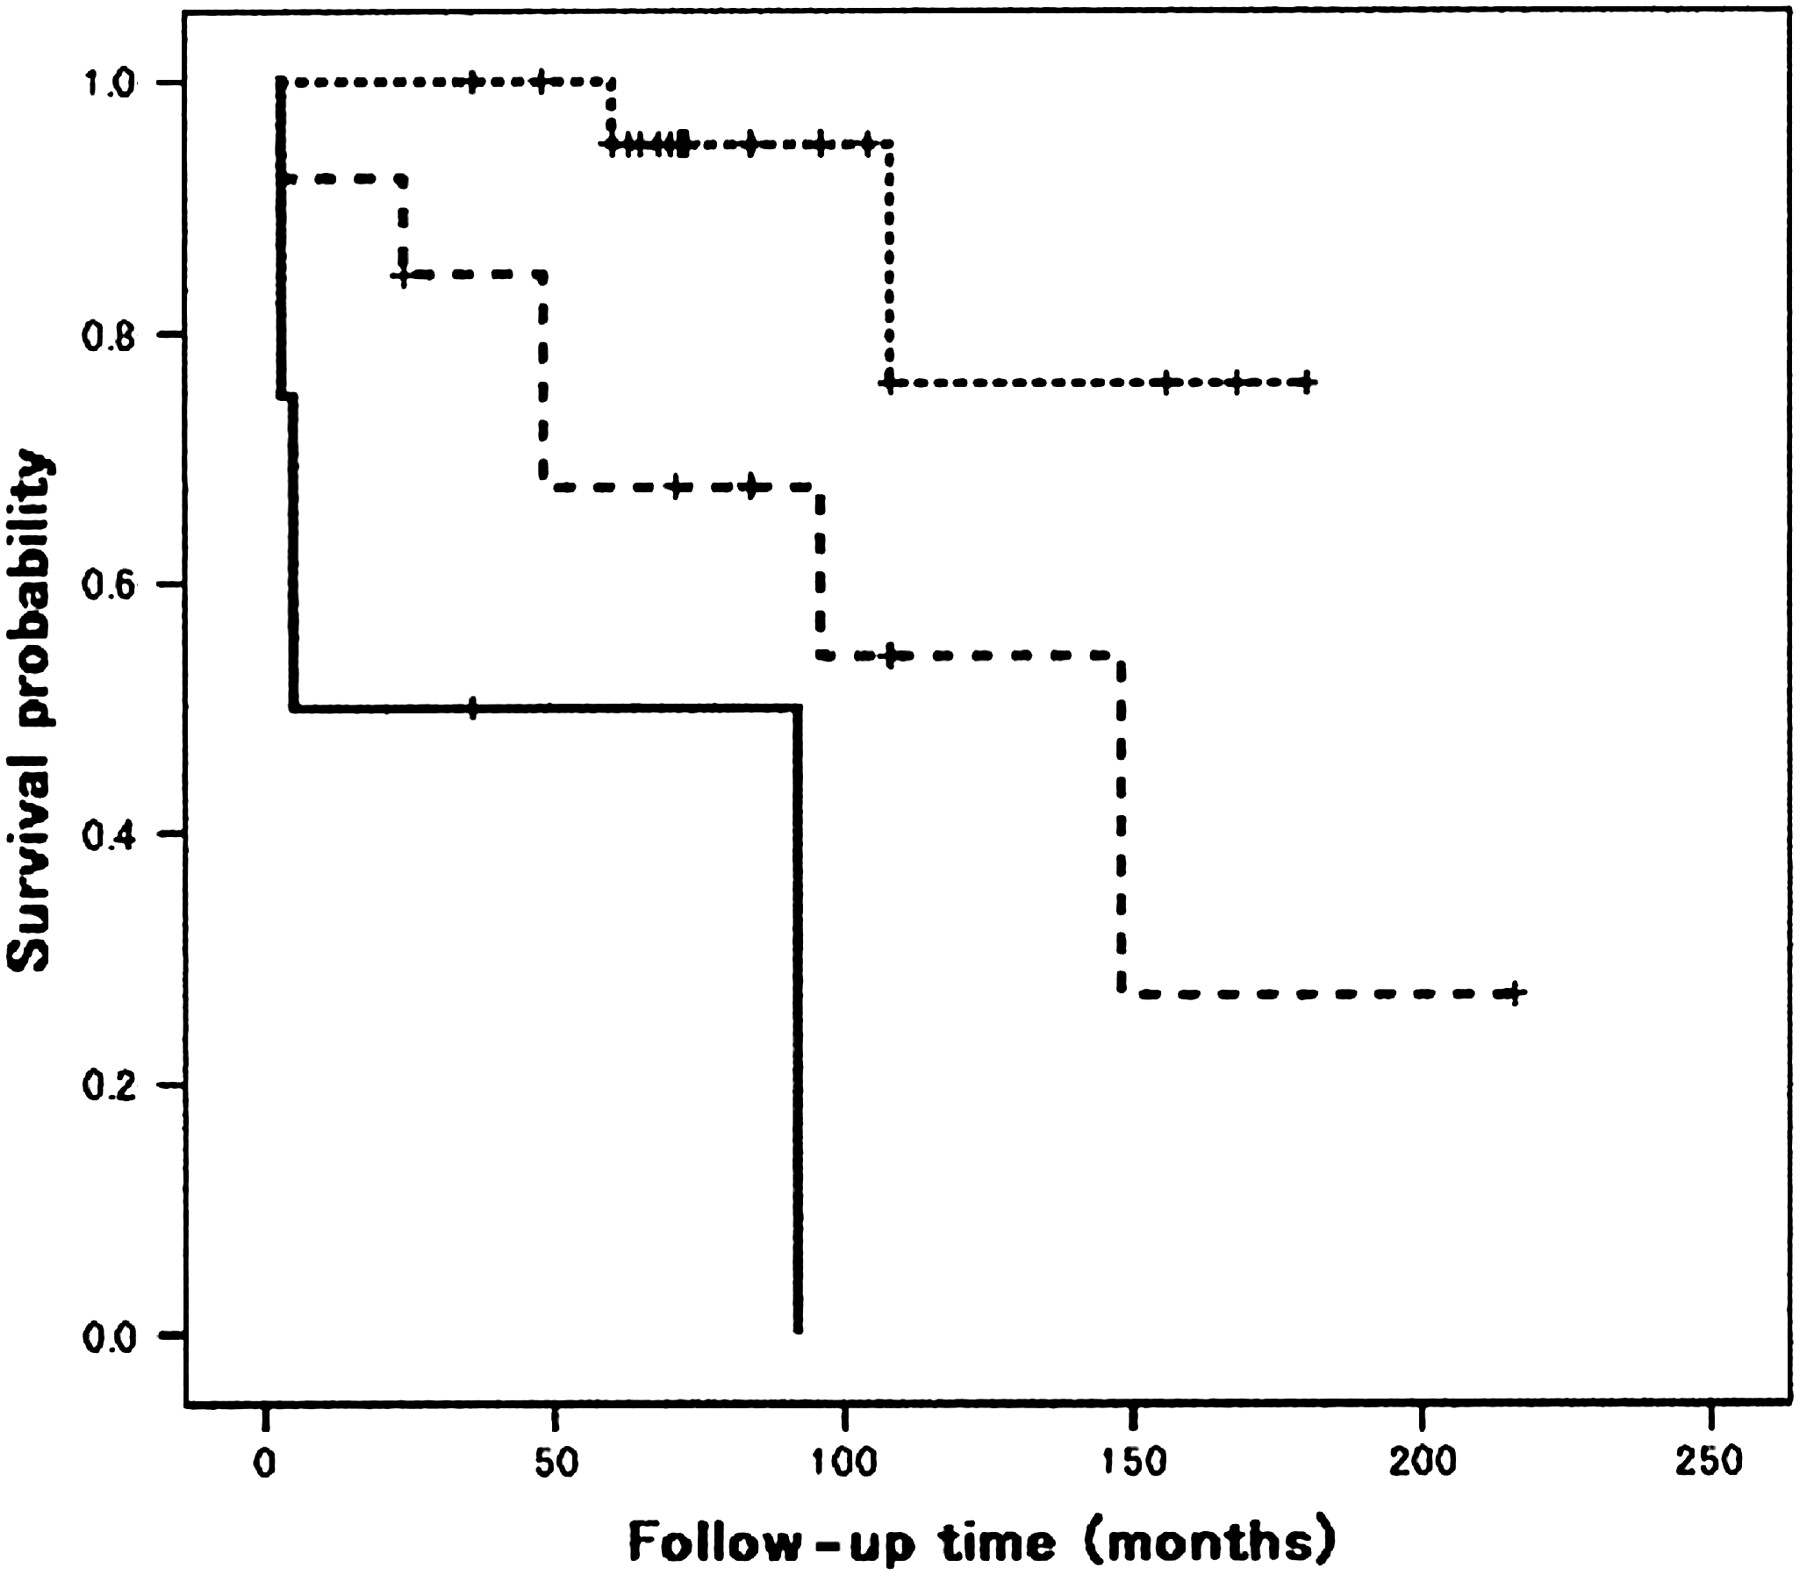
Thirty of the 50 HRCT scans were classified as compatible with NSIP, four as compatible with UIP, 16 as suggestive of an alternative diagnosis. The alternative diagnosis included cryptogenic organising pneumonia (n=4), chronic hypersensitivity pneumonia (n=5), lymphocytic interstitial pneumonia (n=1), acute interstitial pneumonia (n=1) and unclassified (n=5). The HRCT findings of each HRCT category are shown in the online supplement table. The prognosis of six patients with cellular NSIP was better, and all these were alive with improvement, so only patients with mixed or fibrotic NSIP were evaluated with regard to prognosis. The Kaplan–Meier survival curves and their relation to the pattern of abnormality on HRCT are shown in figure 4. The mean survivals of patients with a HRCT diagnosis compatible with NSIP, a HRCT diagnosis compatible with UIP and HRCT findings suggestive of alternative diagnosis were 160, 42 and 122 months, respectively, and the median survivals were 4 month for patients with a HRCT diagnosis compatible with UIP and 148 months for patients with HRCT findings suggestive of alternative diagnosis. Patients with HRCT diagnosed compatible with NSIP had a longer survival than those with HRCT diagnosed compatible UIP (p≤0.001) and those with HRCT findings suggestive of alternative diagnosis (p=0.022). There was a strong trend (p=0.054) that patients with HRCT findings suggestive of alternative diagnosis had a longer survival than those with HRCT diagnosed compatible with UIP.
Kaplan–Meier survival curves for cases with a HRCT diagnosis compatible with NSIP (n=25, dotted line), a HRCT diagnosis compatible with UIP (n=4, solid line) and findings suggestive of alternative diagnosis (n=15, dashed line).
The results of Cox regression analysis for the relationship between the HRCT findings and prognosis are shown in table 3. On univariate analysis, coarseness of fibrosis, honeycombing extent and baseline FVC were significant predictors. On multivariate analysis, only the coarseness of fibrosis was associated with prognosis (HR: 1.480; 95% CIs: 1.100 to 1.990).
Univariate analysis of survival with Cox proportional hazards regression models
Discussion
We previously reported findings on sequential HRCT scans of nine patients with NSIP. In four of these nine patients, the initial parenchymal abnormalities had resolved completely after treatment with corticosteroids, but the remaining five patients had had persist pulmonary abnormalities on CT scans including bronchiectasis and honeycomb lung.4 Silva et al8 described that 28% of patients with initial CT findings suggestive of NSIP progressed to findings suggestive of IPF. 26% (13 patients) of our cases with NSIP progressed to honeycombing. In IPF, follow-up scans show progression of honeycombing,13 but this was not seen in any patient with NSIP in our study.
Sumikawa et al10 described that in 98 patients with IPF and UIP pattern on the biopsy, the pattern of abnormality on HRCT, whether characteristic UIP or suggestive of alternative diagnosis, does not influence prognosis, and that prognosis is influenced by traction bronchiectasis and fibrotic scores (HR: 1.30 and 1.10, respectively). Lynch et al14 reported that the extent of reticulation and honeycombing on HRCT is an important independent predictor of mortality in patients with IPF. In our patients with NSIP, prognosis was influenced by coarseness of fibrosis and honeycombing, but was not influenced by traction bronchiectasis and extent of reticulation. In NSIP, some of the bronchiectasis were reversible. It was difficult to differentiate irreversible traction bronchiectasis from reversible bronchiectasis.
Flaherty and colleagues15 reported that patients with CT diagnosed definite or probable UIP had a shorter survival than those with indeterminate CT or CT diagnosed definite or probable NSIP. Screaton et al7 reported that in NSIP, progression on CT correlates with the predominant CT pattern, fibrosis index and extent of consolidation but not with histopathological subtype, and that a ground-glass/consolidation predominant pattern is associated with better outcome. In our study, the pattern of abnormality on thin-section CT influence prognosis, although consolidation was not associated with better outcome.
Our study has several limitations. The study was retrospective and included only patients who had surgical biopsy, and thus had a selection bias. In four patients with CT diagnosed compatible with UIP, the histologic dignosis based on surgical biopsies may have had a sampling error. Also, it may be difficult to draw any firm conclusions because there were only four patients with CT diagnosed compatible with UIP. Moreover, some patients with idiopathic NSIP probably do have a form of CTD, although we excluded six patients who developed clinical CTD during the follow-up period. However, the lower limit of a 3-month follow-up period is much too short to exclude CTD. CT scanning has come a long way between 1992 and 2006. In our institution, high-resolution CT (HRCT) techniques have not been changed since 1992, although the CT scanners were improved. It was not difficult to compare the early scans with the later ones.
In conclusion, the changes of parenchymal abnormalities on thin-section CT in NSIP were different from those seen on thin-section CT in IPF. In most NSIP patients, ground-glass opacity and consolidation decreased, whereas coarseness of fibrosis increased on the follow-up CT scans, so that the CT appearances progressed to appearances suggestive of IPF. However, in 78% of cases, the overall extent of parenchymal abnormalities had no change or decreased. Traction bronchiectasis also showed worsening, but some of traction bronchiectasis was reversible. Traction bronchiectasis may be reversible in the early stage or reversible bronchiectasis may be due to the collapse of the surrounding peripheral lung parenchyma.
In 17 (34%) of our patients on follow-up CT scans honeycombing was seen, however, the honeycombing was focal in 9 (53%) of them and in 4 (24%) the honeycombing showed atypical distribution compared to that of IPF. The honeycombing was distributed apart from lower subpleural lungs or along with bronchovascular bundles in central portion of the lung. In addition, some focal honeycombing were stable on the follow-up scans in NSIP and progression of honeycombing seen in IPF was not seen in any patient with NSIP. Bronchiectasis with collapse looks like honeycombing. Some of honeycombing seen in NSIP probably consist of traction bronchiectasis with collapse. Large cysts were found on the initial and follow-up CT scans and the aetiology of the cyst formation are unclear. In the setting of histologically proven NSIP, the HRCT diagnosis has prognostic implications. A HRCT diagnosis of UIP confers a poor outcome. By contrast, radiologic–histologic concordant NSIP is associated with a more benign course.
References
Footnotes
Funding Partially supported by a Grant to the Diffuse Lung Disease Group from the Ministry of Health Labour and Welfare, Japan, and the Grant to the Research Grant for the Respiratory Network, National Hospital Organizational, Japan.
Competing interests None.
Ethics approval This study was conducted with the approval of the Institutional review board approval was obtained for this retrospective study from NHO Kinki-Chuo Chest Medical Center.
Provenance and peer review Not commissioned; externally peer reviewed.