Article Text

Abstract
Background The assessment of medical trainees is becoming an increasingly prominent issue, with current methods having varying degrees of inherent subjectivity and bias. Cusum analysis is a technique used in quality control systems, and is starting to be employed in medical training. Endobronchial ultrasound (EBUS) is an established tool in the diagnosis and staging of lung cancer, although its use in the UK is currently restricted. As it becomes more widespread, there will be a need to assess trainees' competence accurately to ensure that those performing EBUS at new centres are appropriately skilled.
Methods A retrospective review of clinical practice in tertiary referral centres in England, Scotland and Spain was carried out. The study group comprised 500 patients undergoing EBUS for the diagnosis and staging of lung cancer as part of a clinical service. Using cusum analysis, the first 100 cases from each of the five centres are presented. Each centre has one consultant physician as the primary EBUS operator, and all operators began using EBUS at their current centre (ie, no learning from prior experience). The data are presented as learning curves.
Results It is evident that there is a wide range of time over which EBUS-guided transbronchial needle aspiration (TBNA) competence is attained. The pooled sensitivity was 67.4% (individual sensitivities 66.7, 70.7, 61.2, 80.3 and 59.7%).
Conclusion Cusum analysis is well suited to the assessment of procedures with a binary outcome, but accurate and appropriate standards of practice must be determined prior to assessment to ensure correct identification of underperformance. This report suggests that the learning curve for EBUS is greater than previously reported using different methods, and that even experienced bronchoscopists vary in their speed of learning.
- Bronchoscopy
- lung cancer
Statistics from Altmetric.com
Introduction
There has been much discussion over the years about how best to assess the competence of doctors to perform a given task or procedure. The National Health Service (NHS) spent >£550 million on negligence claims (including defence costs, damages and claimants legal fees) in the 2007–2008 financial year,1 highlighting the need to ensure appropriate and rigorous training of all healthcare professionals. There has been a move away from the ‘see one, do one, teach one’ philosophy of old where there was an assumption of competence, to more structured assessments of trainees' performances. In many centres, competence is assessed with the use of logbooks, with an arbitrary number of any given procedure being taken as a sign of competence. This clearly does not account for the different rates at which people learn, leaving some trainees frustrated at overly heavy supervision late in their training while risking cutting others adrift too early. A good analogy would be learning to drive. Some people require little time and few lessons, while others spend months taking lessons and failing tests before finally succeeding. The introduction of documentation such as ‘Directly Observed Procedures’ (DOPs) has gone some way to correct this, but there are still inherent problems with such systems. The trainee is in control of which procedures are actually assessed, and by whom, so that there is a strong bias to successful procedures assessed by friendly or lenient colleagues. This gives a false sense of security in the ability of any given trainee at end-of-year formal assessments, but can also (and more concerningly) lead to overconfidence on the part of that trainee who may develop over time a skewed perception of his or her own performance.
Cusum analysis is a method of continuously assessing the performance of an individual or process against a predetermined standard in order to detect adverse trends and to allow for early intervention (eg, re-training). First described by Page in his 1954 paper on continuous inspection schemes,2 it has been widely adapted by the manufacturing and energy industries as an important tool in quality control processes. Recently, several papers have appeared looking at the use of cusum analysis in a variety of clinical scenarios, predominantly in the fields of surgery and anaesthesia (ie, procedure-heavy specialities).3–7
In this report, we have applied cusum analysis to the learning of endobronchial ultrasound-guided transbronchial needle aspiration (EBUS TBNA) of mediastinal lymph nodes in the investigation of suspected lung cancer. EBUS TBNA is becoming an increasingly utilised technique for the diagnosis and staging of lung cancer, with two meta-analyses published recently reporting high sensitivities and specificities. The first, a meta-analysis of 11 studies with a total of 1299 patients reported a pooled sensitivity of 0.93 (95% CI 0.91 to 0.94) and specificity of 1.00 (95% CI 0.99 to 1.00),8 and the second, with 10 studies and 817patients, reported a pooled sensitivity of 0.88 (95% CI 0.79 to 0.94) and pooled specificity of 1.00 (95% CI 0.92 to 1.00).9 It is cheaper than mediastinoscopy, can be performed as a day-case procedure, and morbidity is extremely low. In the UK, operators are largely self-taught, as there are currently too few centres with an established EBUS service to provide training to more than a handful of junior doctors. This has presented a unique opportunity to assess the learning of a new skill without confounders such as supervisor intervention. We report the learning curves of five independent EBUS TBNA operators by retrospectively applying cusum analysis to the first 100 cases of each. The data represent the use of EBUS TBNA in clinical practice, rather than in the more controlled environment of a clinical trial, and the retrospective analysis in this series has prevented case selection and non-routine practices that may be used when the operator is aware that he is being monitored.
Methods
Each of the five centres involved submitted a database of their first 100 EBUS TBNA cases. Each centre had one consultant respiratory physician who was the principle operator in each and every procedure, with help administered where necessary by trainees or bronchoscopy nursing staff (eg, maintaining scope position at the mouth during needle advancement). A procedure was defined as the patient being booked for EBUS TBNA, signing the consent form and keeping their appointment time. Any reason for the procedure subsequently not going ahead or being abandoned early was documented as a procedural failure. All procedures were carried out under conscious sedation. Information was collected on the size and station of lymph nodes targeted, results of preprocedure positron emission tomography (PET) scans where performed, cytology results from TBNA samples, final diagnosis, how that diagnosis was reached if not by EBUS TBNA, and any resulting complications. To avoid inconsistencies in outcome assignment, the results from all five centres were analysed by the same panel of three assessors (SK, SE and PS), and each result was designated as either true or false. Designations are defined below, and any case in which there was incomplete information or doubt about outcome was assigned as a false negative, so as to err on the side of caution.
True positive
TBNA cytology diagnostic of malignancy (or other process).
True negative
TBNA cytology negative and subsequent investigations confirmed a non-cancer diagnosis
or
TBNA cytology negative with inconclusive or no subsequent investigations and patient alive and well at 1 year and original abnormalities ascribed to a non-cancer process.
False negative
TBNA cytology negative but subsequent investigations confirm a diagnosis of cancer
or
TBNA cytology negative with inconclusive or no subsequent investigations and progressive disease clinically ascribed to cancer
or
TBNA cytology negative with inconclusive or no subsequent investigations but patient not alive at 1 year with death ascribed to cancer
or
TBNA cytology negative with inconclusive or no subsequent investigations and patient lost to follow-up
or
Procedural failure.
False positive
TBNA cytology positive for malignancy but histopathology at further biopsy/resection/postmortem showed different malignancy.
Cusum analysis was applied to produce a learning curve for each centre. A good summary of cusum analysis has been published by Bolsin and Colson,10 and the following outline is based on their explanations.
An outcome score X is allocated to each procedure, where Xn is the outcome score of procedure n. The reward for a successful procedure (s) is usually less than the penalty for a failed procedure (1−s), such that >1 success is needed to redress the balance following a failure. To determine the value of s, one must set an acceptable failure rate, p0 (the level of inherent error if the procedure is carried out correctly), and an unacceptable failure rate, p1 (where p1−p0 represents the maximum acceptable level of human error) for the particular procedure being assessed, where:
In the case of EBUS TBNA, we have designated acceptable and unacceptable failure rates as 10% and 20%, respectively. Thus:
A cusum score Cn can then be generated. At the start of the period of analysis, C0=0, and Cn is the sum of all individual outcome scores (X1, X2,…, Xn). An upward projection of the graphed cusum score suggests a success rate below that expected, and a stable or downward projection indicates competence.
The cusum graph is said to signal when Cn crosses a predetermined decision interval, H. H0 denotes the value between each acceptable decision interval, and H1 the value between each unacceptable decision level. These intervals can be marked as horizontal lines on the cusum graph. When a line is crossed, Cn traditionally reverts to 0, but a learning curve can be constructed if repeated decision intervals are stacked graphically. In order to determine H, we need to know the type 1 error (odds of falsely accusing an operator of being incompetent, designated α below) and type 2 error (odds of falsely certifying someone as competent, designated β below). For a training programme, one would ideally like to set a relatively high type 1 error and a low type 2 error to ensure that as few people as possible slip through the net. However, in order to produce an easily interpretable graph, it is best to give both type 1 and 2 errors the same value, as this allows both acceptable and unacceptable performance decision intervals to be equal. We have given a value of 0.1 to both for this analysis.
Thus in our series:
Results
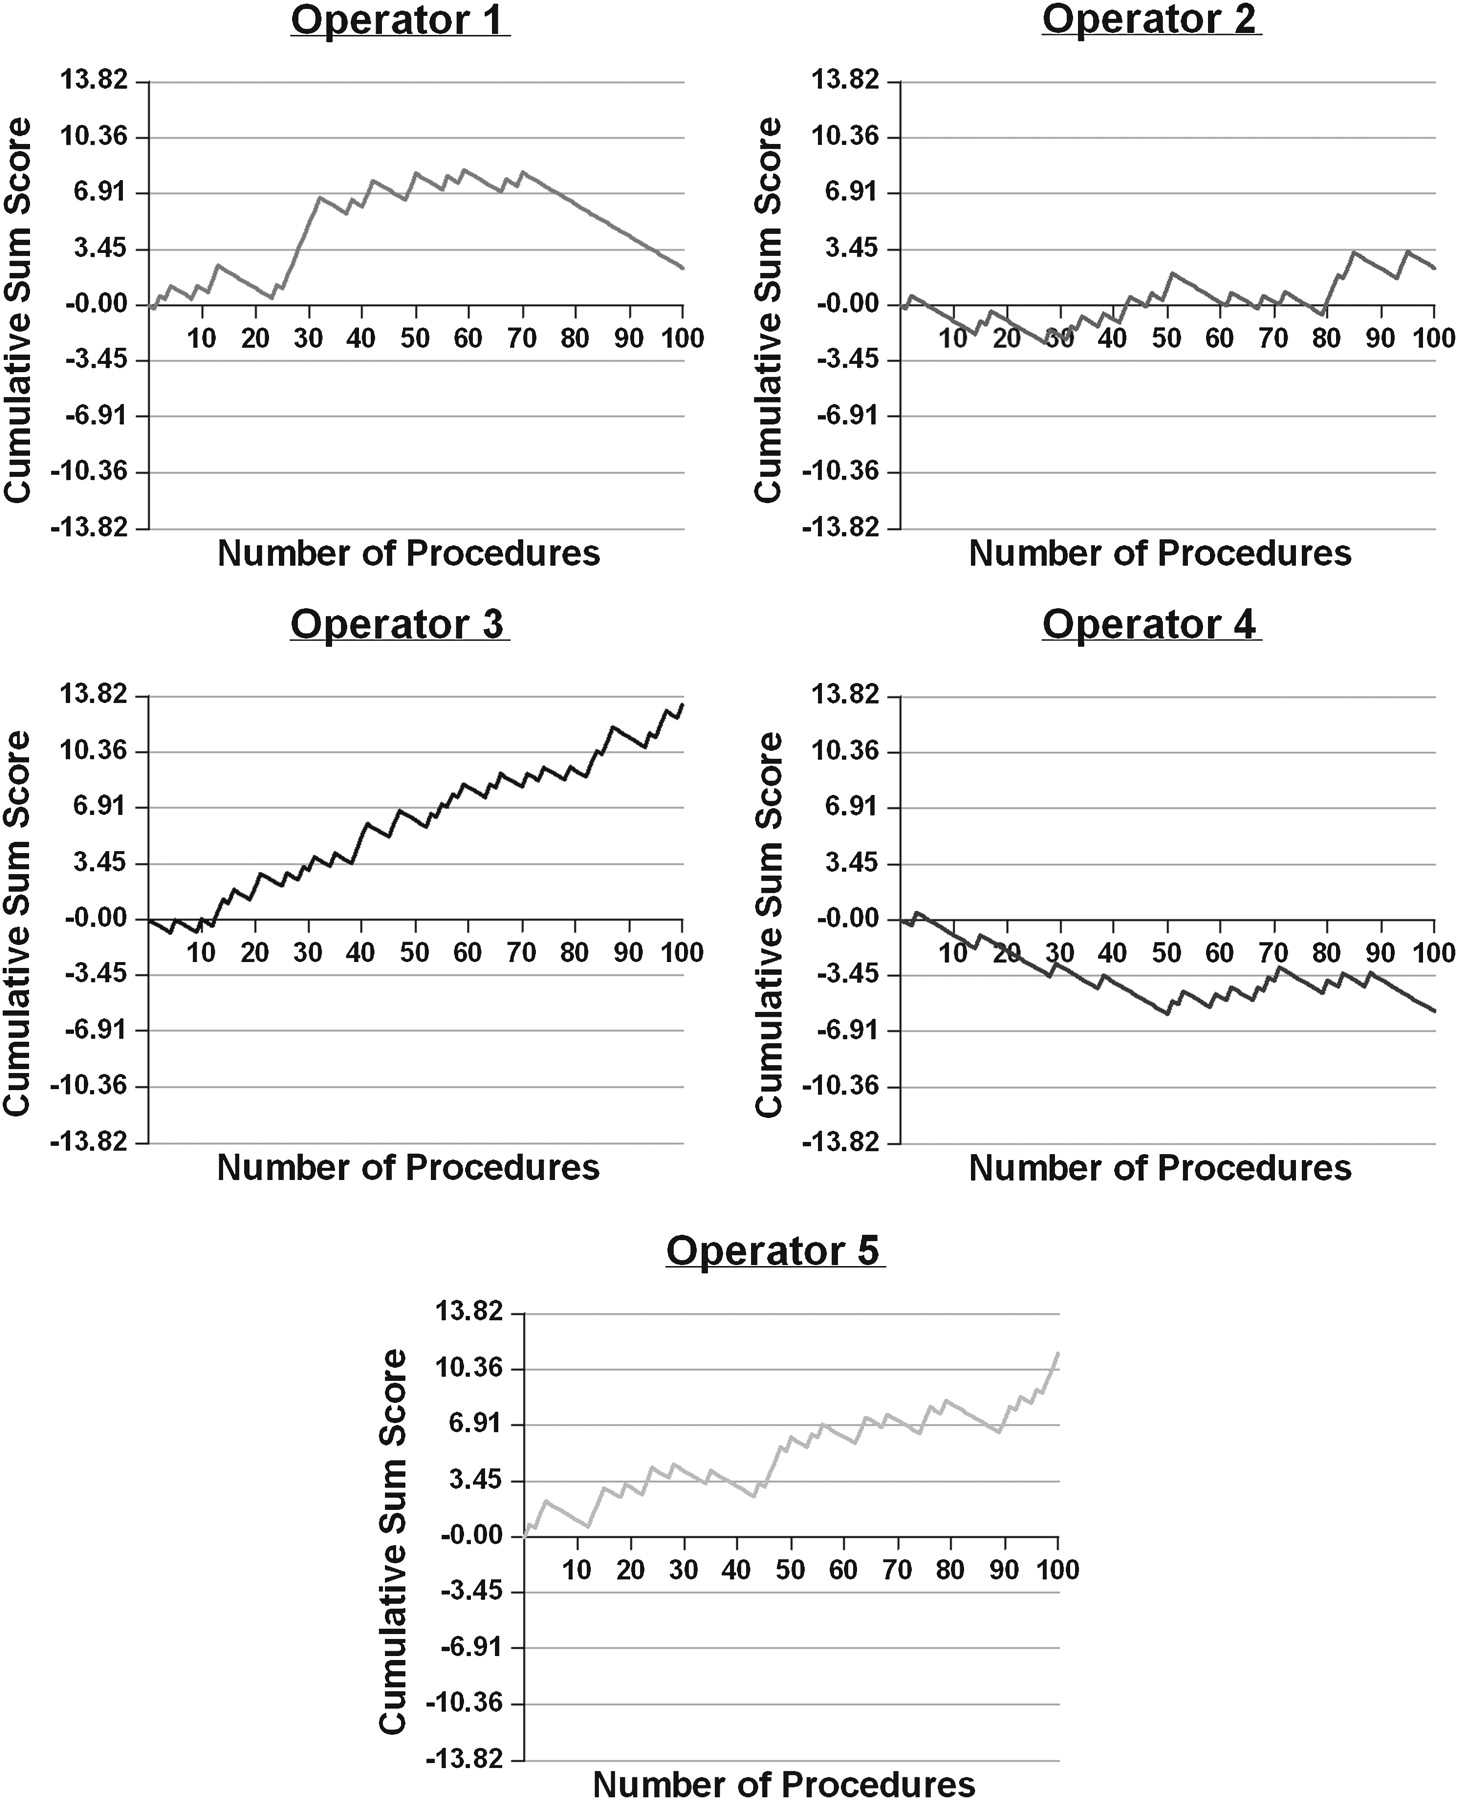
Results are presented graphically as learning curves (figure 1). A positive deflection indicates a false result obtained at any given procedure, and a negative deflection represents a true result.

Cusum curves by operator.
It is evident immediately from the graphical data that there is a range of time over which EBUS TBNA competence is attained. Operator 1 has a very steep learning curve initially, which starts to level off after the 32nd procedure. The last new unacceptable decision interval crossed occurs at the 56th procedure, after which the cusum curve flattens before taking a consistently downward path. Operator 2 seems to perform well initially, but then the cusum curve turns upwards until crossing a decision interval at the 43rd procedure. This is followed by another period of stability, before the curve takes another step upwards at around the 80th procedure. The curve has largely levelled out by the end of the series. The cusum curves of operators 3 and 5 both show a relentless rise over the 100 procedures, indicating that they are still in the learning phase. Operator 4 appears to have attained competence almost immediately, and the cusum curve essentially remains flat for the duration of the analysis period.
The data give a pooled sensitivity of 67.4% (95% CI 51.5% to 84.0%; individual sensitivities 66.7, 70.7, 61.2, 80.3 and 59.7%). Positive cytology at EBUS TBNA is rarely followed by confirmatory surgical biopsies in clinical practice, and therefore it is not possible to assess specificity accurately. However, in the few cases in this series in which additional lymph node tissue was obtained (eg, in those with positive N1 nodes), there were no false-positive results.
Discussion
At present, many assessments are seen by trainees as time consuming and of limited usefulness, and by assessors as simply more paperwork. Finding a useful, appropriate and continuous measure of competence is essential to engage everyone in trainee assessment. This is likely to lead to benefits for both sides—correct and prompt (re-)training for junior staff, and the reassurance for managers and consultants that those juniors are correctly trained. There would thus be an onus on institutions to ensure that adequate training was made available for those learning new procedures, and to provide the necessary tools for continuous assessment. These measures would help in negligence claims, as it would be easy for institutions to demonstrate that staff were competent and that sufficient training was available to allow staff to attain that competence.
The results from the meta-analyses discussed in the Introduction contrast markedly with the data reported here, with a pooled sensitivity of 67.4%. The discrepancy between our data and the meta-analyses probably reflects two things. First, that these cases constituted usual clinical practice, rather than a controlled prospectively monitored cohort as may have been the case in many series, and secondly that the case series used in the meta-analyses were performed by experienced operators rather than by novices. Furthermore, sensitivity is strongly influenced by prevalence, and studies where there is a higher prevalence of cancer are likely to generate a higher sensitivity. The sensitivity was also reduced in the data that we have presented as several cases have been assigned a false-negative outcome on the basis of uncertainty or loss to follow-up.
One possible reason for the differing learning curves could be the proportion of large versus small (<10 mm) nodes sampled. From the available data, the number of patients in which exclusively subcentimetre nodes were sampled by each of operators 1–5 is shown in table 1. Similarly, the length of time taken to perform 100 cases varied greatly, from 12 months and 4 days (operator 4) to 51 months and 24 days (operator 1). The slow initial accrual of cases by operator 1 could certainly have contributed to the continued upward trend of the cusum curve for the first 50 or so procedures. Recruitment time for the first 50 cases was 28 months and 21 days, and for the second 50 cases was 13 months and 3 days. Operator 4 was performing two procedures a week throughout the data collection period, leading to the quickest case accrual and the best overall cusum curve.
Number of nodes <1 cm sampled by operator
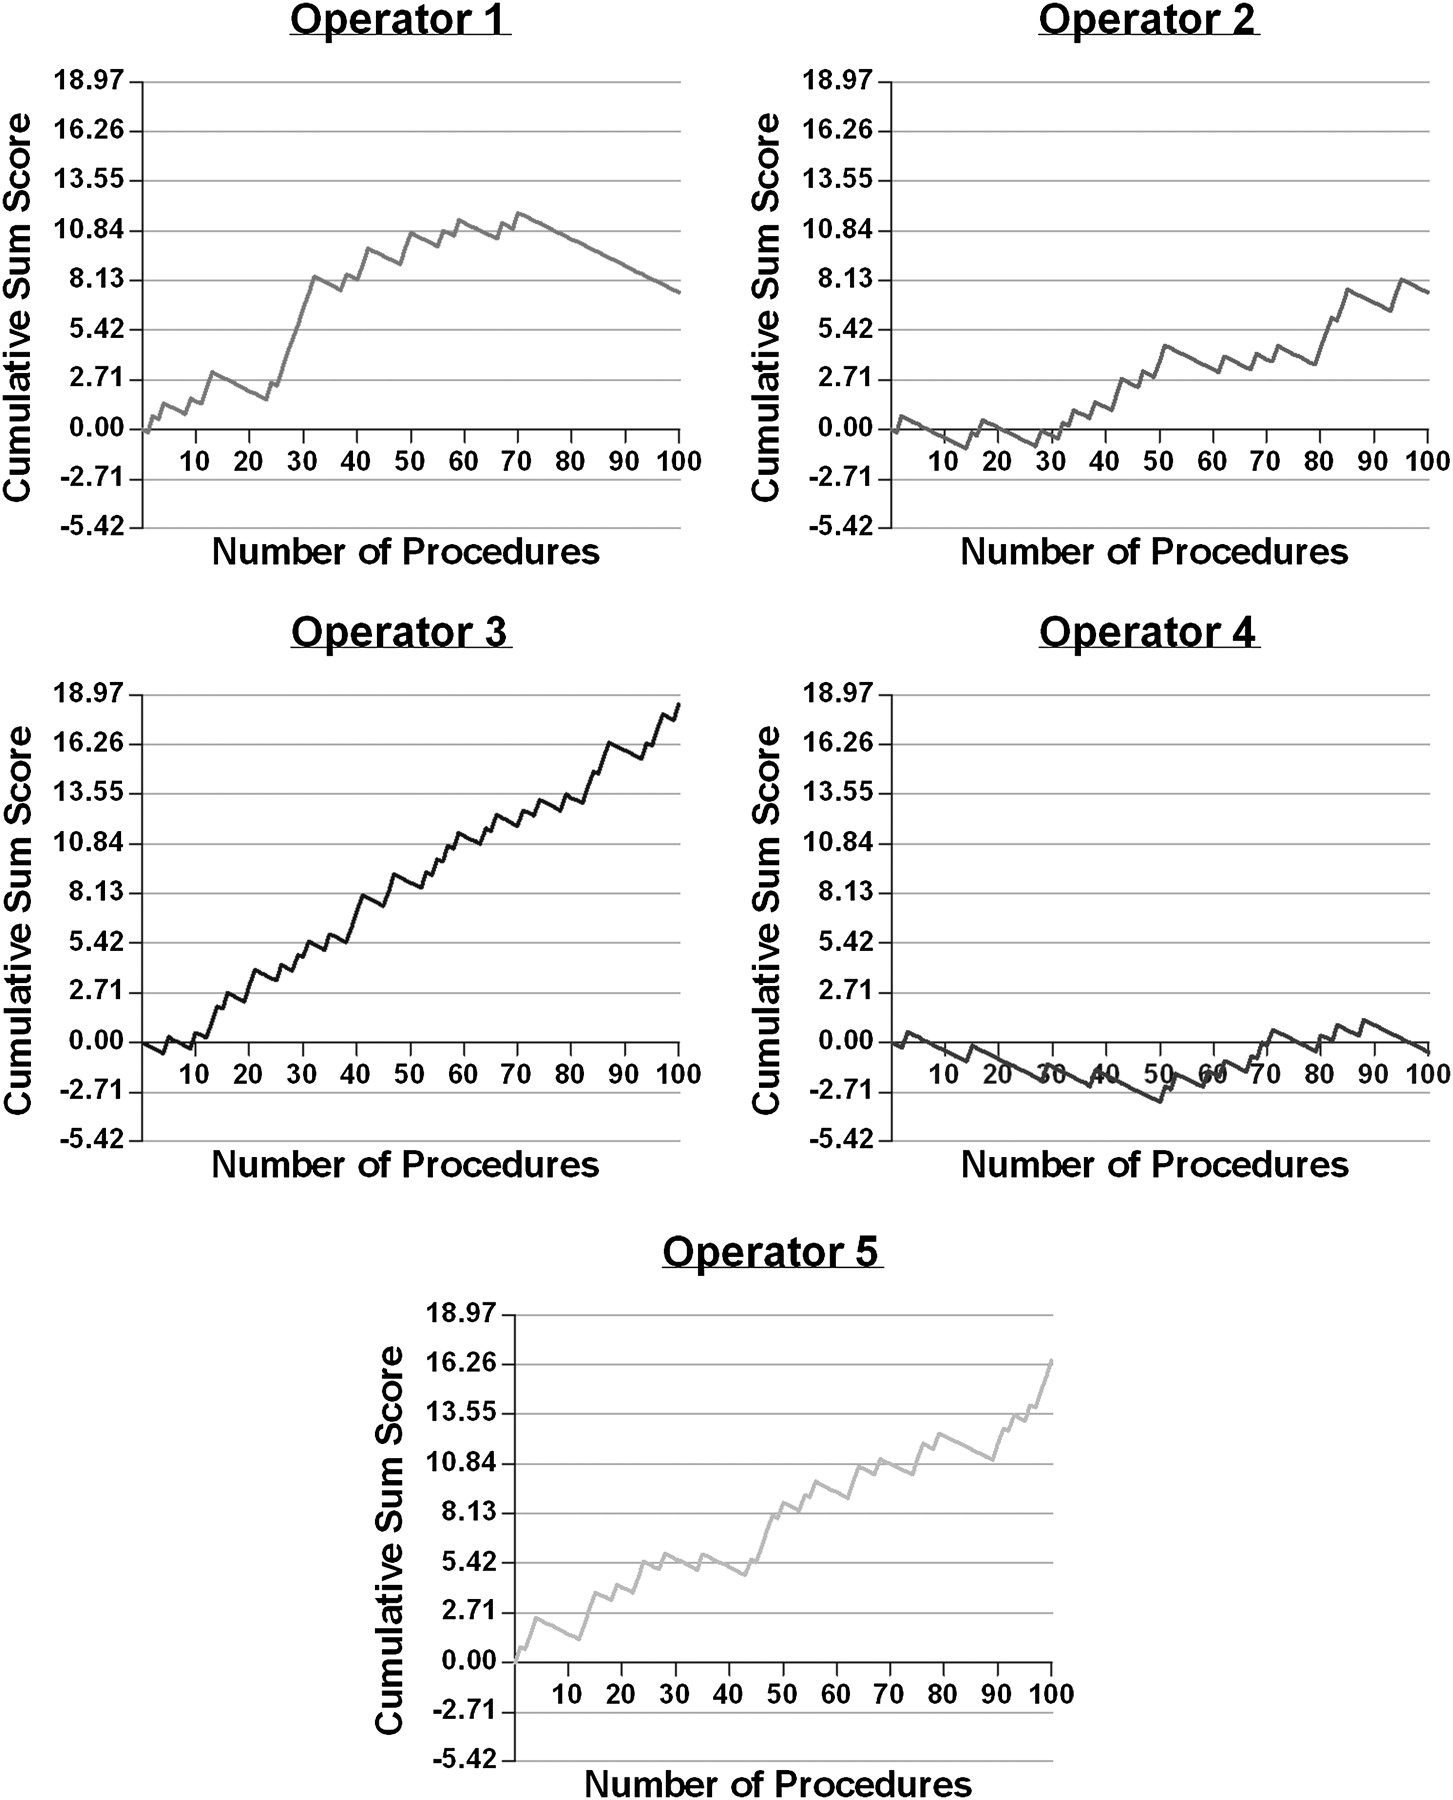
We set acceptable and unacceptable failure rates at 10% and 20%, respectively, based on ‘expert opinion’ prior to any analysis of data. These values fit well with the meta-analyses by Gu et al and Adams et al,8 9 but, with the comments above in mind, these may be considered very tough standards. It may be that these rates could be changed depending upon experience. For example, if we drop the acceptable and unacceptable failure rates to 15% and 25%, respectively, we see that operator 2, like operator 4, now appears to have achieved and sustained competence immediately, and operator 1 achieves competence 15 procedures earlier (41 vs 56 procedures). Results are shown graphically in figure 2.
Cusum curves with less harsh failure criteria.
There are currently no published guidelines in the UK for what constitutes adequate training in bronchoscopy, or how best to assess competence. The data presented here clearly demonstrate different speeds at which people learn new tasks, even when we consider operators highly experienced in similar procedural techniques. With the ever-expanding number and complexity of bronchoscopic procedures (and of medical procedures in general), there is a need to formulate adequate assessment tools for trainee development, and we propose cusum analysis as one such tool. However, accurate and appropriate standards of practice must be determined prior to assessment to ensure correct identification of those who are underperforming.
What is already known on this subject
Trainee assessment techniques are constantly evolving.
There is an increasing emphasis on proving on-going competence.
Cusum analysis is an emerging assessment tool in medicine.
What this study adds
Emphasises variability in learning.
Provides a potential model for evaluating competence in both trainees and consultants.
Provides model for monitoring ongoing practice.
Supplementary materials
Web Only Data thx.2009.127274
Files in this Data Supplement:
Footnotes
Competing interests None.
Provenance and peer review Not commissioned; externally peer reviewed.
Linked Articles
- Correction
- PostScript
- Corrections