Article Text

Abstract
Background: Although airflow limitation improved by inhaled anticholinergic drugs varies among individuals with chronic obstructive pulmonary disease (COPD), the relationship between actual bronchodilation and improved pulmonary function and where in the lung such bronchodilation occurs remains unknown. A study was undertaken to determine the relationship between improved pulmonary function and changes in airway calibre at various sites in the airways in response to inhaled anticholinergic agents in patients with COPD using three-dimensional computed tomography (CT).
Methods: CT scans were performed at deep inspiration and detailed pulmonary function tests before and 1 week after daily inhalations of tiotropium bromide in 15 patients with clinically stable COPD. The airway luminal area was examined at the third (segmental) to the sixth generations of eight bronchi in the right lung.
Results: Bronchodilation was demonstrated by an overall average increase of 39% in the inner luminal area, and the mean (SE) forced expiratory volume in 1 s (FEV1) increased from 1.23 (0.11) l to 1.47 (0.13) l. The magnitude of bronchodilation was closely correlated with improved pulmonary function, particularly with that of FEV1 (r = 0.843, p<0.001). Such correlations were significant at the fourth to the sixth generation but not at the third generation of bronchi, and the slope of the regression lines became steeper from the third to the sixth generation.
Conclusions: Inhaled anticholinergic agents induce overall bronchodilation which is in proportion to improvements in FEV1 in patients with COPD. Bronchodilation at the distal rather than the proximal airways is the determinant of functional improvement.
Statistics from Altmetric.com
Chronic obstructive pulmonary disease (COPD) is characterised by progressive airflow limitation that is not fully reversible. It is caused by a mixture of abnormal inflammatory responses in the small airways and parenchymal destruction of the lungs, the relative contributions of which vary among individuals.1
Bronchodilator medications are central to the symptomatic management of COPD, although the magnitude of bronchodilation varies widely.1–3 Factors that determine intersubject variation in the bronchodilator response include prebronchodilator values of forced expiratory volume in 1 s (FEV1),2–4 smoking status2 5 6 and β2 adrenergic receptor gene polymorphism.6 However, they account for only a small portion of the response. All classes of bronchodilators are thought to function by altering airway smooth muscle tone, and improvements in expiratory flow should reflect widening of the airways rather than changes in lung elastic recoil.1 7 However, the relationship between actual bronchodilation and improved pulmonary function, and where in the lung such bronchodilation occurs, have never been visually demonstrated in patients with COPD. Moreover, bronchodilatory heterogeneity in the lungs has not been proved by any modality.
We designed a programme to measure airway dimensions on computed tomography (CT) using the algorithm of curved multiplanar reconstruction. This allows visualisation and accurate analysis of longitudinal bronchi and short axes of airways perpendicular to the long axis located anywhere in the lung.8 We have used our software to analyse airways with dimensions up to the sixth generation of bronchi with an average inner diameter of 2.3 mm, and found that airflow limitation in patients with COPD is more closely linked to the dimensions of distal than proximal airways.8
In this study we have attempted to measure the magnitude of bronchodilation (airway widening) at various sites throughout the lungs of 15 patients with moderate to severe COPD in response to daily inhalations of tiotropium bromide for 1 week. This compound is an effective bronchodilator with action that persists for over 24 h.9 10 We initially investigated the relationship between the overall magnitude of bronchodilation evaluated by three-dimensional CT scanning and improved pulmonary function parameters in the patients, and then explored the relationship at each generation of bronchi and/or at each lobe. Finally, we classified the subjects as good or poor responders to inhaled anticholinergics and compared the bronchodilatory behaviour between the two groups.
METHODS
Patients with clinically stable COPD (M/F 13/2; mean age 69.4 years, range 53–83) were recruited at Hokkaido University Hospital between September 2006 and March 2008. The diagnosis of COPD was confirmed based on the spirometric criteria of the GOLD guidelines (post-bronchodilator ratio of FEV1 to forced vital capacity (FVC) <0.7).1 All patients were either current or former smokers with a mean (SD) smoking history of 61.8 (31.8) pack-years. The exclusion criteria for selecting participants for this study are described in the online supplement. Bronchial asthma was excluded based on clinical history and laboratory findings, including levels of IgE and/or eosinophils in the blood and/or sputum.
At the first visit the patients were instructed to refrain from using any respiratory medication including tiotropium bromide for the next week. At the second visit for baseline measurement we confirmed that the patients were stable and free of medication that might influence the spirometric data. We then conducted lung CT scans followed by pulmonary function tests. CT images were acquired while the patient held their breath at deep inspiration. Spirometric measurements were obtained using a rolling seal spirometer, the carbon monoxide transfer factor was measured using the single breath method, and lung volumes were measured using a closed-circuit helium dilution method that met all of the Japanese Respiratory Society (JRS) guidelines.11
From the following day, all of the participants inhaled tiotropium bromide once every morning for 1 week, which is sufficient to induce an effect.12 At the third visit, which was exactly 7 days after the second, we confirmed that the participants had last inhaled tiotropium about 2 h previously and repeated lung CT scans and pulmonary function tests as described above.
CT and airway analysis
Two multidetector-row spiral CT scanners were used, one with 4 detector arrays (SOMATOME plus Volume Zoom, Siemens, Berlin, Germany) and the other with 64 detector arrays (Aquilion Multi, TSX-101A/HA; Toshiba Medical Systems, Tokyo, Japan). The same CT model was used to obtain images from specific individuals to avoid bias due to different types of CT scanners. A validation study was performed using phantoms to confirm the acceptability of data using both types of CT scanners (see online supplement), as we had for a Siemens scanner in our previous study.8 We measured only the inner luminal area and not the airway outer wall.
Data acquisition parameters for both CT scanners are shown in the online supplement. We selected three upper bronchi, two middle bronchi and three lower bronchi from the right lung and analysed the inner luminal area at four sites in each bronchus from the third to the sixth generation, giving a total of 32 sites per patient. Airway measurements are detailed in our previous publication and also in the online supplement. We measured lung volumes using three-dimensional CT volumetric analysis to confirm that the CT images were acquired from each patient at similar lung volumes before and after tiotropium bromide inhalation. This was because we were afraid that the difference in the lung volume on the two occasions might significantly bias airway calibre, thus potentially being a confounding factor in the study. Details of these measurements are shown in the online supplement.
Statistical analysis
Data are shown as mean (SEM), including the airway inner luminal area at various sites, because the distribution of normality for most of the results was not rejected by the Shapiro-Wilk test. Paired Student t tests were used to analyse differences in mean values between baseline and post-bronchodilator values, and unpaired Student t tests were used for values between the two groups. Relationships between two quantitative variables were examined using the Spearman test. The Jonckheere-Terpstra test was used to examine trends in the percentage increase in the inner luminal area of the third to sixth generation airways. In addition, the groups were compared using the Kruskal-Wallis test for multiple comparisons followed by the Mann-Whitney test. All statistical tests were two-sided and values of p<0.05 were considered statistically significant. Data were analysed using SPSS for Windows Version 12.0 software (SPSS Japan, Tokyo, Japan).
RESULTS
Airway measurements in patients with COPD before and after inhaled tiotropium
Table 1 shows the results of pulmonary function tests on two occasions. Tiotropium inhalation for 1 week induced statistically significant increases in vital capacity (VC), FVC, inspiratory capacity (IC) and FEV1, as well as decreases in residual volume (RV) and RV/total lung capacity (TLC).
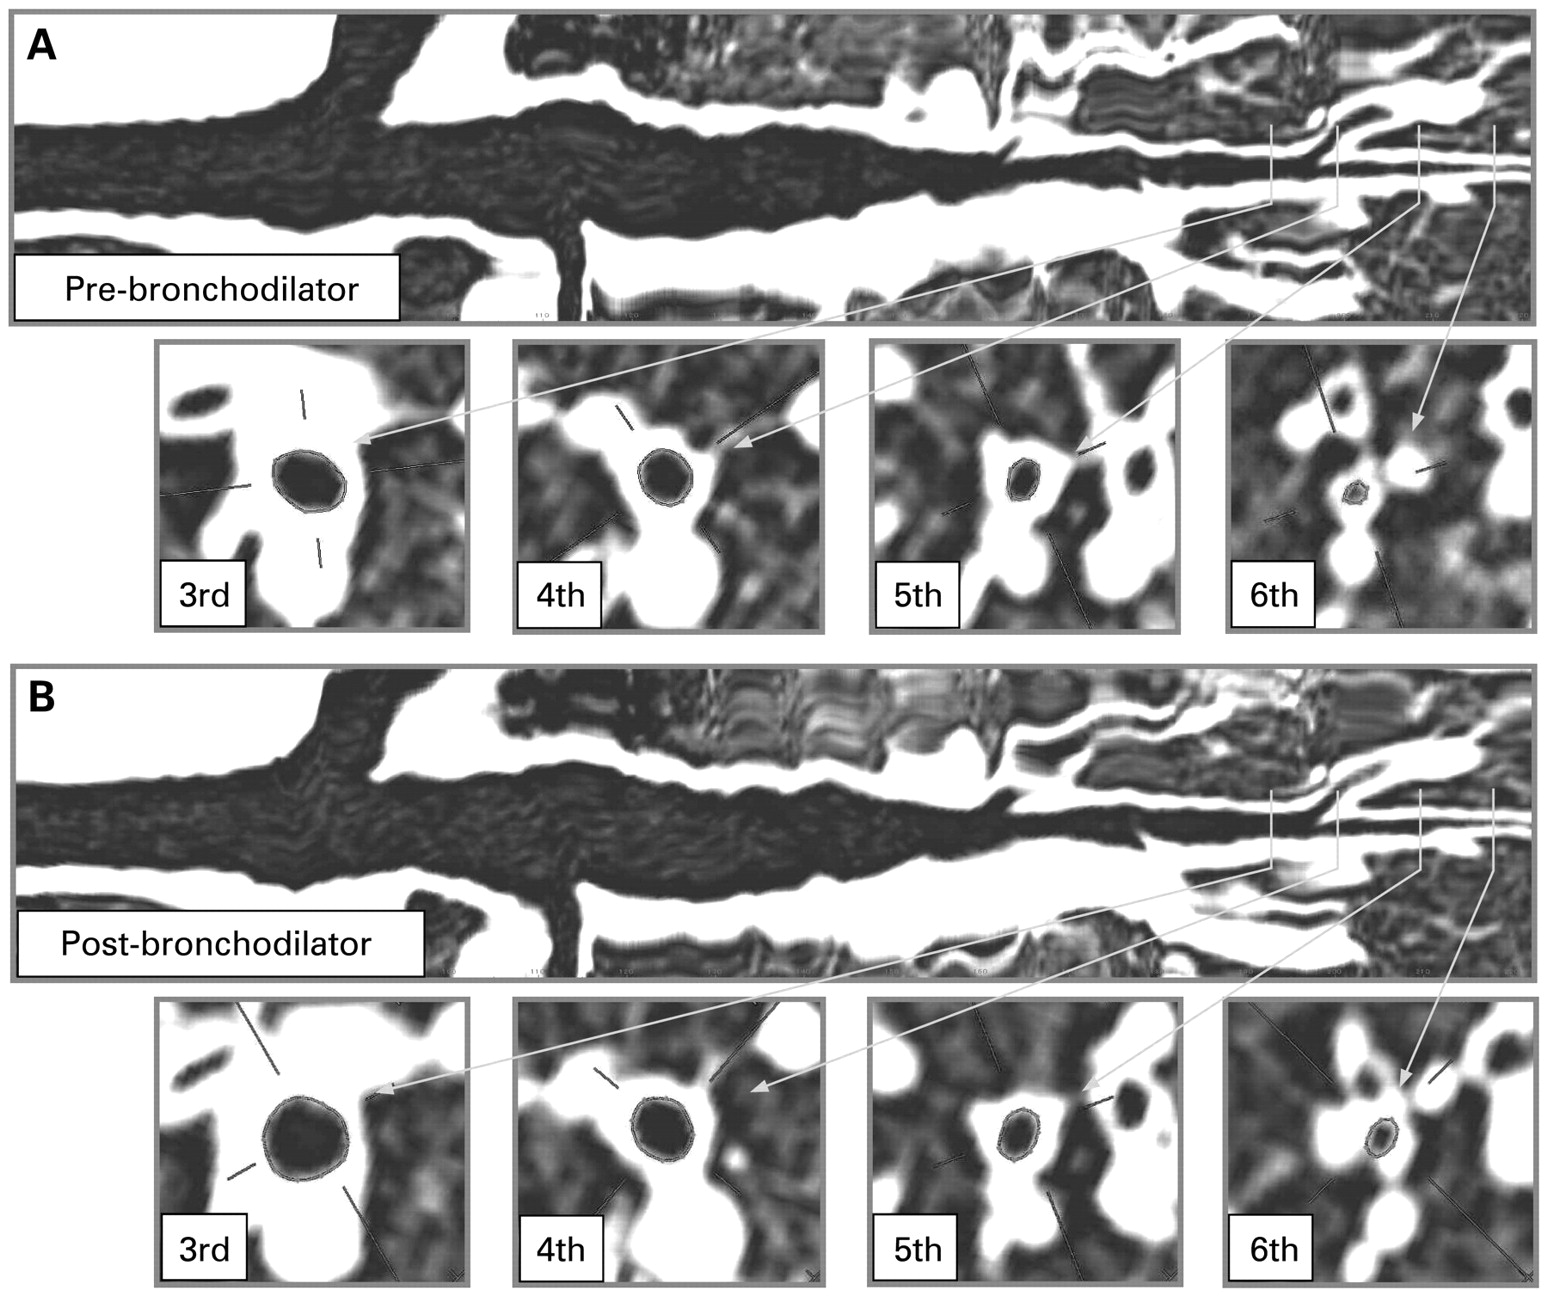
Figure 1 shows two curved multiplanar reconstructed images of the posterior basal bronchus of one individual before and after tiotropium inhalation. We obtained short axis images perpendicular to the long axis from the third to the sixth generation at very similar sites on both occasions. The visual evidence shows that bronchodilation indeed occurred after bronchodilator inhalation in this particular airway. However, we could not obtain clear airway images of the middle lobe from one patient and of the lateral basal bronchus from two others because one had middle lobe syndrome and the others had significant amounts of sputum within that bronchus. Table 2 shows the absolute values of the inner luminal area at 32 measurement sites before and after bronchodilator inhalation, as well as the percentage increase in the inner luminal area with treatment, which was calculated separately for the lobe and for the airway generation on average. Assuming that the airway lumen is a true circle, then the inner diameters (Di) calculated as Di = 2√Ai/π at baseline were 4.5 (0.2) mm, 3.3 (0.1) mm, 2.7 (0.1) mm and 2.1 (0.1) mm at generations 3, 4, 5 and 6, respectively, where Ai is the inner luminal area of the airway.

Long and short axis images of the right posterior basal bronchus of one individual (A) before and (B) 1 week after tiotropium inhalation. Generation 3 of the bronchi are defined as segmental.
The magnitude of bronchodilation varied considerably among individuals at any site, as reflected by the relatively large SEM values. However, bronchodilation was statistically significant at 20/32 sites of the bronchi when we averaged the measurements from 15 patients (table 2). Generally, as the generation number increases—that is, as the size of the airways decreases—the average amount of bronchodilation appears to increase. However, the trend did not reach statistical significance. The average bronchodilator response was very similar among the lobes.
We then averaged all 32 measurements for each individual and compared the percentage increase in bronchodilation and the percentage improvement in pulmonary function tests among the participants (table 3).
Overall bronchodilation significantly correlated with improvements in pulmonary function parameters, including VC, FVC, IC, FEV1, RV and RV/ TLC. Figure 2 shows that the change in FEV1 correlated most closely with overall bronchodilation (r = 0.843, p<0.001). Considering the potential bias resulting from the use of two CT scanners, each participant is indicated using different styles of dots depending on which CT scanner was used (fig 2). Even when we separately studied nine individuals who had also been examined using the Siemens scanner, the close correlation between the overall bronchodilator response and the percentage increase in FEV1 persisted (r = 0.800, p = 0.010).

Relationship between percentage increase in inner luminal area and in forced expiratory volume in 1 s (FEV1) from baseline after 1 week of tiotropium bromide inhalation in patients with COPD (n = 15). Each dot represents one patient; squares represent patients scanned using a Siemens instrument; circles represent patients scanned using a Toshiba instrument. Bronchodilation is expressed as the mean percentage increase in inner luminal area of four sites of eight bronchi (total 32 sites). Imaging and physiological data were significantly correlated.
Because average bronchodilation was more obvious (although not statistically significant) at the distal than at the proximal bronchi, we examined the relationship between improved FEV1 and the average percentage increase in inner luminal area at the same generation of all eight bronchi. Figure 3 shows that the data from the fourth, fifth and sixth generations were significantly correlated, but not those from the third generation. Importantly and interestingly, the slope of the regression lines between the two variables became steeper as the airways became more distal from the third to the sixth generation. Separately analysed data based on lobes are also shown in fig E1 in the online supplement.

Relationship between percentage increase in inner luminal area (Ai) and in forced expiratory volume in 1 s (FEV1) from baseline according to airway generation after 1 week of tiotropium inhalation in patients with COPD (n = 15). Data shown for (A) third, (B) fourth, (C) fifth and (D) sixth generations.
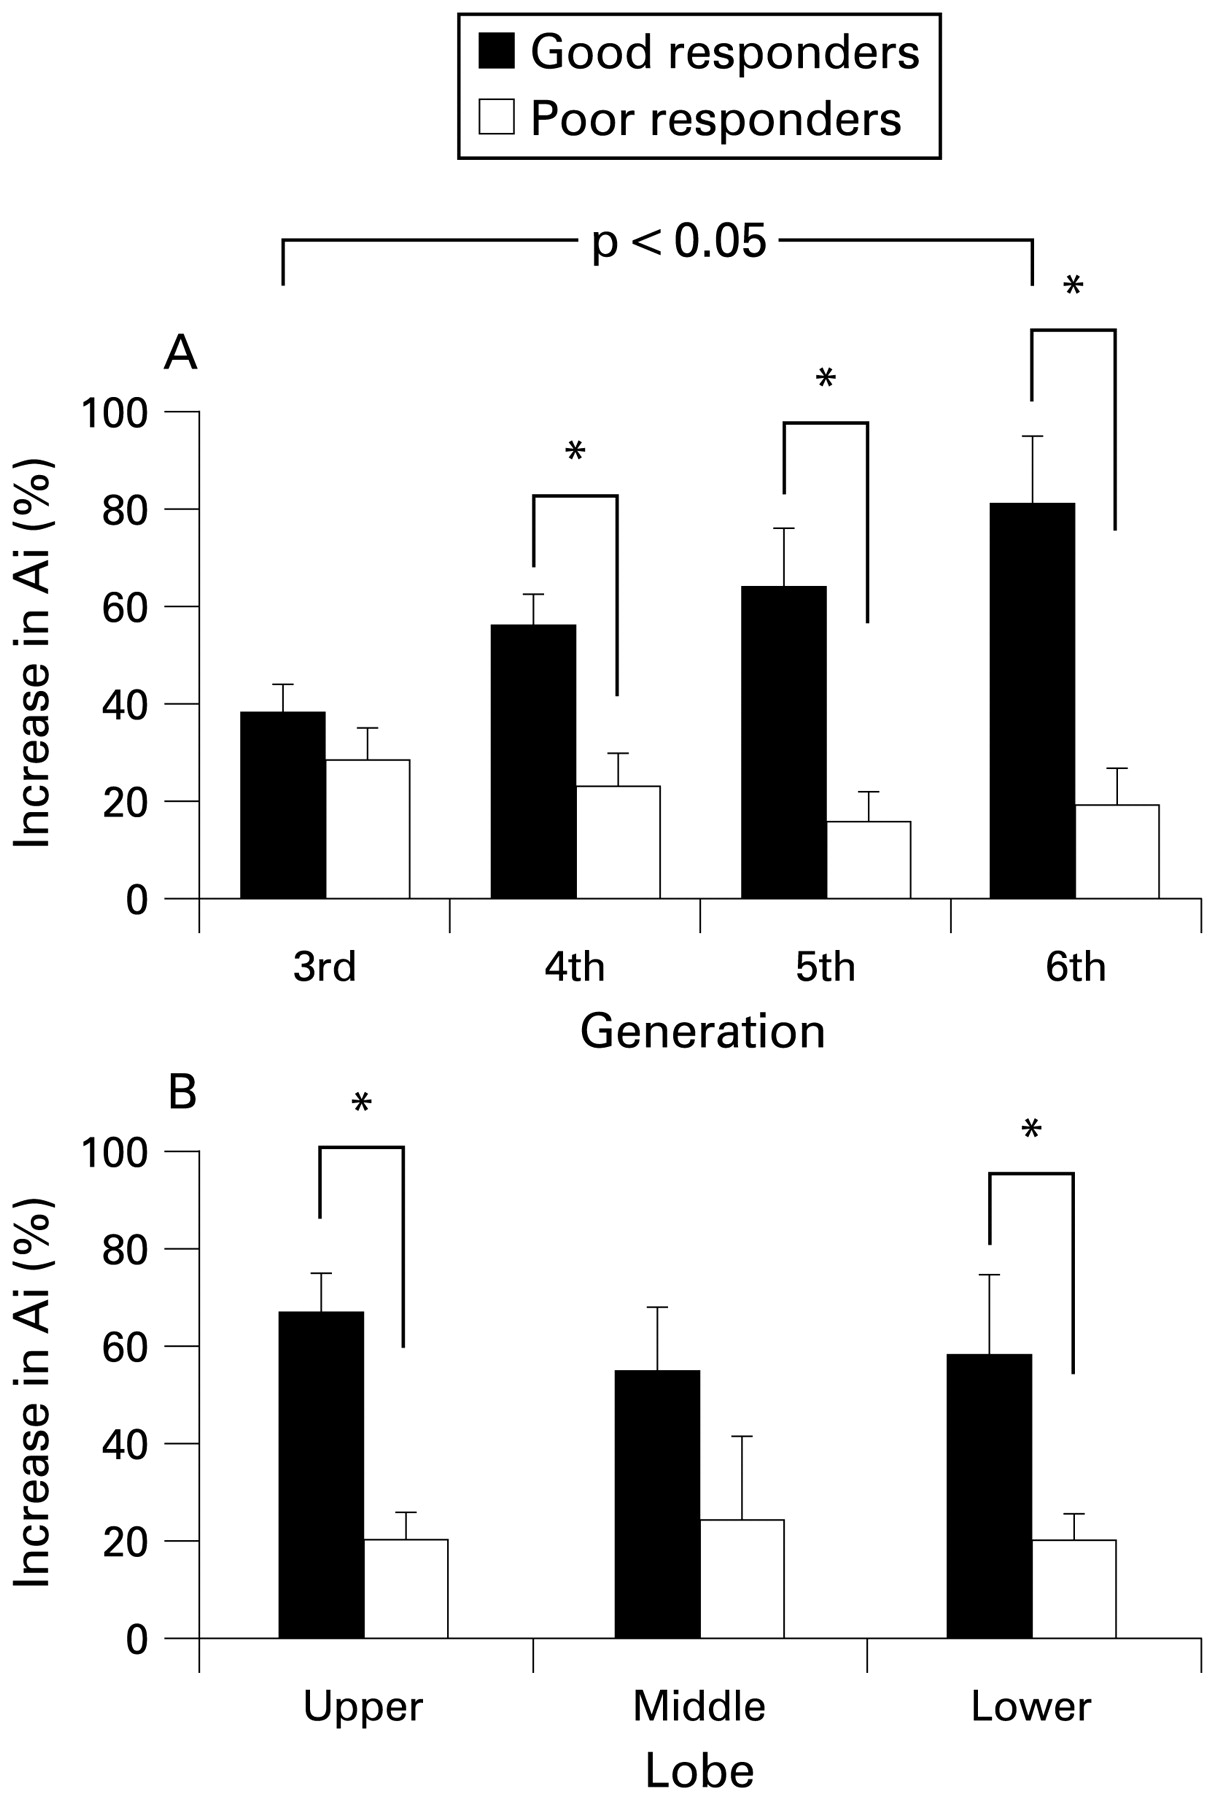
We then defined good responders as those who exhibited an increase in FEV1 of >20%, considering that the mean percentage increase in FEV1 was 19.7% in this study. Figure 4A shows a significant trend; the magnitude of bronchodilation increased as the airways became smaller from the third to the sixth generation (p = 0.006) in the good responders (n = 7) but not at all in the poor responders (n = 8), and the difference in bronchodilation between the two groups was statistically significant only at generations 4, 5, and 6. There were no significant differences between lobes in either good or poor responders (fig 4B).

Percentage increase in inner luminal area (Ai) before and after tiotropium inhalation according to (A) airway generation or (B) lobe. Good responders are defined as those in whom the percentage increase in forced expiratory volume in 1 s (FEV1) was >20%. This trend is significant insofar as the magnitude of bronchodilation increased as the airways became smaller from the third to the sixth generation (p = 0.006) in good responders (n = 7) but not at all in poor responders (n = 8). The difference in bronchodilation between the two groups was statistically significant only at generations 4, 5 and 6. Moreover, bronchodilation was significantly more extensive at the sixth generation than at the third generation only in good responders (A, p = 0.011). No differences were evident between lobes in either good or poor responders (B). *p<0.05.
Lung volumes before and after inhalation of tiotropium for 1 week were 5.44 (0.35) l and 5.19 (0.38) l, respectively. Although lung volumes significantly differed on two occasions (p = 0.029), changes in lung volume did not significantly correlate with those of airway calibre among the subjects.
DISCUSSION
Using three-dimensional CT scanning, we have shown that the calibre at the third to sixth generation of the airways induced by inhaled anticholinergic agents increased in proportion to physiological improvements in pulmonary function. Of the pulmonary function parameters measured, FEV1 correlated most closely with the magnitude of bronchodilation overall. The close correlation between the magnitude of bronchodilation at deep inspiration under static conditions and that of functional improvement on forced expiration might be surprising. However, considering that FEV1 is the volume that is expired during the first second from fully inspired lungs, widening of airway calibre at the beginning of expiration might be a determinant of the initially expired volume. In this study we unfortunately did not obtain lung volume data by body plethysmography. Such data would be interesting for comparison with bronchodilation elicited by inhaled anticholinergic agents.
Particularly noteworthy is the finding that the slope of the regression lines between the improvement in FEV1 and the magnitude of bronchodilation was steeper from the third to the sixth generation. Theoretically, if the same degree of vagal cholinergic tone operates in various sizes of airways, then widening of airway calibre by anticholinergic agents should be greater in the smaller airways,13 particularly when the magnitude of bronchodilation is evaluated as the percentage increase in inner luminal area. We then considered these relationships using the absolute increase in inner luminal area instead of the percentage increase. The total luminal area per generation increases as the airway bifurcates,14 so the absolute increase in inner luminal area per generation should be larger at more distal airways. Indeed, if we could correct the total increase in inner luminal area per generation by multiplying by 2, 4 and 8, respectively, for the fourth, fifth and sixth generations in comparison with the third generation, considering increased number of airways, we would similarly find that the slope of the regression line between the two variables is steeper at the more distal airways (see fig E2 in the online supplement). These findings indicate that bronchodilation at the distal rather than the proximal airway is the determinant of the functional improvement exerted by inhaled anticholinergics in COPD.
The magnitude of bronchodilation in some good responders might be surprising, considering that they all had COPD. However, several recent studies have found that a significant proportion of patients with COPD display more reversibility of airflow limitation than has generally been thought.3 4 15 The findings of our study might have some important clinical implications and provide intriguing insights into treatment with bronchodilators for patients with COPD. First, a poor response to inhaled anticholinergics might well be explained by limited responses at the fifth to sixth generations rather than at the third generation of the airways because the magnitude of bronchodilation between good and poor responders did not differ significantly, at least at the third generation of the airways (fig 4A). If so, more attention should be directed towards delivering drugs to the fifth and sixth generations of airways in patients who do not respond well to inhaled anticholinergics. Second, when considering how to maximise bronchodilation in patients with COPD in the long term as well as the short term, attention should be focused on the more distal airways rather than the third (segmental) generation of the airway.
Brown et al pioneered the use of CT scanning to demonstrate changes in the airway calibre of animal lungs.16 They attempted to measure airways considered to be located at the same site in the lungs before and after bronchoconstriction induced by methacholine. They later reported that airway narrowing in human lungs was heterogeneous with no predilection for any particular airway size, and that changes in the mean airway luminal area measured by CT scanning and the mean partial spirometric outcomes closely correlated in a small number of healthy individuals and patients with asthma.17 18 On the other hand, two other studies found significant differences in airway narrowing after methacholine challenge according to the baseline airway size in both subjects with asthma and healthy individuals.19 20 However, all of the studies17–20 had inherent technical limitations because they analysed two-dimensional images of the airways and thus could not identify which airway generation they were actually measuring. Moreover, the relationship between improved pulmonary function and bronchodilation at various sites of the airways and the degree to which such bronchodilation occurs in the lung have never been demonstrated in patients with COPD.
Using the three-dimensional airway analysis applied in this study, we have recently shown that the percentage predicted FEV1 significantly correlates with the dimensions of airways of various sizes in a large number of patients with COPD.8 In addition, the correlation coefficients between the two variables improved as the airway size decreased from the third to the sixth generation. These results support the concept that distal (smaller) rather than proximal (larger) airways are more important determinants of airflow limitation in COPD, as previous pathology/function correlation studies have indicated.21–24 As the average calculated inner diameter of the sixth generation of the bronchi was 2.1 mm at baseline before bronchodilator inhalation in this study, these airways are not defined as “small airways”.25 However, the findings from our two studies jointly suggest that airways located near “small airways” are functionally important in COPD.
Several classic studies have attempted to determine physiologically the site of bronchodilation in response to bronchodilators in humans. These efforts have included measuring anatomical dead space as an indicator of central airway changes,26 generating maximal expiratory flow-volume curves with inspired gases of different densities27 28 and sensing the lateral pressure of the airway using a catheter-tipped micromanometer.29 Although these studies were theoretically sound, they could not determine bronchodilatory heterogeneity of the lung because they are all based on the assumption that lung activity is homogeneous and so overall physiological parameters were measured. Most of these studies agreed that inhaled anticholinergic agents act mainly on the large central airways in normal individuals as well as in patients with bronchial asthma,26 28 30 although some disagreed.27 31 Since resting vagal tone is thought to be maintained under normal circumstances throughout the bronchial tree,30 the exact site of bronchodilation over the whole lung remains to be elucidated. Our CT imaging method can analyse only large airways from the standpoint of respiratory physiology because small airways are defined as having an inner diameter of <2 mm. However, the advantage of our method is the potential for examining the heterogeneous behaviour of bronchodilation in individual lungs.
This study has some limitations. First, the use of two different types of CT scanners for this kind of study could be debatable, particularly for lung densitometry.32–34 However, we carefully considered possible bias associated with the use of the two scanners in this study and obtained data from specific individuals using the same instrument. We also conducted preliminary validation studies for both scanners using the same phantoms and used the percentage increase in inner luminal area as a marker of bronchodilation after inhalation rather than actual values. Second, some potential drawbacks are inherent in our experimental protocol and also in our software. Although we obtained CT images on two occasions while the patients held their breath at deep inspiration, the CT images might not have been obtained at precisely the same lung volume each session, leading to some potential errors for comparison before and after bronchodilator inhalation. Indeed, the lung volumes that we measured on the two occasions significantly differed for unknown reasons. However, this would not significantly affect our conclusions because lung volume was rather smaller at the second measurement and changes in volume and airway calibre were not associated among the subjects. Finally, to select exactly the same measurement sites of the airways using data obtained on different occasions would be impossible owing to the technical limitations, although we attempted as far as possible to select the same sites before and after treatment. Despite such drawbacks, we demonstrated a close correlation between the overall magnitude of bronchodilation and improved airflow limitation index among the patients. This is probably because we measured 32 sites in a single lung and averaged all of the measurements, thus minimising the errors associated with the technical limitations noted above. For the same reasons, heterogeneous bronchodilation must be considered with caution when three-dimensional airways are analysed by CT scanning. However, by averaging data from a sufficient number of measurement sites (eg, analysis per generation and/or per lobe), we feel that we could overcome this issue.
In conclusion, using three-dimensional CT scanning we have shown that overall bronchodilation occurs in airways from the third to the sixth generation in response to inhaled anticholinergic agents in proportion to the improvement in FEV1 in patients with COPD. More importantly, improvements in airflow limitation are significantly correlated with bronchodilation at the fourth to the sixth generation but not at the third generation of bronchi. In addition, the slope of regression lines became steeper from the third to the sixth generation.
Thus, bronchodilation at the distal rather than the proximal airways is the determinant of functional improvement in airflow limitation in response to inhaled anticholinergics in COPD.
Acknowledgments
The authors thank Ms Hideka Ashikaga for data management and the staff at the Division of Pulmonary Function and Department of Radiology, Hokkaido University Hospital for technical assistance with this study.
REFERENCES
Supplementary materials
web only appendices 64/4/332
Files in this Data Supplement:
Footnotes
▸ Additional Methods information is published online only at http://thorax.bmj.com/content/vol64/issue4
Funding: This study was supported by a Grant-in-Aid for Scientific Research from the Ministry of Education, Culture, Sports, Science and Technology of Japan (19390221 to MN), a Grant to the Respiratory Failure Research Group from the Ministry of Health, Labour and Welfare, Japan, and research grants from Nippon Boehringer Ingelheim and Pfizer Japan.
Competing interests: None.
Ethics approval: All of the patients provided written informed consent to participate and the ethics committee for human research at Hokkaido University School of Medicine approved the study.