Article Text

Abstract
Background: The diagnosis of occupational asthma requires objective confirmation. Analysis of serial measurements of peak expiratory flow (PEF) is usually the most convenient first step in the diagnostic process. A new method of analysis originally developed to detect late asthmatic reactions following specific inhalation testing is described. This was applied to serial PEF measurements made over many days in the workplace to supplement existing methods of PEF analysis.
Methods: 236 records from workers with independently diagnosed occupational asthma and 320 records from controls with asthma were available. The pooled standard deviation for rest day measurements was obtained from an analysis of variance by time. Work day PEF measurements were meaned into matching 2-hourly time segments. Time points with mean work day PEF statistically lower (at the Bonferroni adjusted 5% level) than the rest days were counted after adjusting for the number of contributing measurements.
Results: A minimum of four time point comparisons were needed. Records with ⩾2 time points significantly lower on work days had a sensitivity of 67% and a specificity of 99% for the diagnosis of occupational asthma against independent diagnoses. Reducing the requirements to ⩾1 non-waking time point difference increased sensitivity to 77% and reduced specificity to 93%. The analysis was only applicable to 43% of available records, mainly due to differences in waking times on work and rest days.
Conclusion: Time point analysis complements other validated methods of PEF analysis for the diagnosis of occupational asthma. It requires shorter records than are required for the Oasys score and can identify smaller changes than other methods, but is dependent on low rest day PEF variance.
Statistics from Altmetric.com
The diagnosis of occupational asthma has serious consequences for the affected worker and the workplace. The diagnosis cannot be safely made from the history alone, which has around 45% false positives.1 2 All guidelines recommend objective confirmation of the diagnosis, with serial measurements of peak expiratory flow (PEF) analysed by a validated method being the most appropriate first step.3 Once occupational asthma has developed, as in non-occupational asthma, many factors can influence the PEF including sleep, treatment, exercise, respiratory infections, non-specific irritants and allergen exposures. The difficult part is to separate changes due to work—which are often delayed and cumulative—from those due to other confounding factors. The Oasys computer-based analysis of serial PEF measurements now has three analytical measurements—a discriminant analysis based on plots of daily maximum, mean and minimum PEF (the Oasys score)4 with a sensitivity of 82% and specificity of 94% for high quality 4-week recordings (but only 70% and 82%, respectively, for 2-week records).5 The difference between the mean PEF on work days and rest days has an upper limit of normal of 16 l/min,6 and an analysis comparing the mean hourly PEF on work days and rest days, the Area Between Curves (ABC) score (so far only validated for day shifts) has a sensitivity of 69% and specificity of 100% for time from waking.7 If occupational asthma exists, exposure to the cause at usual levels in the workplace must result in worsening asthma and a fall in PEF. There is a need to increase the sensitivity of analysis of serial PEF measurements, which must include the workplace signal for those with current occupational asthma, while reducing the length of records needed.
Specific inhalation testing is generally regarded as the gold standard for the diagnosis of occupational asthma. A positive test is usually defined as one or two measurements following exposure which are 15–20% below those following an appropriate control exposure. Stenton et al8 suggested that late asthmatic reactions following a challenge were not an all-or-none phenomenon and could be identified by statistical methods. They did an elegant series of experiments on three workers with occupational asthma to sodium isononanoyl oxybenzene sulphonate (SINOS), three asthmatic and three non-asthmatic controls. Dose-response studies were done with a total of 220 separate SINOS exposure days and 30 control days. They assumed that the variability in forced expiratory volume in 1 s (FEV1) measurements was similar on three control days and that the standard deviations of 11 hourly measurements could be combined to produce a pooled standard deviation. Each hourly FEV1 measurement following exposure was compared with the mean hourly measurement made on the three control days with a Student t test using this pooled standard deviation and adjustments for multiple comparisons. They found that late reactions with falls in FEV1 between 5% and 8% were statistically significant in the three workers with SINOS sensitisation. Using a p value of <0.05 for a single hour FEV1 measurement, the false positive rate in the controls was 7%. If two consecutive hourly measurements were required to be below the lower boundary from the pooled control days, false positives were reduced to 1%.
We have tried to reproduce this method using measurements of PEF in the workplace from records collected initially for discriminant analysis using the Oasys software. Our measurements were from real-life exposures. PEF measurements were unsupervised and only requested 2-hourly, but generally included many more exposure and control days than the method of Stenton et al. Our aim was to see whether relatively short-term falls in PEF could be identified which might supplement the other methods of PEF analysis used by Oasys that are weighted in favour of falls in mean daily PEF. We also specifically aimed to determine the sensitivity and specificity of the Stenton method when applied to serial workplace PEF measurements.
Methods
Study population
Records were selected from workers presenting to a specialist clinic with symptoms suggestive of occupational asthma who were asked to measure PEF 2-hourly from waking to sleeping for 4 weeks using a variety of PEF meters (with post-recording linearisation if measured on a non-linear meter). Most records were made on Clement Clarke Mini-Wright meters (where the worker transcribed the PEF results onto record cards), some on Ferraris Piko-1 logging meters, and a small number on other meters. A total of 636 serial PEF records were available from workers investigated between 1980 and 2007 who had an independent diagnosis of occupational asthma or from asthmatic controls. These included (1) 316 serial PEF records from workers diagnosed as having occupational asthma based on independent clinical investigations of either specific inhalation challenge test, fourfold change in methacholine reactivity related to work exposure or positive specific IgE plus a strong relevant history (occupational asthma positives); and (2) 320 records from patients diagnosed as having asthma/occupational asthma but who were not working during their serial PEF measurement period (to ensure that these records could not demonstrate work-related changes in PEF) (occupational asthma negatives). PEF measurements in occupational asthma negative records made between 09.00 h and 17.00 h Monday to Friday were analysed as “at work” and compared with readings on Saturday and Sunday that were analysed as “off work”. Atopic subjects were defined as those having a positive skin prick test of ⩾3 mm compared with a saline control to a common non-occupational environmental allergen.
Calculation of mean daily PEF
The mean PEF for each 2-hourly period from waking to sleeping was plotted separately for days away from work and days on day shifts when there were at least 3 days of measurements for each data point. The mode waking time was calculated from all available days with PEF readings. Workers with a difference in mode waking time between work and rest days of >2 h were excluded. Records with few daily readings were not excluded. Other exclusion criteria were records with evidence of upper respiratory tract infection and those with a treatment change or whose mean daily PEF increased or decreased by >5 l/min/day over the whole record.
Calculation of lower boundary for PEF on days away from work
The pooled standard deviation for all rest day measurements was obtained from an analysis of variance by time. All work day PEF measurements, starting with the first reading at work and continuing to the last reading before work on the next day, were meaned into 2-hourly time segments and tested by calculating a series of test statistics which identified whether the mean work day PEF at any particular time was statistically lower (at the 5% level) than the mean PEF for rest days at the same time point after adjusting for the number of measurements included in each mean value and the number of comparisons made. The test statistic for each 2-hour time point (Tj) = (Pj−Qj)/s√(1/m+1/n) where Tj is the test statistic for the 2-hourly time point j, Pj is the work day mean PEF at time j, Qj is the mean rest day PEF at time j, n is the number of rest days that contribute to a compared mean 2-hourly time point, m is the number of work days that contribute to a compared mean 2-hourly time point and s is the pooled standard deviation. Each Tj was compared with the 0.951/k point of a Student t distribution with k(n–1) degrees of freedom, k being the number of comparisons (Bonferroni correction). The graphical equivalent is illustrated in fig 1 which shows the mean values for rest day PEF measurements and the lower boundary given by Pj−s√(1/m+1/n)tk(n−1)(0.95)1/k. The software within the Oasys program was used to perform the analysis. SPSS Version 15.0 was used for the demographic statistics.

The lower boundary represents the level at each 2-hourly time point that must be crossed for a decrement in day shift peak expiratory flow (PEF) to be significant at the 5% level (grey line with square markers). It runs parallel to the mean rest day plot (black line with square markers). The dotted part of the lower boundary, where there are not enough rest readings for a comparison, is not used. The same applies to work days where there are not enough day shift readings. The black line with cross markers shows the mean PEF on work days that are below the grey line at 08.30–10.30 h and 12.30–14.30 h. The number of readings contributing to each work and rest day mean is recorded below the time. The lowest row of numbers shows the area between the mean rest and work day plots which are summed to produce the area between the curves (ABC) score, here 6 l/min/h (a value ⩾15 is needed for an ABC score to identify occupational asthma). The times at work have a shaded background. This patient worked with printing inks and laminates containing isocyanates. A second PEF record the next year showed larger work-related changes with a positive Oasys score of 3.0 and a positive ABC score of 19 l/min/h. Following removal from exposure, all scores were negative when measurements made between 09.00 h and 17.00 h Monday to Friday were analysed as “at work”.
The number of work day 2-hourly time points showing significant reductions compared with rest day measurements and the total number of time points available for comparison were recorded.
The records were also analysed using previous methods of analysis. The Oasys score is a discriminant analysis based on plots of daily maximum, mean and minimum PEF; a positive score is >2.5.4 The ABC score uses similar plots of the mean hourly PEF to the time point analysis but interpolates missing times within the waking day and calculates the area between the work and rest curves from waking; a positive record has a score ⩾15 l/min/h.7 The difference between the mean PEF on work days and rest days has an upper limit of normal of 16 l/min.6 All methods use the day interpreter, which starts each “day” with the first reading at work and continues to the last before work on the next day.9
Results
A total of 316 records were identified from workers with an independent diagnosis of occupational asthma. After limiting the data to the first two records per worker, 236 remained. Ten were then removed for respiratory infections and eight for excessive deterioration or improvement during the record; 34 records had <3 day shifts or <3 rest days and a further 83 had mode waking times >2 h different on rest days from work days leaving 101 records for evaluation (43% of possible records). Workers woke up 65 min later on days off than on day shift days. This was reduced to 37 min after excluding patients with a mode difference of >2 h.
The demographic characteristics of the workers and their PEF records are shown in table 1. The principal differences were in the occupational elements of the PEF records. The control patients with asthma were older (as many had previously been diagnosed with occupational asthma and were now unemployed), they had similar severity as measured by FEV1 and need for treatment, and were somewhat less methacholine reactive (in keeping with removal from exposure to the causative agent). The quality of the PEF record in numbers of readings/day and the duration of the record was similar in both groups.
Demographic data on workers and records included in the analysis
Table 2 shows the causative agents for the occupational asthma group and the methods for independent confirmation of the diagnosis of occupational asthma. The group was weighted in favour of low molecular weight agents and work in engineering, reflecting the industry in the West Midlands, UK.
Occupational asthma group: causes and method of independent diagnosis
Minimum data quantity
Ninety-three of 101 records of subjects with occupational asthma and 162 records of 188 control subjects with asthma had sufficient data on both work and rest days for comparison of at least four time points. Of these, 77% of gold standard positives had ⩾1 time point significantly worse on work days and 67% had ⩾2; 12% of the gold standard negatives had ⩾1 time point significantly worse on the “work” days and 1% had ⩾2. Further analysis was confined to those with data of at least four common time points.
Sensitivity and specificity with ⩾4 time point comparisons available for analysis
Sixty-seven percent of workers with occupational asthma had at least two significant time points with lower readings on work days; specificity was 99%. The requirement for only one significant time point difference increased sensitivity and reduced specificity each by around 10%. Visual analysis of false positive records found significant differences for the waking reading alone was the most common reason for a false positive assessment, and was sometimes due to somewhat later waking times on rest days. A repeat analysis requiring only one significant time point difference excluding the waking reading increased the specificity from 88% to 93% for records with at least four time points for comparison and did not alter sensitivity at 77% (fig 2). If this is confined to one record per patient the sensitivity is 74%. The mean (SD) fall required for a time point to be significant was 23 (13) l/min for the negative records and 29 (21) l/min for the positive records. The higher value for the positive records suggests the presence of carryover effects from exposed days to following rest days in the positive group.

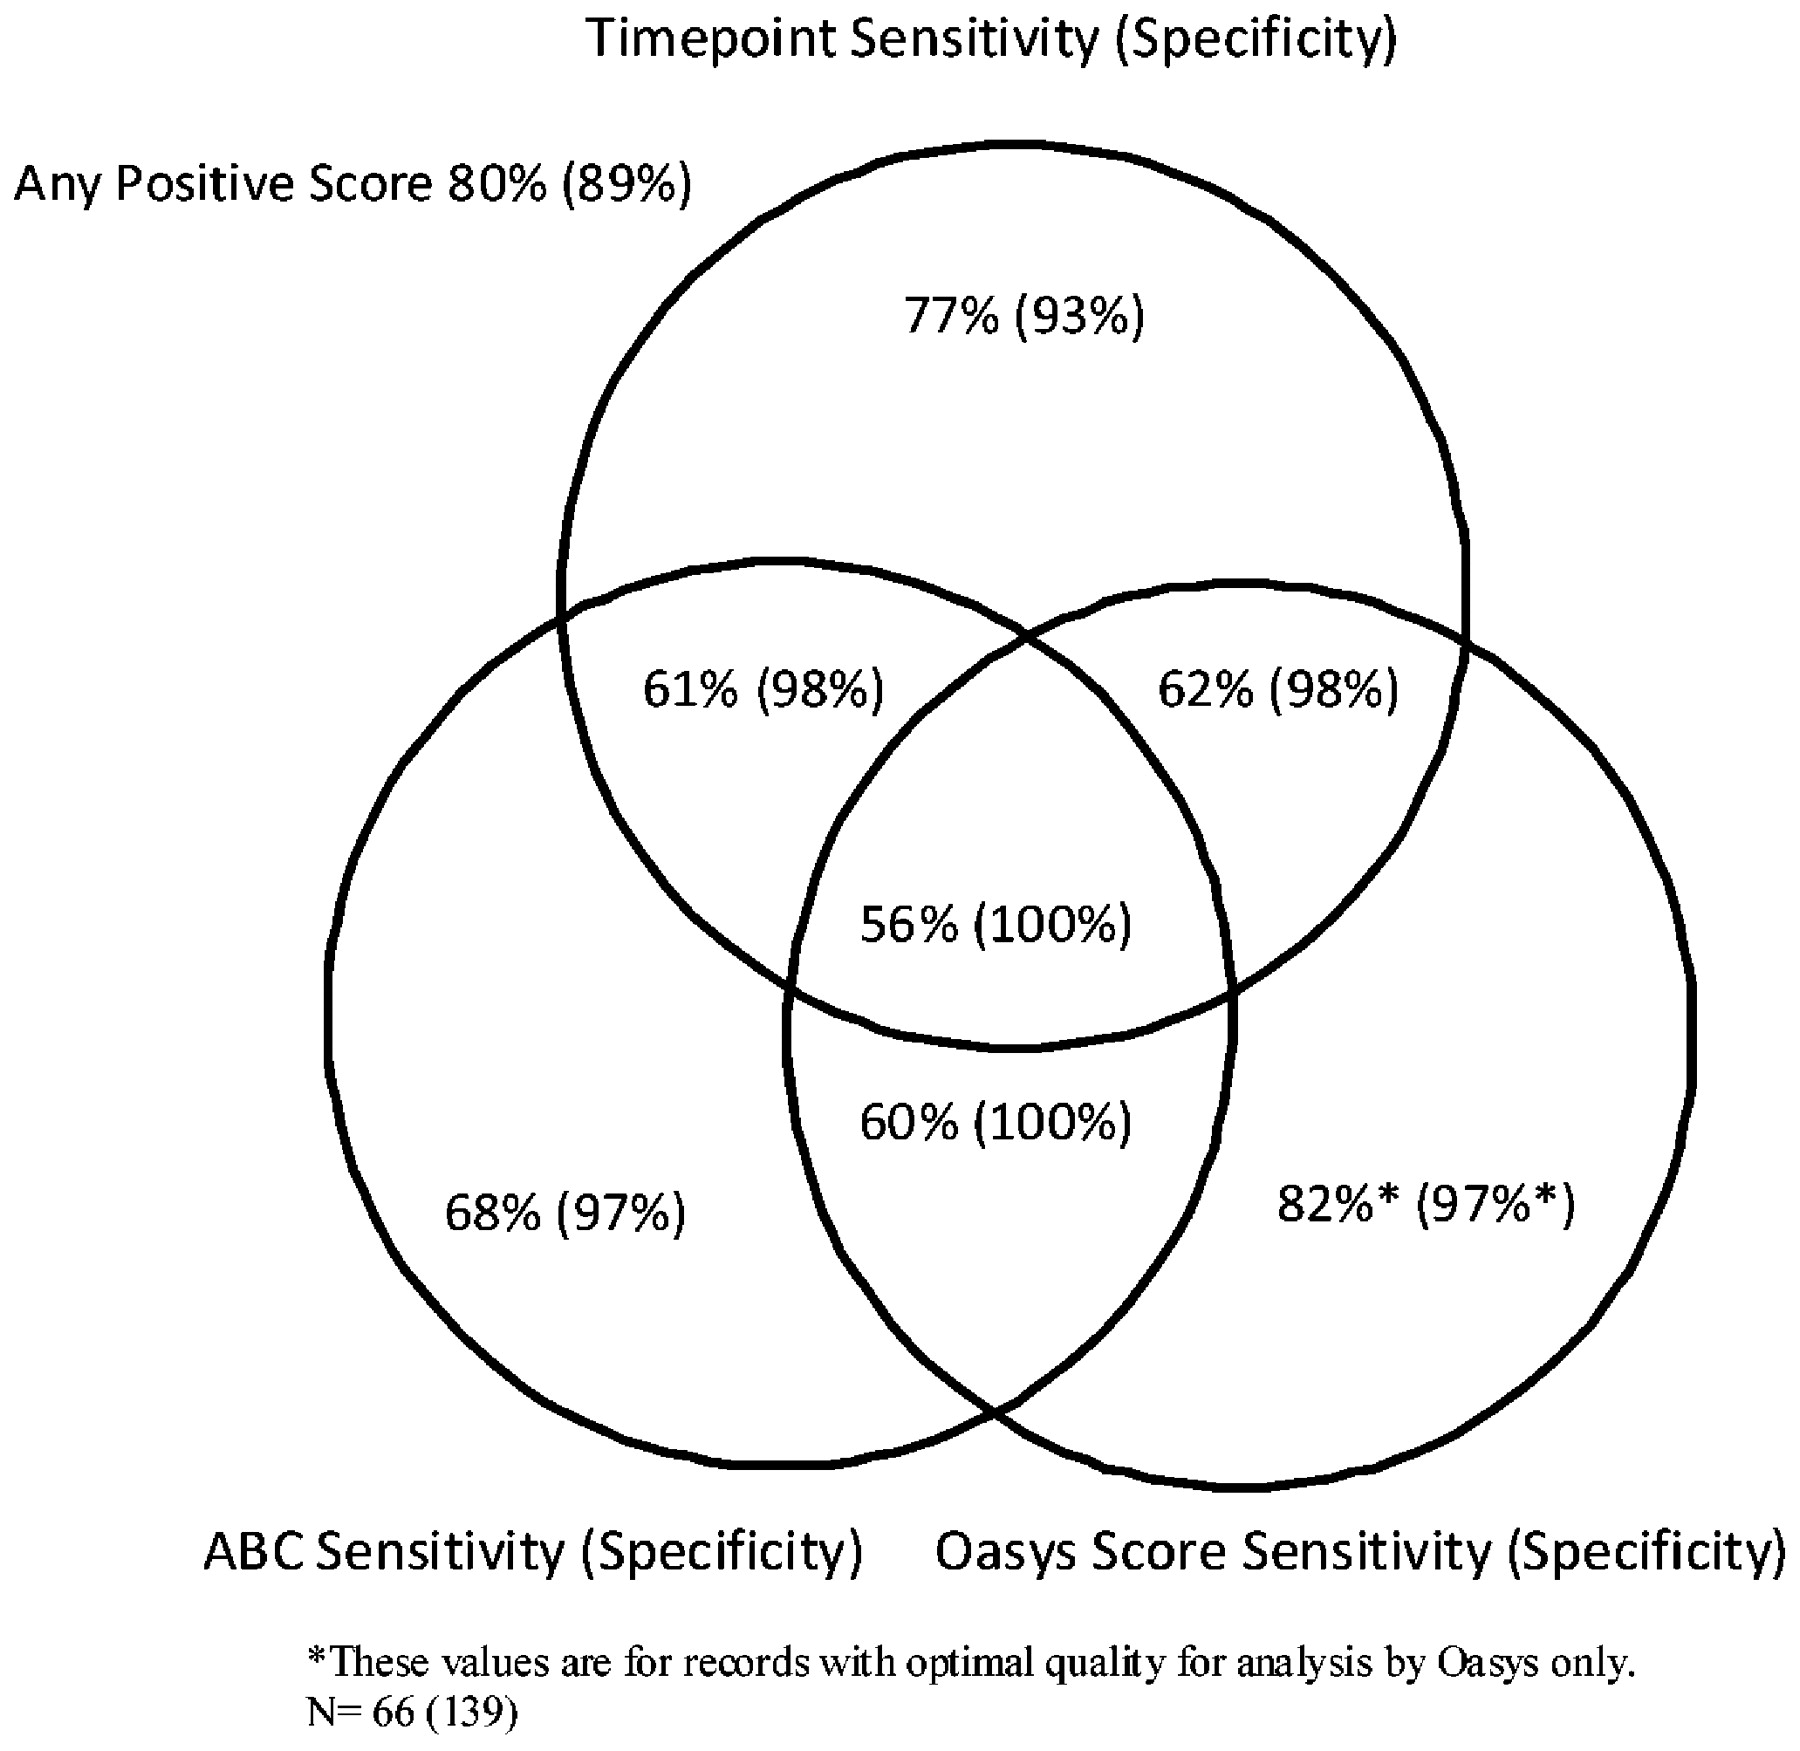
Comparison of time point analysis with previous methods of peak expiratory flow (PEF) analysis. For the Oasys score (from a discriminant analysis) an occupational asthma positive score was >2.5, and for the area between the curves (ABC) a positive score was ⩾15 l/min/h. Time point analysis for ⩾1 time point significantly worse on work days, excluding the waking reading.
Visual inspection of false negative records identified high variability on rest days as a common finding.
Comparison of time point analysis with ABC and Oasys scores
These were performed on all records that had at least four comparisons for the time point score (fig 2). Twenty-seven records did not fulfil the quality criteria for an optimal Oasys score, which requires longer records. The quality requirements for the ABC and time point analysis were similar. All methods of analysis were positive in 56% of the records from subjects with occupational asthma. Time point analysis increased the sensitivity above the other methods to 77%; there was some reduction of specificity to 93%.
Discussion
We have treated serial measurements of PEF over many days in the workplace in a similar manner to the analysis of specific inhalation challenges, and shown that a statistical method designed to detect late asthmatic reactions has a sensitivity of 67% and a specificity of 99% when there were at least two time points with significant work day deterioration and at least four time points for comparison. The sensitivity increased to 77% if only one significant difference was required, at the expense of reducing specificity by about 10%. This could be reduced if the waking time point was excluded. Exclusion of records with confounding factors, particularly differences in waking times between work days and days off, made this analysis suitable for only 101/236 existing records from workers with independently diagnosed occupational asthma. This could be improved if records were collected with time point analysis in mind.
Changes in PEF due to circadian variation are seen in nearly all subjects with asthma, with a nadir around waking and an acrophase (the time at which the peak of a rhythm occurs) 4–12 h later. Workplace exposure is superimposed on this. The present analysis is only for day shift work as differences in waking time have major influences on across-shift changes in lung function.10 11 Workers often wake later on days away from work, confounding analysis. In the present study we required modal waking times to be within 2 h on work and rest days but, even with this requirement, there was evidence that slightly later waking times on weekends increased waking PEF sufficiently to account for some false positive results in the control subjects with asthma.
It was assumed that the variability in rest day PEF measurements was similar and that the standard deviations of the 2-hourly rest day PEF measurements could be combined to provide a pooled standard deviation. This method has been validated in the analysis of late asthmatic reactions following specific inhalation challenge testing.8 The ability to detect significant differences between work and rest days requires a reasonably low variance for rest day PEF. We excluded records with upper respiratory infections when time off work (with infection) often shows reduced readings. We also excluded records which showed significant day-by-day increases or decreases in PEF, as may occur after starting (or stopping) prophylactic asthma treatments. The original Stenton method only used values on control days between 12.00 h and 22.00 h. This excludes any morning dip and is likely to reduce the rest day variance. We have calculated our rest day variance on all available measurements throughout the 24 h, which is likely to be more confounded by carryover effects. The finding of more than 5% positive time points in control subjects does suggest that the statistical method is underestimating variance at individual time points. Nevertheless, the sensitivity and specificity of the results remains valid. Despite this, the main reason for a negative test in those in whom the Oasys score was positive was increased variability in rest day PEF readings. This is likely to be a limitation of this method of analysis.
Validating a new test requires a “gold standard” with which to make comparison. Our control asthmatic group all had asthma, providing many of the confounding factors seen in workers with occupational asthma, but were not at work (at least they said they were not at work). By constructing artificial work periods from 09.00 h to 17.00 h Mondays to Fridays, many of the confounding exposures common to weekends were included. Most recognise specific inhalation testing as the gold standard for occupational asthma. However, these may be falsely negative in up to 29% of those with genuine occupational asthma, and more than this if asthma has otherwise been confirmed.12 We have been reluctant to do specific challenges when there is no evidence of any effect of usual work exposure from serial PEF measurements, as it is then very difficult to interpret the significance of any challenge positive results. Other recommended methods of validating occupational asthma include a significant improvement in non-specific reactivity between periods at and away from work. These are less sensitive and specific than challenge testing,1 but we have included this method of validation which is particularly useful for more severe occupational asthma where there are multiple agents in the workplace which are difficult to reproduce, such as welding fume. The role of specific challenge is less clear in exposures to high molecular weight agents such as enzymes and rodent urine, where a good clinical history, the objective confirmation of asthma and the finding of specific IgE to the enzyme or rodent urine is usually considered enough to confirm the diagnosis.13 As we do not usually perform specific challenges when the above data are clear, we have included them in the group with independently validated occupational asthma. The PEF records themselves were not accessed when the independent diagnosis of occupational asthma was made.
The Oasys software provides summary plots of PEF data including the daily maximum, mean and minimum PEF separated by work shift and exposure, and plots of the mean hourly PEF from waking (or by clock time) separated by exposures and shifts. This aids expert interpretation. However, as not all experts agree on the diagnosis of occupational asthma from PEF plots,14 15 reproducible methods of analysis are required. The original Oasys score, based on a discriminant analysis of work-rest-work complexes or their counterpart rest-work-rest complexes, has a sensitivity of 82% and a specificity of 94% for 4-week records with at least four readings per day.5 It requires longer periods of readings than other methods, but is tolerant of missing and mistimed readings. The ABC score requires at least eight readings per day, but only eight work days and three rest days.16 It has a sensitivity of 68% and a specificity of 91% using the same patient groups as the present study. None of the methods use diurnal variation or changes in diurnal variation in their calculations. Changes in diurnal variation between work and rest days discriminate poorly between those with and without occupational asthma and are not included in any of the validated methods of analysis.11
Most of the PEF readings used in the present study were made on manual meters and transcribed onto record cards by the worker. Several investigators have found significant discrepancies between hand transcribed and logged PEF readings.17 Although some of the differences may be due to the logging meter software (such as overwriting readings made within 1 h and incorrect setting of the logging meter clock), there is evidence of prefabrication for a significant proportion of readings. All the methods described above include any prefabricated readings, which we have found are usually recorded as average readings for the particular patient rather than outliers which would have a larger effect on interpretation.18 The original Oasys score is tolerant of mistimed readings; however, the ABC and time point analyses depend on accurate timings and should be considerably improved using data-logged recordings from reliable meters.
The diagnosis of occupational asthma from serial PEF measurements has been slow to gain widespread acceptance.19 We hope that the addition of time point analysis—which is based on methods used for specific inhalation challenge testing—and its validation in the workplace will help sceptics. Occupational asthma is currently widely underdiagnosed, at least in part from the lack of specialist expertise. The analysis of serial PEF measurements is more sensitive and specific than any other externally validated method of diagnosis, including those based on non-specific reactivity,1 and is suitable for use outside specialist centres. A positive analysis is the start of further investigation. It does not usually identify the cause of occupational asthma, but can be used to confirm successful relocation as its specificity is high.
REFERENCES
Footnotes
Funding VCM has a PhD fellowship from the COLT Foundation.
Competing interests None.
Provenance and peer review Not commissioned; externally peer reviewed.