Article Text

Abstract
Background: A Th1 predominant immune response has been shown in acute hypersensitivity pneumonitis. Predominance of Th2 appears to favour the development of pulmonary fibrosis through the profibrotic process and has been described as crucial in the progression of idiopathic pulmonary fibrosis. Chronic bird fancier’s lung (cBFL) can present with a histological pattern of usual interstitial pneumonia (UIP)-like lesions. Little is known about the Th1/Th2 balance in the pathogenesis of cBFL.
Methods: To evaluate the relevance of Th1-type chemokines (interferon-inducible protein, IP-10) and Th2-type chemokines (thymus- and activation-regulated chemokine, TARC) and their receptors (CXCR3 and CCR4) to the histological patterns of cBFL, 40 patients with cBFL who underwent surgical lung biopsies, 12 with acute BFL (aBFL) and 10 healthy volunteers were analysed. IP-10 and TARC levels in serum and bronchoalveolar lavage (BAL) fluid were measured by ELISA. Immunohistochemistry for CXCR3 and CCR4 was performed on surgical lung specimens.
Results: The ratio of TARC to IP-10 in the serum of patients with UIP-like lesions was significantly higher than in patients with cNSIP/OP-like lesions, aBFL and healthy volunteers. The ratio of CCR4 to CXCR3 in patients with UIP-like lesions was significantly higher than in those with cNSIP/OP-like lesions and fNSIP-like lesions. The ratio of CCR4-positive to CXCR3-positive cells correlated with the ratio of TARC to IP-10 in serum.
Conclusions: A Th2 predominant immune response may play an important role in the development of UIP-like lesions, as already observed in idiopathic pulmonary fibrosis. A Th1 predominance may play a role in the development of cNSIP/OP-like lesions in cBFL.
Statistics from Altmetric.com
Hypersensitivity pneumonitis (HP) is an immunologically mediated lung disease induced by inhalation of antigens contained in a variety of organic dusts. Bird fancier’s lung (BFL) is a type of HP and develops in individuals who are susceptible to avian antigens. Patients with BFL sometimes present with acute HP but more frequently they present with chronic HP because exposure to birds tends to be chronic with small amounts of antigens.1 Chronic BFL (cBFL) is further subgrouped into recurrent and insidious BFL. Patients with recurrent BFL often breed dozens of pigeons in lofts. They tend to inhale much more avian antigens than those with insidious BFL. In contrast, patients with insidious BFL are often exposed indoors to small birds such as budgerigars, with long-term exposure to much smaller amounts of avian antigens.2 Surgical lung specimens from patients with cBFL have various histological patterns such as usual interstitial pneumonia (UIP)-like lesions, fibrotic non-specific interstitial pneumonia (fNSIP)-like lesions, cellular NSIP (cNSIP)-like lesions and organising pneumonia (OP)-like lesions as seen in idiopathic interstitial pneumonias. The prognosis of patients with cBFL is variable based on each of their histological patterns.3
T helper types 1 and 2 cells (Th1 and Th2) are thought to play a crucial role in fibrogenesis.4 Pulmonary Th1 cells, which produce interferon-γ (IFNγ), are likely to inhibit fibrosing processes5 whereas a switch to Th2-type immune response with concomitant release of interleukin 4 (IL-4) is essential for the expression of mesenchymal matrix components in the surrounding environment.6 A Th2 predominant immune response has been described as crucial in the progression of idiopathic pulmonary fibrosis (IPF) since the CCR4/CXCR3 ratio of CD4 lymphocytes in bronchoalveolar lavage (BAL) fluid was higher in patients with IPF than in non-IPF patients, those with sarcoidosis and healthy control subjects.7 Although a Th1 predominant immune response has been shown to be pivotal in acute HP,8 little is known about the Th1/Th2 balance in the pathogenesis of “chronic” HP. The Th1 and Th2 balance can be evaluated by the detection of chemokine receptors on T cells. CXCR3 is expressed on Th1 cells whereas CCR4 is expressed on Th2 cells.9 10 IFNγ-inducible protein (IP-10, CXCL10) is a chemokine of the CXC subfamily and is the ligand for the receptor CXCR3. In acute HP, IFNγ mediates the recruitment of lymphocytes into the lung via the production of IP-10.8 In addition, CXCR3 exhibits a significant role in attenuating pulmonary fibrosis in the bleomycin mouse model.11 Thymus- and activation-regulated chemokine (TARC, CCL17) is a chemokine of the CC subfamily and is the ligand for the receptor CCR4; it is crucial in the development of pulmonary fibrosis in the bleomycin mouse model.12
We therefore hypothesised that Th1 chemokine (IP-10) plays a role in the inhibition of fibrosing processes whereas Th2 chemokine (TARC) is involved in the acceleration of fibrosis. If this is the case, cBFL may present various histological patterns such as UIP-like lesions, fNSIP-like lesions, cNSIP and OP-like lesions according to the Th1/Th2 balance. We have evaluated the relevance of IP-10 and TARC levels in serum and BAL fluid and CXCR3- and CCR4-positive lymphocytes in surgical biopsy specimens to analyse the Th1/Th2 chemokine balance involved in the pathogenesis of cBFL with UIP-like lesions, fNSIP-like lesions, cNSIP-like lesions and OP-like lesions.
METHODS
Study population
A retrospective review was conducted between April 1993 and March 2006 of the medical records of patients admitted to Tokyo Medical and Dental University; 40 patients with cBFL who underwent surgical lung biopsies, 12 patients with acute BFL (aBFL) and 10 healthy volunteers with no avian exposure were analysed.
The diagnostic criteria for cBFL included (1) a history of avian contact, (2) antibodies and/or lymphocyte proliferation to avian antigen and (3) reproduction of symptoms of HP by environmental provocation or laboratory-controlled inhalation of avian antigen;13 either (4) evidence of pulmonary fibrosis with or without granulomas on histological analysis or (5) honeycombing on CT scans; and either (6) progressive deterioration of a restrictive impairment on pulmonary function for 1 year or (7) respiratory symptoms related to HP for more than 6 months.14 Histological patterns were subgrouped by three pulmonary pathology specialists without knowledge of the patient’s clinical course into UIP-like lesions, fNSIP-like lesions and cNSIP/OP-like lesions according to the international classification of idiopathic interstitial pneumonias proposed by the joint ATS/ERS statement in 2002.15
The study conformed to the declaration of Helsinki and was approved by the internal review board of our institution. Informed written consent was obtained for each subject.
Inhalation challenge and immunological findings
Antigen inhalation provocation tests were conducted as previously described.13 Antibodies in serum and BAL fluid to phosphodiesterase were measured by an enzyme-linked immunosorbent assey (ELISA) and the antigen-induced lymphocyte proliferation test was performed as previously described.16
High-resolution CT (HRCT) scoring
HRCT scans were reviewed independently by four experienced respiratory physicians (YM, MK, TJ, HF). They scored ground glass opacity for ground glass scores and reticular opacity for fibrosis scores. The outlines of the scoring system used for the evaluation have been described previously by Kazerooni et al.17 Each lobe of the lung was scored on a scale of 0–5. The scores for each lobe were averaged for all four readers for data analysis.
Bronchoalveolar lavage (BAL)
BAL was performed as previously described13 using three 50 ml aliquots of sterile 0.9% saline. The cellular composition of the BAL fluid was determined using a cytospun smear with Wright stain by counting 200 cells. Lymphocyte phenotypes were performed by flow cytometry with monoclonal antibodies for CD4 and CD8.
Measurement of IP-10 and TARC
The levels of IP-10 and TARC in serum and BAL fluid were measured by ELISA using commercial ELISA kits (DuoSet; R&D Systems, Minneapolis, USA) following the manufacturers’ instructions for undiluted BAL fluid samples and serum samples diluted 1:2.
Immunohistochemical analysis
Surgical lung biopsy specimens were analysed using an immunohistochemical double stain method as previously described18 to determine the localisation of CXCR3 and IP-10, or CCR4 and TARC. Paraffin-embedded 4 μm sections in antigen unmasking solution (Vector Laboratories, Burlingame, USA) were autoclaved. Endogenous peroxidase was blocked by 3% hydrogen peroxide and endogenous avidin or biotin activity was blocked by Avidin/Biotin Blocking Kit (Vector Laboratories). The sections were incubated with anti-CXCR3 (mouse anti-human IgG; BD Biosciences, San Jose, USA diluted in 1.25 μg/ml) or anti-CCR4 (mouse anti-human IgG; a gift from Kyowa Hakko, Tokyo, Japan diluted in 2.5 μg/ml). The sections were then incubated with biotinylated secondary antibodies (horse anti-mouse IgG; Vector Laboratories). After incubation with ABC kit (Vector Laboratories), DAB (Nichirei, Tokyo, Japan) was added. For a second sequence, any unbound biotin activity resulting from the first step was blocked by the Avidin/Biotin Blocking Kit. The sections were then incubated with anti-IP-10 (rabbit anti-human IgG; Pepro Tech, London, UK diluted in 10 μg/ml) or anti-TARC (goat anti-human IgG; R&D Systems, diluted in 4 μg/ml) overnight at 4°C. Sections were then incubated with biotinylated secondary antibodies (goat anti-rabbit or horse anti-goat IgG; Vector Laboratories). After incubation with AP-ABC kit (Vector Laboratories), Vector Red Substrate Kit and levamisole (Vector Laboratories) was added. Tissue sections were counterstained with Mayer’s haematoxylin and mounted with a coverslip.
Semiquantification of CCR4-positive and CXCR3-positive cells
The positive staining of infiltrating mononuclear cells for anti-CXCR3 and CCR4 was separately evaluated blinded to the diagnosis in fibrosing areas and in lymphoid clusters of surgical lung biopsy specimens by immunohistochemistry. The positive cells were counted in 20 random high power (×400) fields (HPFs) of fibrosing areas and in 5 HPFs of lymphoid clusters. Quantification of immunohistochemistry was performed by MK. The positive cells were counted on three separate occasions to obtain the average.
Statistical analysis
Data were analysed using SAS Version 9.1 (SAS Institute, USA). When the data were normally distributed—such as the recovered volume, total cell counts, percentage of macrophages and lymphocytes in BAL fluid, age, percentage of vital capacity and total lung capacity, arterial oxygen tension (Pao2), alveolar–arterial difference in oxygen delivery to the lungs (A–aDo2), fibrosis score, ground glass score and the ratio of CCR4-positive to CXCR3-positive cells—the Tukey-Kramer test was used. When the data were not normally distributed—such as the percentage of neutrophils and eosinophils, ratio of CD4 to CD8 in BAL fluid, serum and BAL fluid levels of IP-10, TARC levels and the ratio of TARC to IP-10—the Steel-Dwass test was used. Correlations between the serum TRAC to IP-10 ratio and the CCR4-positive to CXCR3-positive cell ratio were assessed with the Pearson’s correlation coefficient. p Values <0.05 were considered significant. Data are presented as mean (SD) values in the text and in tables 1 and 2 and figs 1, 2, 3 and 5.


RESULTS
Clinical features of cBFL
Forty patients with cBFL were analysed (table 1), of whom 19 had UIP-like lesions (15 men and 4 women, 18 insidious BFL and 1 recurrent BFL), 13 had fNSIP-like lesions (5 men and 8 women, 8 insidious BFL and 5 recurrent BFL) and 8 had cNSIP/OP-like lesions (6 cNSIP and 2 OP, 3 men and 5 women, 1 insidious BFL and 7 recurrent BFL). There were no significant differences in age between the three groups. Ten of the 19 patients with UIP-like lesions died of respiratory failure as a result of disease progression. The mean (SD) time from diagnosis to death was 32 (17.5) months. Only one of 13 patients with fNSIP-like lesions died of respiratory failure due to disease progression, even though this patient had tried to avoid the causal antigen and had been treated by corticosteroids alone or with either cyclosporine or cyclophosphamide. All patients with cNSIP/OP-like lesions are alive since they have avoided the causal antigen and have been treated with corticosteroids only. The percentage of total lung capacity (TLC) in patients with UIP-like lesions was significantly lower than that in patients with cNSIP/OP-like lesions (69.6 (20.0)% vs 98.9 (20.0)%, p = 0.031). No differences were detected in the percentage of VC. A–aDo2 in patients with cNSIP/OP-like lesions was significantly higher than in patients with UIP-like lesions (4.35 (1.69) kPa vs 2.51 (1.75) kPa, p = 0.049). Pao2 was significantly lower in patients with cNSIP/OP-like lesions than in patients with UIP-like lesions (9.1 (1.2) kPa vs 10.8 (1.2) kPa, p = 0.039). The fibrosis score in patients with UIP-like lesions and fNSIP-like lesions was significantly higher than in patients with cNSIP/OP-like lesions (2.19 (0.71) vs 1.29 (0.32), p = 0.011; and 2.21 (0.82) vs 1.29 (0.32), p = 0.015). The ground glass score in patients with cNSIP/OP-like lesions was significantly higher than in patients with UIP-like lesions (2.89 (0.98) vs 1.92 (0.75), p = 0.016).
In BAL fluid profiles, no differences were detected in volume of fluid returned among all groups. The number of total cell counts was significantly increased in cNSIP/OP-like lesions compared with patients with fNSIP-like lesions (69.5 (41.4)×106 vs 26.9 (12.0)×106, p = 0.042, table 2). The percentage of macrophages was significantly lower in patients with cNSIP/OP-like lesions and fNSIP-like lesions than in those with UIP-like lesions (29.9 (28.1)% vs 72.4 (18.0)%, p<0.001; and 51.2 (18.9)% vs 72.4 (18.0)%, p = 0.027). The percentage of lymphocytes was significantly higher in patients with cNSIP/OP-like lesions than in those with UIP-like lesions and fNSIP-like lesions (67.2 (30.5)% vs 21.7 (16.4)%, p<0.001; and 67.2 (30.5)% vs 40.8 (20.8)%, p = 0.039).
Serum and BAL fluid levels of IP-10
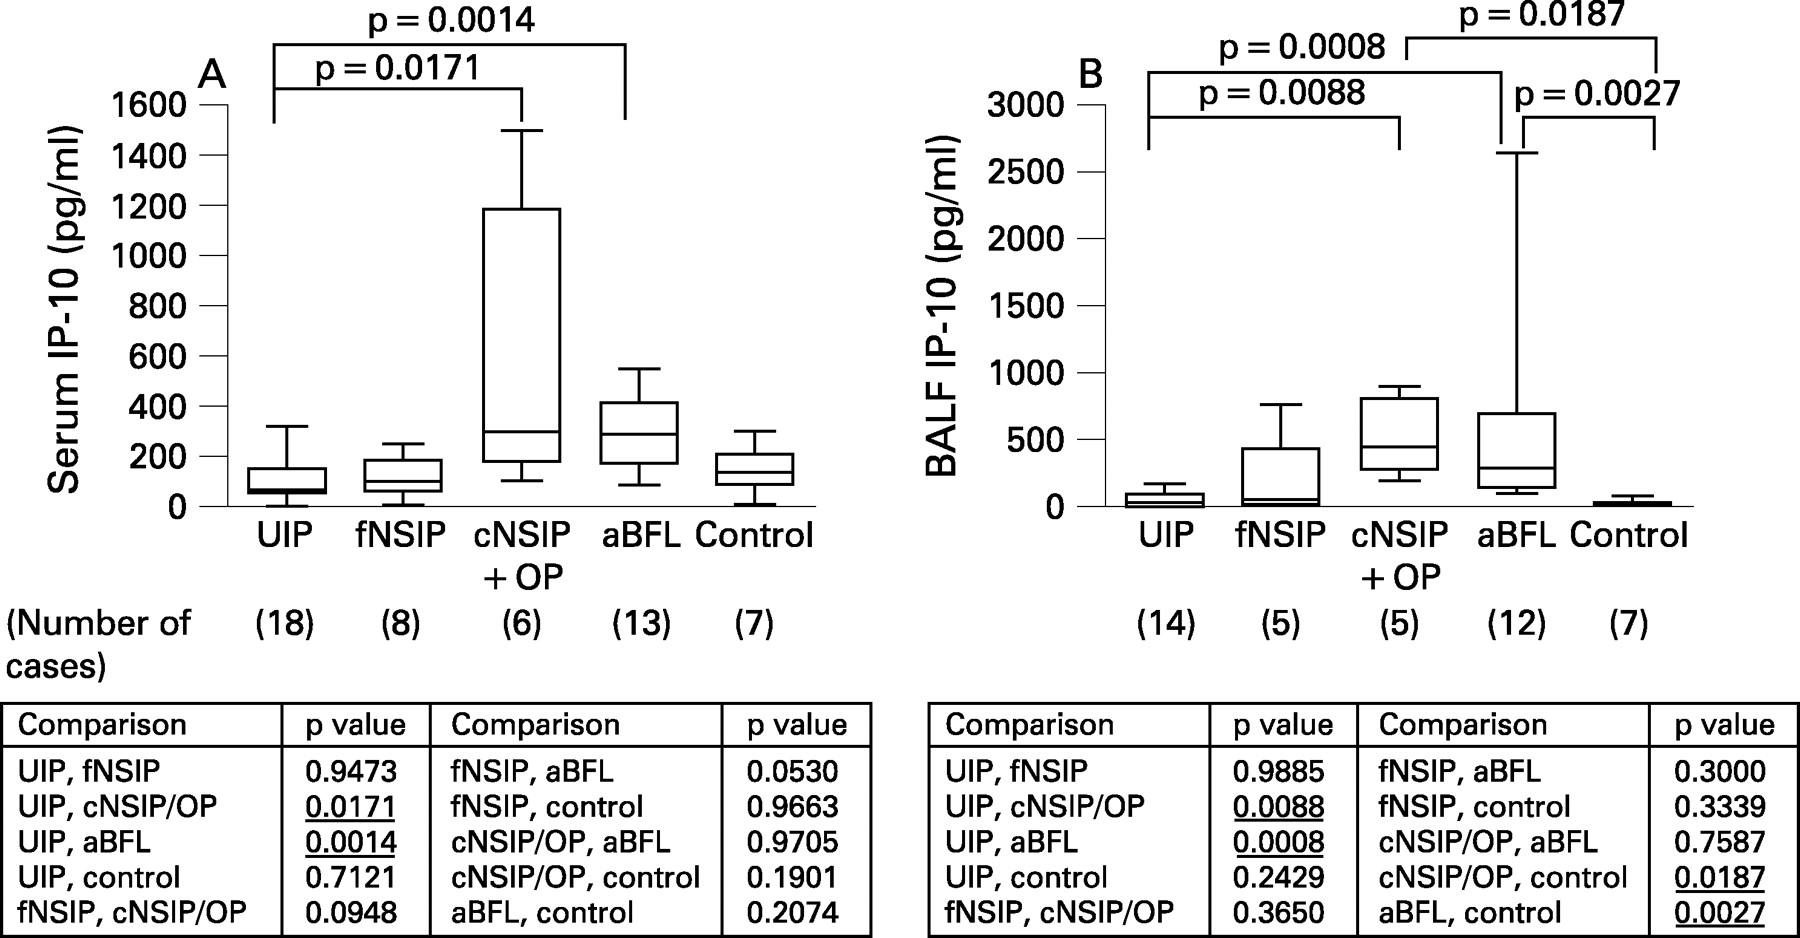
Levels of IP-10 and TARC in serum and BAL fluid were measured by ELISA in the four groups of patients (UIP-like lesions, fNSIP-like lesions, cNSIP/OP-like lesions and aBFL) and the healthy control volunteers. The mean (SD) serum IP-10 level was 93.8 (77.2) pg/ml in patients with UIP-like lesions, 113.7 (81.4) pg/ml in those with fNSIP-like lesions, 544.4 (536.3) pg/ml in those with cNSIP/OP-like lesions, 291.7 (147.1) pg/ml in patients with aBFL and 139.1 (94.4) pg/ml in healthy control volunteers. The mean (SD) IP-10 level in BAL fluid was 47.8 (43.5) pg/ml in those with UIP-like lesions, 179.1 (312.0) pg/ml in patients with fNSIP-like lesions, 506.9 (278.4) pg/ml in those with cNSIP/OP-like lesions, 518.1 (713.2) pg/ml in those with aBFL and 15.2 (13.9) pg/ml in healthy control volunteers. As shown in fig 1, the serum level of IP-10 in patients with cNSIP/OP-like lesions (544.4 (536.3) pg/ml) and those with aBFL (291.7 (147.1) pg/ml) was significantly higher than in patients with UIP-like lesions (93.8 (77.2) pg/ml) (p = 0.017 and p = 0.001, respectively). The BAL fluid level of IP-10 in patients with cNSIP/OP-like lesions (506.9 (278.4) pg/ml) and aBFL (518.1 (713.2) pg/ml) was significantly higher than in those with UIP-like lesions (47.8 (43.5) pg/ml) (p = 0.009 and p<0.001, respectively) and in healthy control volunteers (15.2 (13.9) pg/ml) (p = 0.019 and p = 0.003, respectively).
Serum and BAL fluid levels of TARC
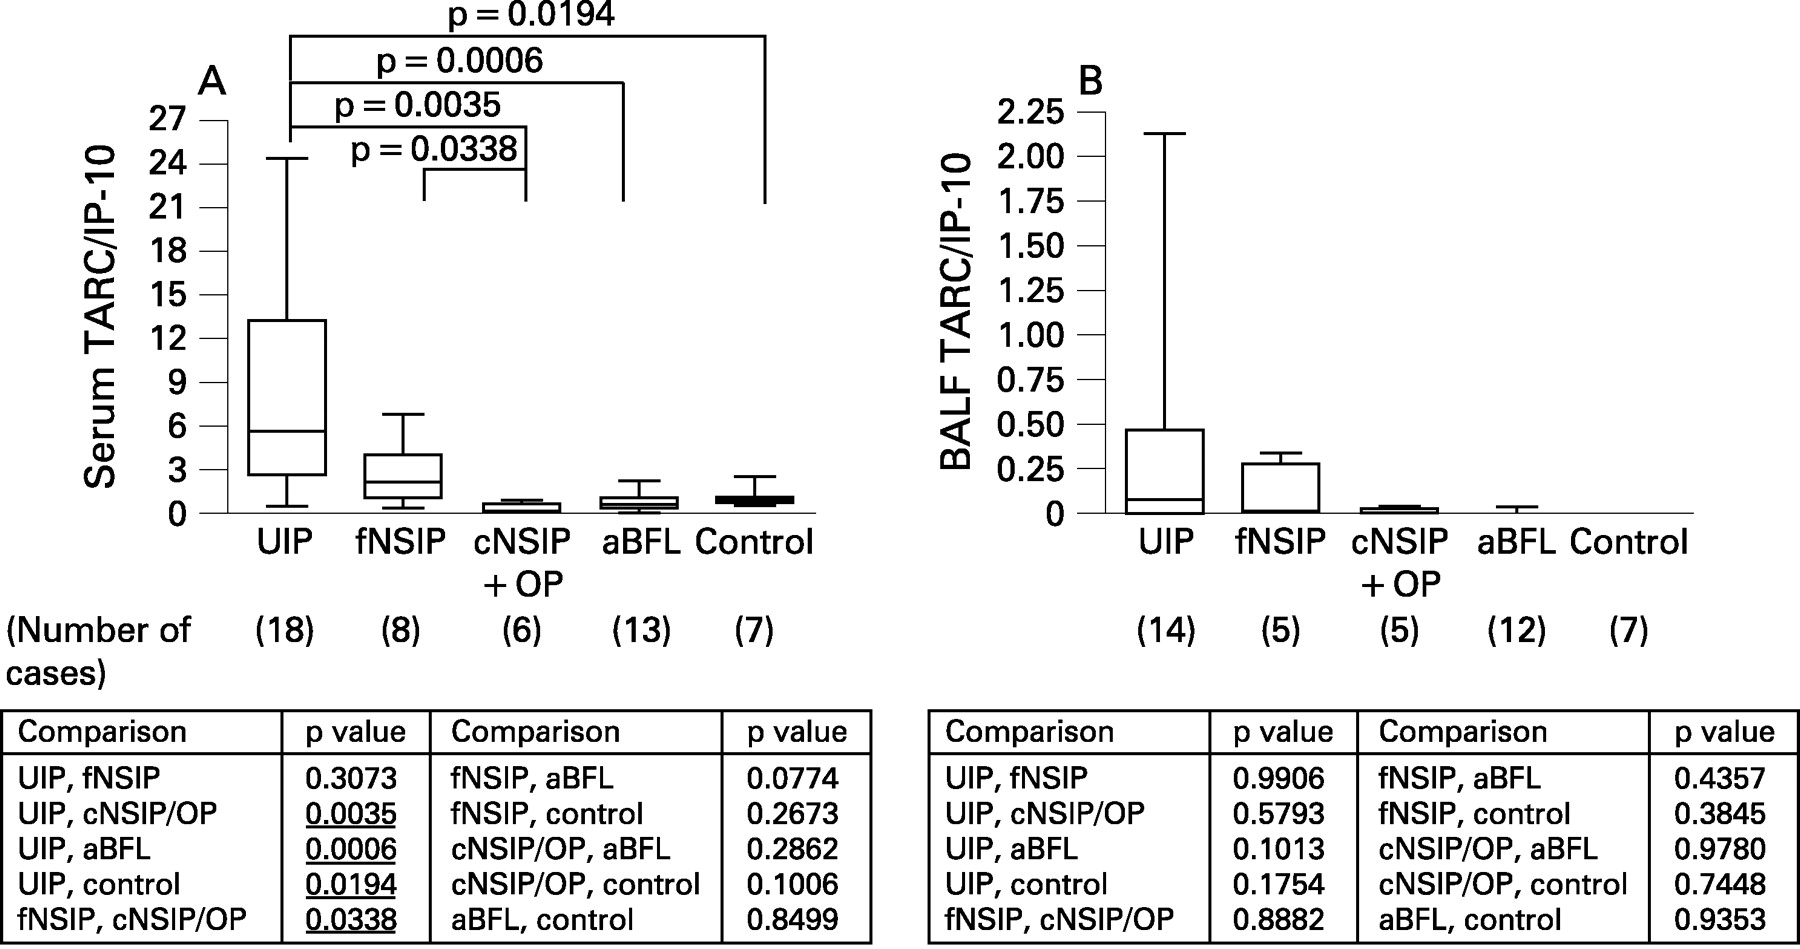
The serum TARC level was 500.3 (319.9) pg/ml in patients with UIP-like lesions, 305.3 (395.5) pg/ml in those with fNSIP-like lesions, 129.1 (97.7) pg/ml in those with cNSIP/OP-like lesions, 193.0 (160.0) pg/ml in those with aBFL and 100.4 (60.4) pg/ml in healthy control volunteers. The BAL fluid TARC level was 9.3 (11.0) pg/ml in patients with UIP-like lesions, 8.6 (13.8) pg/ml in those with fNSIP-like lesions, 1.8 (4.1) pg/ml in those with cNSIP/OP-like lesions, 1.7 (6.1) pg/ml in those with aBFL and 0.0 (0.0) pg/ml in healthy control volunteers. As shown in fig 2, the serum level of TARC in patients with UIP-like lesions (500.3 (319.9) pg/ml) was significantly higher than in those with cNSIP/OP-like lesions (129.1 (97.7) pg/ml) and in healthy control volunteers (100.4 (60.4) pg/ml) (p = 0.046 and p = 0.013, respectively). The serum level of TARC in patients with fNSIP-like lesions was between the levels in patients with UIP-like lesions and those with cNSIP/OP-like lesions.
Ratio of TARC to IP-10 in serum and BAL fluid
The ratio of TARC to IP-10 was 8.351 (7.60) in the serum of patients with UIP-like lesions, 2.731 (2.20) in those with fNSIP-like lesions, 0.305 (0.26) in those with cNSIP/OP-like lesions, 0.775 (0.64) in patients with aBFL and 0.978 (0.69) in healthy control volunteers. The TARC to IP-10 ratio in the BAL fluid was 0.399 (0.73) in patients with UIP-like lesions, 0.114 (0.16) in those with fNSIP-like lesions, 0.005 (0.01) in those with cNSIP/OP-like lesions, 0.003 (0.01) in patients with aBFL and 0.000 (0.00) in healthy control volunteers. As shown in fig 3, the ratio of TARC to IP-10 in the serum of patients with UIP-like lesions (8.351 (7.60)) was about 27.4 times higher than in patients with cNSIP/OP-like lesions (0.305 (0.26)), about 10.8 times than in those with aBFL (0.775 (0.64)) and about 8.5 times higher than in healthy control volunteers (0.978 (0.69)) (p = 0.004, p<0.001, p = 0.020, respectively). The TARC to IP-10 ratio of serum in patients with fNSIP-like lesions (2.731 (2.20)) was about 9-fold increased over patients with cNSIP/OP-like lesions (0.305 (0.26), p = 0.034).
Ratio of CCR4-positive to CXCR3-positive cells
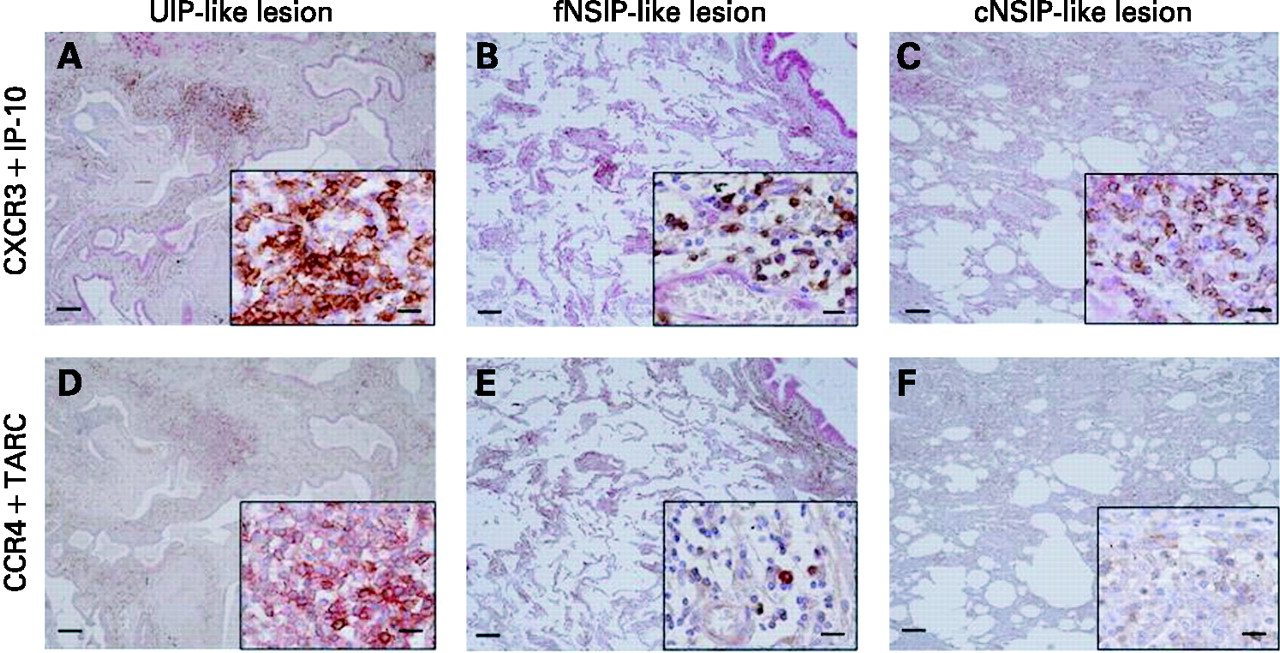
Intense IP-10 immunostaining was found in epithelial cells, macrophages, fibroblasts and endothelial cells in surgical biopsy tissues of UIP-like lesions, fNSIP-like lesions and cNSIP/OP-like lesions (fig 4A–C). Marked TARC immunostaining was found in epithelial cells in surgical biopsy specimens of UIP-like lesions, fNSIP-like lesions and cNSIP/OP-like lesions (fig 4D–F). Many mononuclear cells showed as CXCR3-positive cells in both lymphoid clusters and fibrosing areas in each group (fig 4A–C). CXCR3-positive cells were also positive for CD3 (T cell lymphocytes) (data not shown). Many mononuclear cells were CCR4-positive in surgical biopsy specimens of UIP-like lesions (fig 4D) but few mononuclear cells were CCR4-positive in surgical biopsy specimens of fNSIP-like and cNSIP/OP-like lesions (fig 4E, F). CCR4-positive cells were CD3-positive lymphocytes (data not shown). In lymphoid clusters the ratio of CCR4-positive to CXCR3-positive cells in UIP-like lesions (0.362 (0.124)) was significantly higher than that in fNSIP-like lesions (0.231 (0.062)) and cNSIP/OP-like lesions (0.123 (0.078)) (p = 0.006 and p<0.001, respectively). In fibrosing areas the ratio of CCR4-positive to CXCR3-positive cells in patients with UIP-like lesions (0.428 (0.183)) was also significantly higher than in those with fNSIP-like lesions (0.244 (0.134)) and cNSIP/OP-like lesions (0.082 (0.036)) (p = 0.011 and p<0.001, respectively, fig 5). The ratios of CCR4-positive to CXCR3-positive cells and serum TARC to IP-10 were normalised by conversion to logarithms. The logarithm of the ratio of CCR4-positive to CXCR3-positive cells correlated with the ratio of serum TARC to IP-10 in both lymphoid clusters (r = 0.422, p = 0.035) and fibrosing areas (r = 0.600, p = 0.001; fig 6).

DISCUSSION
This study has evaluated the relevance of serum and BAL fluid levels of IP-10 and TARC and the number of CXCR3- and CCR4-positive lymphocytes in histological patterns of tissue from patients with cBFL. Several factors were identified that may participate in the progression of the lesions of cBFL.
A higher TARC to IP-10 ratio in the serum and BAL fluid and a higher ratio of CCR4-positive to CXCR3-positive cells in lung specimens were observed in patients with UIP-like lesions compared with patients with cNSIP/OP-like lesions. On the other hand, a lower TARC to IP-10 ratio in the serum and BAL fluid and a lower ratio of CCR4-positive to CXCR3-positive cells in lung specimens were seen in patients with cNSIP/OP-like lesions compared with those with UIP-like lesions. These results suggest a shift to a Th2 immune response, and this response may have a role in the progression of UIP-like lesions. Moreover, a shift to a Th1 predominant immune response was seen in the progression of cNSIP/OP-like lesions.
Acute HP has been considered as a immunological disease predominated by Th1. C57BL/6 mice, which are genetically Th1-prone, were susceptible to Saccharopolyspora rectivirgula (SR) and developed an acute disease, in contrast Th2-prone DBA/2 mice which were resistant to SR.19 Mice with no expression of the gene coding for IFNγ developed minimal inflammation and no granulomas after exposure to SR.20 IFNγ may mediate the recruitment of CXCR3-positive lymphocytes into the lung via the production of IP-10 in mice and in patients with acute HP, resulting in Tc1 cell alveolitis and granuloma formation.8 21 In a human study of gene expression profiles, IP-10 is thought to be essential for recruitment of activated T cells through the chemokine receptor CXCR3 and has been associated with Th1 immune responses in acute HP.22 IL-10-deficient mice exposed to SR resulted in an increase in alveolitis associated with the upregulation of IFNγ.23 Th2 cells may have important anti-inflammatory properties in acute HP, as observed in a murine model exposed to SR which showed that inflammatory responses were attenuated by infusing IL-4.24 Severe alveolitis and granuloma formation of the lung are common lesions in aBFL and cNSIP/OP-like lesions, whereas they are few in UIP-like lesions of cBFL. Granuloma formation was found in 42.9% of cNSIP/OP-like lesions but only in 25.0% of fNSIP-like lesions and was not observed in UIP-like lesions.3 The ground glass score on the HRCT scan in patients with cNSIP/OP-like lesions was significantly higher than in patients with UIP-like lesions. As the ground glass score correlated with the pathological inflammatory score as previously described.17 cNSIP/OP-like lesions showed more severe interstitial inflammation on the HRCT scan and histological specimens than UIP-like lesions. A shift to a Th1 predominant immune response may therefore play an important role in the pathology of aBFL and cNSIP/OP-like lesions.
TARC (Th2-type chemokine) and its receptor CCR4 have a crucial role in the development of pulmonary fibrosis in the bleomycin mouse model and in the model of radiation pneumonitis in rats.12 25 The present study showed a higher ratio of TARC to IP-10 in serum and BAL fluid in UIP-like lesions than in cNSIP/OP-like lesions. We analysed the levels of IP-10 and TARC in serum and BAL fluid in 12 patients with IPF and found a higher ratio than in healthy control volunteers (serum: 11.28 (9.82) and 0.252 (0.40), respectively; p = 0.014) (BAL fluid: 0.978 (0.69) and 0.000 (0.00), respectively; p = 0.119). The ratio of TARC to IP-10 was similar to that in UIP-like lesions of cBFL in this study. An imbalance in CXCR3/CCR4 expression on BAL fluid CD4 lymphocytes and reduced IP-10 levels in the BAL fluid in patients with IPF were pivotal in the progression of IPF.7 Furthermore, a shift to a Th2 immune response has been described as crucial in the progression of IPF.4–6
TARC might be important for the development of pulmonary fibrosis. We found the fibrosis score on the HRCT scan in patients with UIP-like lesions was significantly higher than in those with cNSIP/OP-like lesions. As UIP-like lesions have more dense interstitial fibrosis than cNSIP/OP-like lesions on histological specimens, the fibrosis score is strongly correlated with the pathological fibrosis score.17 These observations suggest that a shift to a Th2 immune response plays a critical role in the pathology of UIP-like lesions. It has been shown that TARC was detectable in patients with IPF but not in control subjects, and the ratio of CCR4-positive to CXCR3-positive cells in IPF/UIP was significantly greater than in idiopathic NSIP and in IP associated with collagen vascular diseases.7 26-28 Not only similar pathological findings but also a shift to a Th2 immune response observed in patients with IPF is likely to occur in patients with UIP-like lesions of cBFL.
In conclusion, a shift to a Th1 immune response may play an important role in the pathology of cNSIP/OP-like lesions. A shift to a Th2 immune response may play a critical role in the pathology of UIP-like lesions. The balance between Th1 and Th2 may contribute to the progression of lung inflammation and lung fibrosis leading to the individual histological patterns and clinical types in cBFL.
Acknowledgments
The authors thank Kyowa Hakko, Tokyo, Japan and Dr Ryuzo Ueda, Nagoya City University, Aichi, Japan for a generous gift of anti-CCR4 antibody used in this study; Dr VL Moore, Merck Research Laboratories (retired), Phillips, Wisconsin, USA for the critical review of the manuscript; Dr Hiroshi Tanaka, Information Center for Medical Science, and Dr Wataru Ohashi, Department of Bioinformatics Graduate School of Medicine and Dentistry, Tokyo Medical and Dental University, Tokyo, Japan for advice on statistical analysis.
REFERENCES
Footnotes
Competing interests: None.
Ethics approval: The study conformed to the declaration of Helsinki and was approved by the internal review board of our institution. Informed written consent was obtained for each subject.