Article Text

Abstract
Background: Phase I of the International Study of Asthma and Allergies in Childhood (ISAAC) was designed to allow worldwide comparisons of the prevalence of asthma symptoms. In phase III the phase I survey was repeated in order to assess changes over time.
Methods: The phase I survey was repeated after an interval of 5–10 years in 106 centres in 56 countries in children aged 13–14 years (n = 304 679) and in 66 centres in 37 countries in children aged 6–7 years (n = 193 404).
Results: The mean symptom prevalence of current wheeze in the last 12 months changed slightly from 13.2% to 13.7% in the 13–14 year age group (mean increase of 0.06% per year) and from 11.1% to 11.6% in the 6–7 year age group (mean increase of 0.13% per year). There was also little change in the mean symptom prevalence of severe asthma or the symptom prevalence measured with the asthma video questionnaire. However, the time trends in asthma symptom prevalence showed different regional patterns. In Western Europe, current wheeze decreased by 0.07% per year in children aged 13–14 years but increased by 0.20% per year in children aged 6–7 years. The corresponding findings per year for the other regions in children aged 13–14 years and 6–7 years, respectively, were: Oceania (−0.39% and −0.21%); Latin America (+0.32% and +0.07%); Northern and Eastern Europe (+0.26% and +0.05%); Africa (+0.16% and +0.10%); North America (+0.12% and +0.32%); Eastern Mediterranean (−0.10% and +0.79%); Asia-Pacific (+0.07% and −0.06%); and the Indian subcontinent (+0.02% and +0.06%). There was a particularly marked reduction in current asthma symptom prevalence in English language countries (−0.51% and −0.09%). Similar patterns were observed for symptoms of severe asthma. However, the percentage of children reported to have had asthma at some time in their lives increased by 0.28% per year in the 13–14 year age group and by 0.18% per year in the 6–7 year age group.
Conclusions: These findings indicate that international differences in asthma symptom prevalence have reduced, particularly in the 13–14 year age group, with decreases in prevalence in English speaking countries and Western Europe and increases in prevalence in regions where prevalence was previously low. Although there was little change in the overall prevalence of current wheeze, the percentage of children reported to have had asthma increased significantly, possibly reflecting greater awareness of this condition and/or changes in diagnostic practice. The increases in asthma symptom prevalence in Africa, Latin America and parts of Asia indicate that the global burden of asthma is continuing to rise, but the global prevalence differences are lessening.
Statistics from Altmetric.com
The International Study of Asthma and Allergies in Childhood (ISAAC) was founded to maximise the value of epidemiological research into asthma, allergic rhinoconjunctivitis and eczema through facilitating international collaboration.1–4 Although epidemiological research has the potential to add to our understanding of these conditions, previous studies have lacked standardisation in case definition and methodology, thus limiting the value of spatial and temporal comparisons of the prevalence of these disorders. The ISAAC programme was designed to allow comparisons of the prevalence of these disorders between populations in different countries and their trends over time,1,2 since these may be particularly informative in suggesting hypotheses about the causes of the observed patterns and hence about the causes of asthma, rhinitis and eczema.
In phase I, children aged 13–14 years were studied in 155 centres in 56 countries (n = 463 801) and children aged 6–7 years were studied in 91 centres in 38 countries (n = 257 800).5–8 Up to 20-fold variations in the prevalence of “current wheeze” (in the last 12 months) were observed between centres worldwide (range 1.8–36.7%), with a sevenfold variation observed between the 10th and 90th percentiles (4.4%, 30.9%). The highest 12 month period prevalences were from centres in the UK, Australia, New Zealand and the Republic of Ireland, followed by some centres from North, Central and South America; the lowest prevalences were from centres in Eastern Europe, Albania, Greece, China, Taiwan, Uzbekistan, India, Indonesia and Ethiopia. Phase II involved more intensive investigation of possible aetiological factors in 9–11-year-old children in 30 centres in 22 countries.9
Phase III has involved repeating the phase I survey after 5–10 years to: (1) examine time trends in the prevalence of asthma, allergic rhinoconjunctivitis and eczema in centres and countries which participated in phase I; (2) describe the prevalence and severity of asthma, allergic rhinoconjunctivitis and eczema in centres and countries which are of interest but did not participate in phase I; and (3) examine hypotheses at an individual level which have been suggested by the findings of phase I, subsequent ecological analyses and recent advances in knowledge. An overview of the findings for time trends for symptoms of all three conditions in those centres that participated in both phase I and phase III (ie, objective (1) above) has been presented in a previous publication.10 That publication only included the findings for “current wheeze”, whereas the current paper uses each of the seven ISAAC questions to describe the detailed findings for time trends in the prevalence of asthma symptoms.
METHODS
Phase III was conducted following as precisely as possible the methods used in phase I.2,3 It included two groups of centres: (1) Group A are centres that previously completed phase I according to the ISAAC phase I protocol, including centres for which the phase I data were submitted too late for inclusion in the first worldwide publications but were of the required standard; (2) Group B are centres from around the world that did not participate in phase I but participated in phase III as new centres. The analysis of time trends presented here is necessarily confined to the Group A centres, and we will therefore focus on them in describing the methods.
Group A centres were required to conduct phase III in the same way as phase I following, as precisely as possible, the details of the centre methodology documented in the phase I centre report. Each principal investigator was sent a final copy of the phase I centre report from the ISAAC International Data Centre (IIDC). They were then required to use the same sampling frame (the exact same set of schools was not aimed for but some schools were reselected by the random sampling process), age groups, sample size, method of choosing the children, the same symptom questionnaires (plus an environmental module), the same translations (if applicable) and the same time of year for data collection. Thus, as in phase I, the written questionnaire and video questionnaires were self-completed in the 13–14 year age group whereas the written questionnaire was completed by a parent for children in the 6–7 year age group.
The Steering Committee required documentation of the procedures for the study from each centre as a prerequisite for inclusion in publications of ISAAC worldwide results. Centres completed a registration document before starting the study and followed the published ISAAC phase III manual and ISAAC coding and data transfer manual. The phase III data and centre report submitted to the IIDC were checked for coding errors, omissions and inconsistencies and these were corrected with the assistance of the collaborator.
As in phase I, the 6–7 year and 13–14 year age groups were analysed separately. Symptom prevalences in each centre were calculated by dividing the number of positive responses to each question by the number of completed questionnaires for the written and video questionnaires separately. Thus, apparent inconsistencies between responses to the stem and branch questions were accepted and not recoded. For each centre the annual change in symptom prevalence was calculated by taking the difference between the phase I and phase III prevalences and dividing by the number of years between the two surveys.
The findings for the question on “current wheeze” have previously been published10 but are also included in the current paper, together with the findings for the other asthma symptom questions, in order that the findings and patterns for current wheeze, severe asthma symptoms and diagnosed asthma can be compared and contrasted.
The data are presented in tabular form with the phase III prevalence and the annual change in prevalence for each question. For the regional and global summaries, the data for each centre were weighted by the inverse of the variance of the change. The regional analyses were based on the standard ISAAC regions, but we also performed analyses specifically for English language countries (Australia, Canada, Channel Islands, Isle of Man, New Zealand, Republic of Ireland, UK, USA). The findings were generally very similar in males and females; for example, the global change in the prevalence of “current wheeze” in children aged 13–14 years was 0.05% per year in males and 0.07% per year in females, and males and females also showed similar time trends in most regions. We have therefore presented only the overall findings (both sexes combined). The key findings were also presented as “ranking plots” showing the change in prevalence of a symptom (such as current wheeze) for each centre by country, with countries ordered by their mean prevalence (for all centres combined) across phase I and phase III. The mean prevalence (rather than the phase I prevalence) was used to order countries since this is statistically independent from the change in prevalence (between phases I and III) whereas the phase I prevalence is not.11–13 The ranking plot also shows the confidence interval about zero change for a given level of prevalence (ie, the mean prevalence across phases I and III), given a sample size of 3000 and assuming no cluster sampling effect.
RESULTS
Participants
The details of the participating centres are listed in a separate phase III overview paper.10 Phase I involved 155 collaborating centres in 56 countries for the 13–14 year age group with a total of 463 801 participating children. The video questionnaire was completed in 99 collaborating centres in 42 countries with a total of 304 796 children. For children aged 6–7 years there were 91 collaborating centres in 38 countries with a total of 257 800 participating children. Of the centres that participated in phase I, 106 centres in 56 countries completed the phase III survey and met the requirements for analysis, with a total of 304 679 participating children in the 13–14 year age group (overall response rate 91%);10 54 centres in 32 countries (a total of 167 513 children) also completed the video questionnaires in this age group. Sixty-six centres in 37 countries, a total of 193 404 children (response rate 85%)10 completed the survey and met the requirements for analysis in the 6–7 year age group. Four of the centres only did the survey in children aged 6–7 years so, in total, there were 110 centres (in either age group) in 58 countries.
13–14 year age group
Written questionnaires
The changes from phase I for symptoms of asthma (with the phase III prevalence rates in parentheses) in 13–14-year-old children are summarised by region in table 1 (the detailed findings by centre and country are summarised in web table 1 available online at http://thorax.bmj.com/supplemental). The mean prevalence of “current wheeze” (“Have you had wheezing or whistling in your chest in the past 12 months?) increased only slightly from 13.2% to 13.7% (a mean increase of 0.06% per year). There was also little change in the mean prevalence of symptoms of severe asthma. However, the changes in asthma symptom prevalence showed different regional patterns with current wheeze decreasing in those regions such as Oceania (−0.39% per year) that had previously shown the highest rates; there was a particularly marked reduction in the prevalence in English language countries (−0.51% per year). In Latin America, which had also previously shown relatively high rates, the prevalence increased (+0.32% per year). It also increased in regions such as Northern and Eastern Europe (+0.26% per year), Africa (+0.16% per year) and North America (+0.12% per year). There was little change in the Asia-Pacific region (+0.07% per year) and the Indian subcontinent (+0.02% per year), and a small decrease in the Eastern Mediterranean (−0.10% per year) and Western Europe (−0.07% per year).
Summary regional and global estimates for changes in the prevalence of self-reported asthma symptoms (written questionnaire) between phase I and phase III: percentage change in symptom prevalence per year (and phase III symptom prevalence percentage)
Figure 1 gives the ranking plot showing the change in prevalence of current wheeze for each centre by country, with countries ordered by their average prevalence (for all centres combined) across phase I and phase III. It shows that, in general, the countries with the highest prevalence in phase I (including most of the English language countries) showed decreases in prevalence between phase I and phase III, whereas some of the countries which had previously had low prevalence showed increases. However, there were a number of countries (eg, India, Albania) which had very low prevalence in phase I and little increase in phase III.
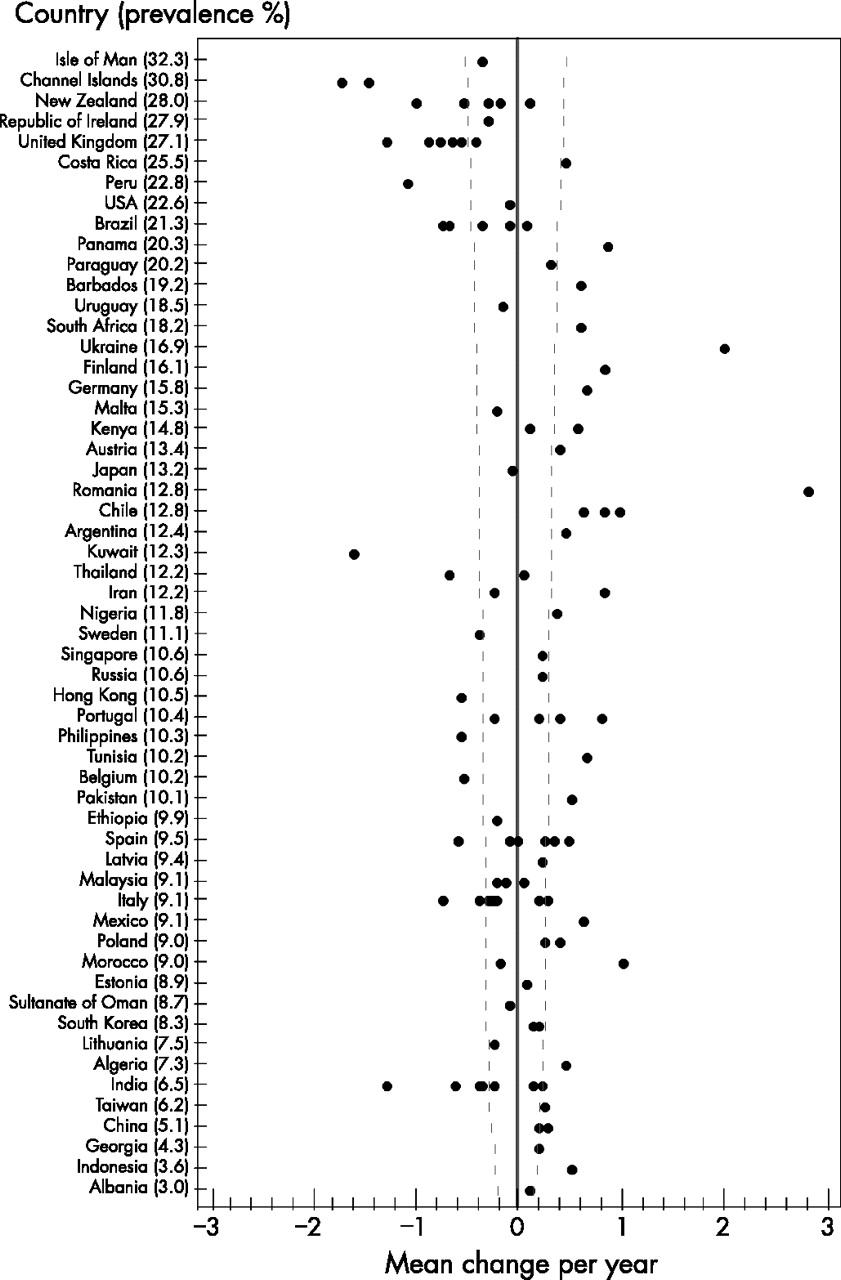
Ranking plot showing the change per year in prevalence of current wheeze (wheeze in the past 12 months) in children aged 13–14 years for each centre by country, with countries ordered by their mean prevalence (for all centres combined) across phase I and phase III. The plot also shows the confidence interval about zero change for a given level of prevalence (ie, the mean prevalence across phases I and III) given a sample size of 3000 and no cluster sampling effect.
Figure 2 shows the corresponding ranking plot for severe asthma, as measured by ⩾4 attacks of wheezing in the previous 12 months. It generally shows similar patterns to those for current wheeze, with decreases in prevalence in English language countries and increases in prevalence in some, but not all, of the countries that had low prevalence in phase I.

Ranking plot showing the change per year in prevalence of ⩾4 attacks of wheezing in the previous 12 months in children aged 13–14 years for each centre by country, with countries ordered by their average prevalence (for all centres combined) across phase I and phase III. The plot also shows the confidence interval about zero change for a given level of prevalence (ie, the mean prevalence across phases I and III) given a sample size of 3000 and no cluster sampling effect.
In contrast to the findings for current wheeze, the percentage of children reported to have had asthma at some time in their lives increased from 11.2% to 13.8% in the 13–14 year age group, an annual increase of 0.28% per year (table 1 and fig 3). There were particularly large increases in Oceania (+0.93% per year), Western Europe (+0.33% per year) and North America (+0.71% per year), despite the fact that these regions showed little change (or even a reduction) in symptom prevalence. The average proportion of children with “current wheeze” who were reported to have had asthma at some time in their lives increased only from 43% to 46%, but there were larger increases in Oceania (54% to 64%), Western Europe (45% to 51%) and North America (55% to 61%).

Ranking plot showing the change per year in the lifetime prevalence of asthma (“asthma ever”) in children aged 13–14 years for each centre by country, with countries ordered by their mean prevalence (for all centres combined) across phase I and phase III. The plot also shows the confidence interval about zero change for a given level of prevalence (ie, the mean prevalence across phases I and III) given a sample size of 3000 and no cluster sampling effect.
Video questionnaire
Table 2 summarises the findings in children aged 13–14 years using the video questionnaire by region (the detailed findings by centre and country are summarised in web table 2 available online at http://thorax.bmj.com/supplemental) and fig 4 gives the corresponding ranking plot. The mean prevalence of current wheeze decreased slightly from 8.1% to 7.9%. However, the changes in asthma prevalence showed different regional patterns with current wheeze showing no change in Western Europe but a marked decrease in Oceania (−0.76% per year). It also showed little change in the Eastern Mediterranean (−0.05% per year) and Latin America (−0.04% per year), Western Europe (0.00% per year) and Northern and Eastern Europe (0.03% per year). There were increases in the Indian subcontinent (+0.32% per year), Africa (+0.33% per year) and Asia-Pacific (+0.11% per year), and a decrease in North America (−0.26% per year). Thus, the video questionnaire findings for current wheeze were generally similar to those with the written questionnaire for Africa, Oceania, Asia-Pacific, Western Europe and Eastern Mediterranean. On the other hand, Latin America and Northern and Eastern Europe showed an increase with the written questionnaire but little change with the video questionnaire, the Indian subcontinent showed little change with the written questionnaire and an increase with the video questionnaire, and North America showed an increase with the written questionnaire but a decrease with the video questionnaire.
Summary regional and global changes in the prevalence of self-reported asthma symptoms (video questionnaire) between phase I and phase III in 13–14-year-old children: percentage change in symptom prevalence per year (and phase III symptom prevalence perentage)
Ranking plot showing the change per year in prevalence of current wheeze (wheeze in the past 12 months) using the video questionnaire in children aged 13–14 years for each centre by country, with countries ordered by their mean prevalence (for all centres combined) across phase I and phase III. The plot also shows the confidence interval about zero change for a given level of prevalence (ie, the mean prevalence across phases I and III) given a sample size of 3000 and no cluster sampling effect.
6–7 year age group
The changes in prevalence from phase I (with the phase III prevalence rates in parentheses) in children aged 6–7 years are summarised by region in table 1 (the detailed findings by centre and country are summarised in web table 3 available online at http://thorax.bmj.com/supplemental). The mean prevalence of wheeze in the last 12 months (current wheeze) increased only slightly from 11.1% to 11.6% (a mean increase of 0.13% per year). There was also little change in the mean prevalence of severe asthma. However, the changes in asthma symptom prevalence showed different regional patterns with current wheeze increasing in Western Europe (+0.20% per year) and decreasing in Oceania (−0.21% per year), both of which had previously shown high rates. Prevalence increased in Latin America (+0.07% per year) which had also previously shown relatively high rates, and in North America (+0.32% per year). It also increased in the Eastern Mediterranean (+0.79% per year) and Africa (+0.10% per year) which had previously shown some of the lowest rates, while there was little change in Asia-Pacific (−0.06% per year), Northern and Eastern Europe (+0.05% per year) or the Indian subcontinent (+0.06% per year). Thus, the patterns in the 6–7 year age group were not completely consistent with those in the 13–14 year age group. There were increases in both age groups in Latin America, North America, Northern and Eastern Europe and Africa, and decreases in both age groups in Oceania. However, there were different patterns in the two age groups in Western Europe and the Eastern Mediterranean (decreases for 13–14-year-old children but increases for 6–7-year-old children).
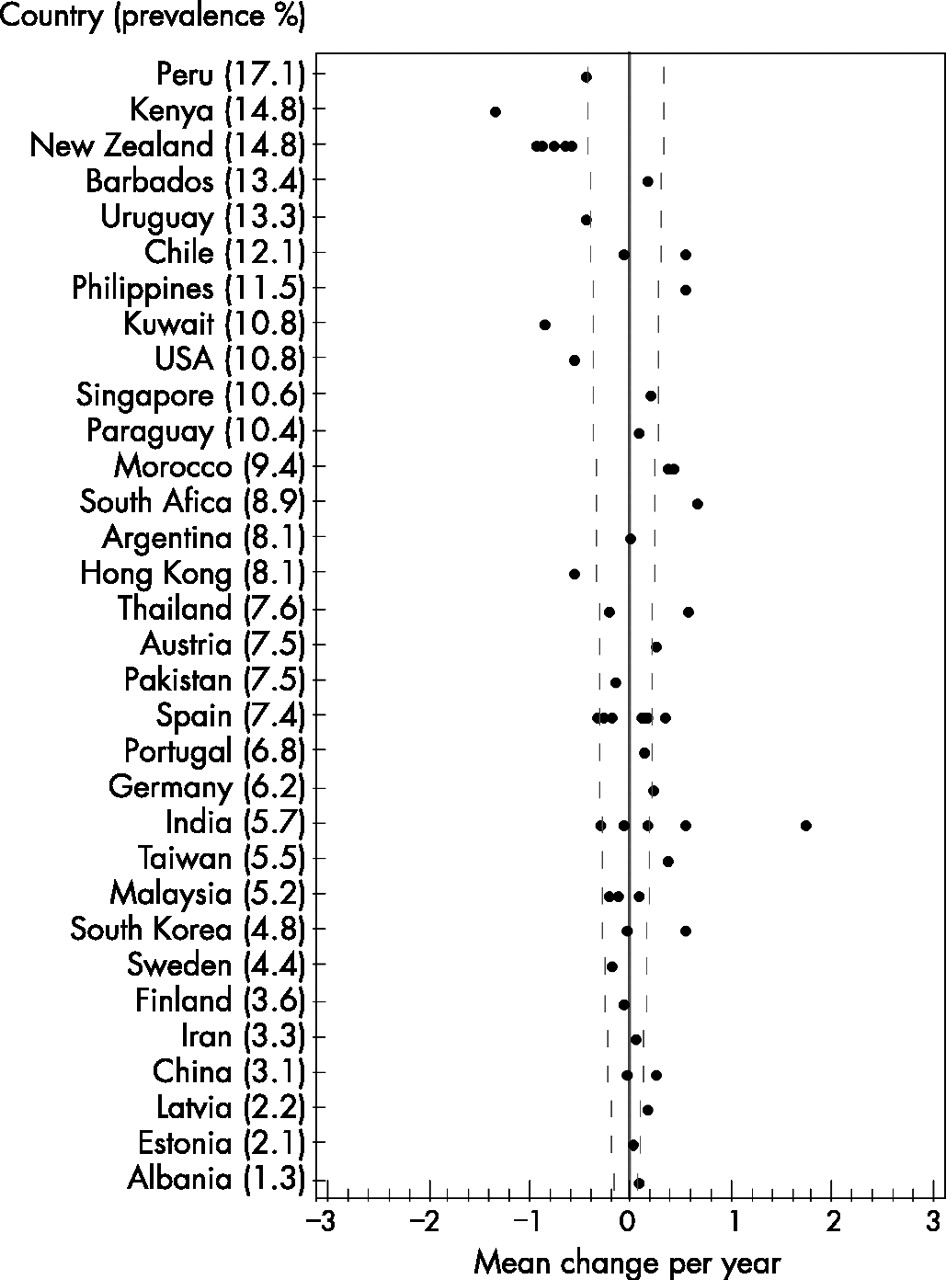
Figure 5 shows the ranking plot for children aged 6–7 years showing the change in prevalence of current wheeze for each centre by country, with countries ordered by their mean prevalence (for all centres combined) across phase I and phase III. As in the 13–14 year age group, it shows that in general the countries with the highest prevalence in phase I (including most of the English language countries) showed decreases in prevalence between phase I and phase III, whereas some of the countries which had previously had low prevalence showed increases.

Ranking plot showing the change per year in the prevalence of current wheeze (wheeze in the past 12 months) in children aged 6–7 years for each centre by country, with countries ordered by their mean prevalence (for all centres combined) across phase I and phase III. The plot also shows the confidence interval about zero change for a given level of prevalence (ie, the mean prevalence across phases I and III) given a sample size of 3000 and no cluster sampling effect.
Figure 6 gives the corresponding ranking plot in children aged 6–7 years for severe asthma, as measured by ⩾4 attacks of wheezing in the previous 12 months. It generally shows similar patterns to those for current wheeze, with decreases in prevalence in English language countries and increases in prevalence in some, but not all, of the countries that had a low prevalence in phase I.

Ranking plot showing the change per year in prevalence of ⩾4 attacks of wheezing in the previous 12 months in children aged 6–7 years for each centre by country, with countries ordered by their mean prevalence (for all centres combined) across phase I and phase III. The plot also shows the confidence interval about zero change for a given level of prevalence (ie, the mean prevalence across phases I and III) given a sample size of 3000 and no cluster sampling effect.
As for the children in the 13–14 year age group, the percentage of children aged 6–7 years reported to have had asthma at some time in their lives increased between phase I and phase III (table 1 and fig 7). There were particularly large increases in Oceania (+0.42% per year), Western Europe (+0.25% per year) and North America (+0.74% per year), despite the fact that these regions showed little change (or even a reduction) in symptom prevalence.

Ranking plot showing the change per year in the lifetime prevalence of asthma (“asthma ever”) in children aged 6–7 years for each centre by country, with countries ordered by their mean prevalence (for all centres combined) across phase I and phase III. The plot also shows the confidence interval about zero change for a given level of prevalence (ie, the mean prevalence across phases I and III) given a sample size of 3000 and no cluster sampling effect.
DISCUSSION
Phase I of ISAAC was a unique initiative involving genuinely worldwide involvement in research into the patterns and causes of asthma.3 It represented by far the most extensive international survey of asthma symptom prevalence ever performed.5 The only other comparable international survey of asthma is the European Community Respiratory Health Survey (ECRHS)14 which studied adults (20–44 years) mainly from European centres, and generally yielded similar findings to those of ISAAC.15 The key findings included the high prevalence of reported asthma symptoms in English language countries, the high symptom prevalence in Latin America, the relatively high prevalences in Western Europe but much lower prevalences in Eastern Europe with a clear Northwest-Southeast gradient, and the relatively low prevalences in Africa and Asia with the exception of the more affluent countries such as Singapore and Japan.
The ISAAC phase I methodology was simple, the protocol was rigorously applied, and a number of validation studies had indicated that the ISAAC core questions on wheezing had acceptable sensitivity and specificity when compared with other indicators of asthma including physician diagnosis, other questionnaires and physiological measures.10 Nevertheless, the possibility could not be excluded that some of the patterns observed could be due to issues of translation of terms such as “wheezing” or to differences in recognition and labelling of symptoms.10 These issues are of less concern in the current study since the focus is on time trends, and the same methodology (including the same translations) has been used in the same centres at different times.
Nevertheless, it is possible that recognition and labelling of asthma symptoms may have shown different time trends in different geographical regions, and may account in part for the trends reported here. In this regard, it is of concern that some regions showed different time trends with the written and video questionnaires, although the differences were not consistent: Latin America and Northern and Eastern Europe showed an increase with the written questionnaire but little change with the video questionnaire; the Indian subcontinent showed little change with the written questionnaire and an increase with the video questionnaire; and North America showed an increase with the written questionnaire but a decrease with the video questionnaire.
Increased use of effective treatment, especially inhaled corticosteroids, is likely to have reduced asthma severity but is unlikely to eliminate asthma symptoms completely, and is therefore unlikely to explain the changes in prevalence.16,17
When assessing time trends in centres that had previously shown high or low prevalences (figs 1–7), we avoided the possibility of regression to the mean by using the mean prevalence when assessing the change between phases I and III,10 whereas a plot of changes relative to the phase I prevalences would have shown spurious correlations even when no such associations existed.11
Appropriate quality control measures are a critical component of any multicentre research collaboration and this is particularly true of ISAAC, given the unique global scope of the collaboration and the wide variation in the research experience of the collaborators. The extensive quality control measures adopted for ISAAC phase III are described in detail elsewhere,2 but the possibility that inappropriate implementation of the study design may have introduced bias in the results from individual centres should be acknowledged. However, it is extremely unlikely that any such bias would affect the broader regional and global patterns presented in this publication.
It should also be stressed that prevalence and time trend data such as this primarily serve for purposes of hypothesis generation rather than hypothesis testing. Furthermore, with more than 100 centres involved, it is to be expected that at least five centres would show statistically significant changes by chance alone. It is therefore more valuable to focus on the regional and global patterns and trends than on the findings in individual centres.
Bearing these reservations in mind, the findings reported here are of considerable interest. First, they show that in most high prevalence countries, particularly the English language countries, the rise in the prevalence of asthma symptoms has peaked and may even have begun to decline. This is consistent with the findings of other recent studies in children18–24 and in adults.25,26 There are some exceptions to this trend but, of the European and English language countries which showed a relatively high prevalence in phase I, only Germany27 and Finland have shown significant increases in symptom prevalence in phase III. The increases for North America are due to increases in Barbados (where the phase I data were too late for inclusion in the phase I paper5); the one US centre showed a small decline in symptom prevalence consistent with the findings for other English language countries.
Second, a number of countries that had high or intermediate levels of symptom prevalence in phase I have shown significant increases in prevalence in phase III; these include Latin American countries such as Costa Rica, Panama, Mexico, Argentina and Chile, and Eastern European countries such as the Ukraine and Romania. Other countries to show significant increases in symptom prevalence included Barbados, Tunisia, Morocco and Algeria.
Third, with the exception of India, all of the countries with very low symptom prevalence rates in phase I reported increases in prevalence in phase III, although only the increases for Indonesia and China were statistically significant.
Finally, virtually all countries—irrespective of the level of symptom prevalence—reported increases in lifetime asthma prevalence between phases I and III. In fact, the increases were most marked in those countries with the highest mean prevalence between phase I and phase III (figs 3 and 7), despite the fact that many of these countries reported declines in the prevalence of asthma symptoms between phase I and phase III (figs 1 and 4).
So what do these findings mean? Perhaps the most striking finding is the apparent decline in symptom prevalence in English language countries. Just as we do not (yet) know why prevalence has increased since the 1950s, we do not know why it should now be decreasing.16 The “hygiene hypothesis” has been proposed as one explanation for the increases in symptom prevalence, although it does not appear entirely to account for the time trends since the increases have occurred for both non-atopic (non-eosinophilic) and atopic (eosinophilic) asthma, whereas the hygiene hypothesis would only explain (at most) trends for atopic asthma.28 Furthermore, it does not seem apparent that the English language countries have become “less hygienic” in recent decades, although increases in infant and childhood infections could have occurred due to specific factors such as increased use of childcare facilities.29 The hygiene hypothesis is also unlikely to explain the considerably higher prevalences in many Latin American countries than in Spain and Portugal which are more consistent with changes in environmental exposures other than hygiene.30–32
Other “established” asthma risk factors do not appear to explain the worldwide asthma prevalence patterns33–42 or time trends, particularly the decline in English language countries. It also seems unlikely that the decline in symptom prevalence is due to decreased recognition and labelling of asthma symptoms, given that the prevalence of “asthma ever” has increased. For example, García-Marcos et al43 argue that asthma is now considered a less stigmatising disease than it was at the time of phase I, and the word “asthma” is more readily accepted. This could explain why, in some countries, symptom prevalence has not increased or has even declined, but the prevalence of “asthma ever” has increased. This has occurred particularly in English language countries and may also in part reflect international differences in healthcare systems, as well as more specific differences in asthma recognition and diagnosis. It should also be noted that the findings for “asthma ever” are to some extent reassuring with regard to the findings for current asthma symptoms, since they indicate that an increased recognition and diagnosis of asthma has not been accompanied by an increase in reporting of asthma symptoms; such an increase would have been expected if the symptom prevalence patterns were entirely due to differences in recognition and labelling of symptoms.
These findings for English language countries and Western Europe are intriguing and to some extent reassuring, but they should not be taken to indicate that the global “pandemic” of asthma is easing and that the worst is over. The phase III findings show striking increases for Latin American countries to the extent that, in future, we may be describing asthma as a “Spanish and Portuguese speaking” rather than an “English speaking” disease. The modest increases for China are of potentially major significance given the size of China’s population and its rapid economic growth. Furthermore, there are some intriguing patterns with, for example, decreases in prevalence in India but modest increases in China, Indonesia, Taiwan and South Korea, and stronger increases in Morocco, Algeria and Tunisia. As with the phase I findings, it is to be hoped that this new evidence on time trends will lead to further questioning and testing of current theories, and the development of new theories of asthma aetiology. In addition, these findings suggest that, although asthma symptom prevalence is no longer increasing in most English language and Western European countries, its global burden may continue to rise.
APPENDIX: ISAAC PHASE III STUDY GROUP
ISAAC Steering Committee: N Aït-Khaled* (Union Internationale Contre la Tuberculose et les Maladies Respiratoires, Paris, France), H R Anderson (Department of Public Health Sciences, St Georges Hospital Medical School, London, UK), M I Asher (Department of Paediatrics, Faculty of Medical and Health Sciences, The University of Auckland, New Zealand), R Beasley* (Medical Research Institute of New Zealand, Wellington, New Zealand), B Björkstén* (Institute of Environmental Medicine, Karolinska Institutet, Stockholm, Sweden), B Brunekreef (Institute of Risk Assessment Science, Universiteit Utrecht, Netherlands), W Cookson (Asthma Genetics Group, Wellcome Trust Centre for Human Genetics, University of Oxford, UK), J Crane (Wellington Asthma Research Group, Wellington School of Medicine, New Zealand), P Ellwood (Department of Paediatrics, Faculty of Medical and Health Sciences, The University of Auckland, New Zealand), S Foliaki* (Centre for Public Health Research, Massey University, Wellington, New Zealand), U Keil* (Institut für Epidemiologie und Sozialmedizin, Universität Münster, Germany), C K W Lai* (Department of Medicine and Therapeutics, The Chinese University of Hong Kong, SAR China), J Mallol* (Department of Respiratory Medicine, University of Santiago de Chile, Chile), C F Robertson (Department of Respiratory Medicine, Royal Children’s Hospital, Parkville, Australia), E A Mitchell (Department of Paediatrics, Faculty of Medical and Health Sciences, The University of Auckland, New Zealand), S Montefort* (“Belvedere”, Naxxor, Malta), J Odhiambo* (Centre Respiratory Diseases Research Unit, Kenya Medical Research Institute, Nairobi, Kenya), N Pearce (Centre for Public Health Research, Massey University, Wellington, New Zealand), J Shah* (Jaslok Hospital & Research Centre, Mumbai, India), A W Stewart (Population Health, Faculty of Medical and Health Sciences, The University of Auckland, New Zealand), D Strachan (Department of Public Health Sciences, St Georges Hospital Medical School, London, UK), E von Mutius (Dr von Haunerschen Kinderklinik de Universität München, Germany), S K Weiland (Department of Epidemiology, University of Ulm, Germany), H Williams (Centre for Evidence Based Dermatology, Queen’s Medical Centre, University Hospital, Nottingham, UK).
ISAAC International Data Centre: M I Asher, T O Clayton, P Ellwood, T Milne, E A Mitchell, Department of Paediatrics, and AW Stewart, School of Population Health, Faculty of Medical and Health Sciences, The University of Auckland, New Zealand.
ISAAC Phase III National Coordinators: L Ng’ang’a (Kenya), H J Zar (South Africa), Z Bouayad (Morocco), Y-Z Chen (China), C Lai (SAR China), J Shah (India), K Baratawidjaja (Indonesia), S Nishima (Japan), J de Bruyne (Malaysia), F Cua-Lim (Philippines), B-W Lee (Singapore), H-B Lee (South Korea), J-L Huang (Taiwan), P Vichyanond (Thailand), M-R Masjedi (Iran), S Montefort (Malta), N Mahmood (Pakistan), O Al-Rawas (Sultanate of Oman), C E Baena-Cagnani (Argentina), D Solé (Brazil), V Aguirre (Chile), M E Soto-Quirós (Costa Rica), M Baeza-Bacab (Mexico), P Chiarella (Peru), D Holgado (Uruguay), M E Howitt (Barbados), A Priftanji (Albania), M-A Riikjärv (Estonia), J Pekkanen (Finland), M Gotua (Georgia), J Bojarskas (Lithuania), G Lis (Poland), V Ognev (Ukraine), C F Robertson (Australia), M I Asher (New Zealand), G Haidinger (Austria), U Keil (Germany), F Forastiere (Italy), J E Rosado Pinto (Portugal), L García-Marcos (Spain), H R Anderson (UK), P Manning (Republic of Ireland), L Nilsson (Sweden).
ISAAC Phase III Principal Investigators: K Melaku (Ethiopia), F O Esamai, L Ng’ang’a (Kenya), B O Onadeko (Nigeria), H J Zar (South Africa), B Benhabylès (Algeria), Z Bouayad (Morocco), M Jerray (Tunisia), Y-Z Chen, N-S Zhong (China), Y L Lau, G Wong (SAR China), CB Kartasasmita (Indonesia), H Odajima (Japan), KH Teh, J de Bruyne, BS Quah (Malaysia), F Cua-Lim (Philippines), D Y T Goh (Singapore), H-B Lee (South Korea), J-L Huang (Taiwan), P Vichyanond, M Trakultivakorn (Thailand), M-R Masjedi (Iran), J L al-Momen (Kuwait), S Montefort (Malta), N Mahmood (Pakistan), O Al-Rawas (Sultanate of Oman), MK Joshi, V A Khatav, L Kumar, G Setty, K C Jain, T U Sukumaran, S K Sharma, N M Hanumante, AV Pherwani (India), C E Baena-Cagnani (Argentina), N Rosário, G B Fischer, M de Britto, L de Freitas Souza, D Solé (Brazil), L Amarales, P Aguilar, M A Calvo (Chile), M E Soto-Quirós (Costa Rica), I Romieu (Mexico), G Cukier (Panama), J A Guggiari-Chase (Paraguay), P Chiarella (Peru), D Holgado (Uruguay), M E Howitt (Barbados), D Rennie, MR Sears (Canada), G J Redding (USA), A Priftanji (Albania), M-A Riikjärv (Estonia), J Pekkanen (Finland), M Gotua (Georgia), V Svabe (Latvia), J Kudzyte (Lithuania), E G Kondiourina (Russia), G Lis, A Breborowicz (Poland), D Dumitrascu (Romania), H Vogt (Sweden), V Ognev (Ukraine), C F Robertson (Australia), M I Asher, C Moyes, P Pattemore, R Mackay, N Pearce (New Zealand), G Haidinger (Austria), J Weyler (Belgium), P Standring, R Goulding (Channel Islands), U Keil (Germany), A Steriu (Isle of Man), E Bonci, C Galassi, MG Petronio, E Chellini, L Bisanti, F Forastiere, P Sestini, G Ciccone, S Piffer (Italy), R Camâra, J E Rosado Pinto, C Nunes, J M Lopes dos Santos (Portugal), L Clancy (Republic of Ireland), R M Busquets, C González Díaz, L García-Marcos, A Arnedo-Pena, G Garcia Hernández, F Guillén-Grima, M Morales Suarez-Varela, A Blanco Quirós (Spain), H R Anderson, J B Austin, MH Shamssain, D Strachan, M Burr (UK).
Acknowledgments
The authors are grateful to the children and parents who willingly cooperated and participated in ISAAC phases I and III, and the coordination and assistance by the school staff is sincerely appreciated. The authors thank the phase I principal investigators and the phase III principal investigators and their colleagues who helped make ISAAC phase III such a success, and Tadd Clayton and Soo Cheng for their work on data management and data analysis.
REFERENCES
Supplementary materials
Files in this Data Supplement:
Footnotes
-
↵* Regional Coordinators.
-
Published Online First 15 May 2007
-
The authors acknowledge and thank the many funding bodies throughout the world that supported the individual ISAAC centres and collaborators and their meetings. In particular, they thank the New Zealand funding bodies (the Health Research Council of New Zealand, the Asthma and Respiratory Foundation of New Zealand, the Child Health Research Foundation, the Hawke’s Bay Medical Research Foundation, the Waikato Medical Research Foundation, Glaxo Wellcome New Zealand, the NZ Lottery Board and Astra Zeneca New Zealand.) Glaxo Wellcome International Medical Affairs supported the regional coordination and the ISAAC International Data Centre. Without help from all of the above, ISAAC would not have been such a global success. The Centre for Public Health Research is supported by a programme grant from the Health Research Council of New Zealand, and Neil Pearce’s work on this project was also supported by the Progetto Lagrange, Fondazione CRT/ISI.
-
Competing interests: None.
Linked Articles
- Airwaves