Article Text

Abstract
Background: The pattern of volatile organic compounds (VOCs) in the exhaled breath of patients with lung cancer may be unique. New sensor systems that detect patterns of VOCs have been developed. One of these sensor systems, a colorimetric sensor array, has 36 spots composed of different chemically sensitive compounds impregnated on a disposable cartridge. The colours of these spots change based on the chemicals with which they come into contact. In this proof of principle study, the ability of this sensor system to detect a pattern of VOCs unique to lung cancer is assessed.
Methods: Individuals with lung cancer, those with other lung diseases and healthy controls performed tidal breathing of room air for 12 min while exhaling into a device designed to draw their breath across a colorimetric sensor array. The colour changes that occurred for each individual were converted into a numerical vector. The vectors were analysed statistically, using a random forests technique, to determine whether lung cancer could be predicted from the responses of the sensor.
Results: 143 individuals participated in the study: 49 with non-small cell lung cancer, 18 with chronic obstructive pulmonary disease 15 with idiopathic pulmonary fibrosis 20 with pulmonary arterial hypertension 20 with sarcoidosis and 21 controls. A prediction model was developed using observations from 70% of the subjects. This model was able to predict the presence of lung cancer in the remaining 30% of subjects with a sensitivity of 73.3% and a specificity of 72.4% (p = 0.01).
Conclusions: The unique chemical signature of the breath of patients with lung cancer can be detected with moderate accuracy by a colorimetric sensor array.
Statistics from Altmetric.com
There are many challenges in the diagnosis of lung cancer. Lung cancer is often silent early in its course. When symptoms occur they are usually non-specific.1 Thus, most lung cancer is diagnosed at an advanced stage when treatment is less successful.2 Diagnosis relies on expensive, non-invasive and invasive testing with the potential for complications. Screening programmes are yet to lead to a reduction in lung cancer-specific mortality or overall mortality.3,4 Advances in imaging are uncovering many small lung nodules requiring serial testing.5 For all these reasons, an accurate, inexpensive, non-invasive test would be a welcome addition to our current diagnostic tools.
Metabolic changes within cancer cells can lead to changes in the production and processing of volatile organic compounds (VOCs).6,7 A pattern of VOCs unique to lung cancer may be detected in samples of exhaled breath. Studies have evaluated the ability of gas chromatography and mass spectroscopy (GC–MS) to identify unique patterns of VOCs in the breath of individuals with lung cancer.8,9,10,11,12,13,14 The results have supported the promise of this line of investigation. GC–MS systems are expensive and require expert interpretation. They are difficult to use as a point-of-care test. An easier to use method of detecting unique patterns of VOCs would permit the broader application of breath testing for the diagnosis of lung cancer.
Gaseous chemical sensing and identification devices have been developed that are able to detect a single (or patterns of) odorant molecule(s) such as VOCs. The premise with most of these devices is that absorption of gases onto the sensor system causes a change in the conductivity, mass, vibration or colour of the sensor, thus altering its output. A colorimetric sensor array is one type of chemical sensor. This sensor has a group of spots composed of different chemically sensitive compounds (eg, metalloporphyrins) impregnated on a disposable cartridge (fig 1). The colours of these spots change based on the chemicals with which they come into contact (fig 2).
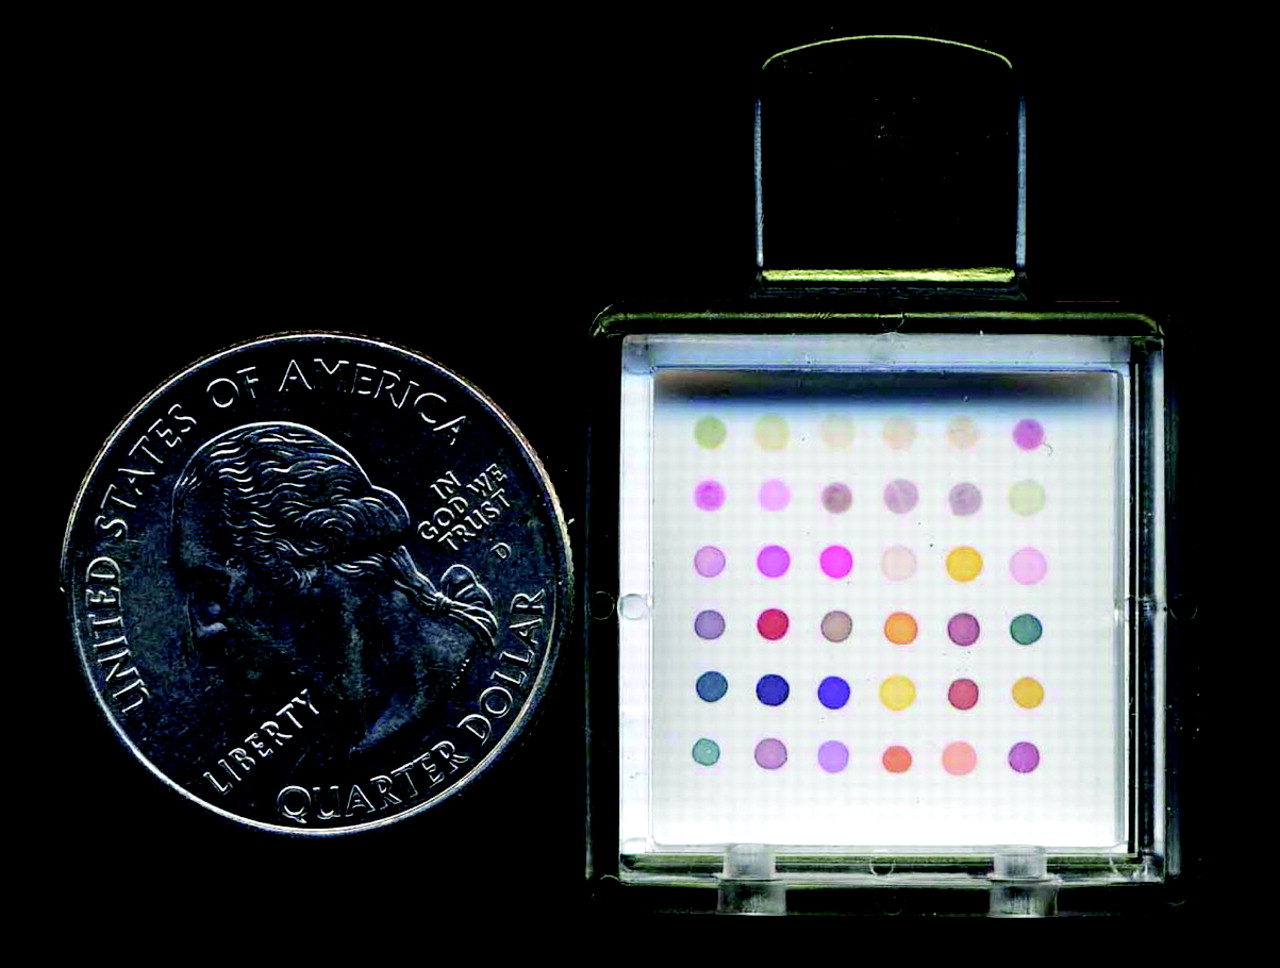
The colorimetric sensor array used in this study consists of 36 chemically sensitive dots impregnated on a disposable cartridge.

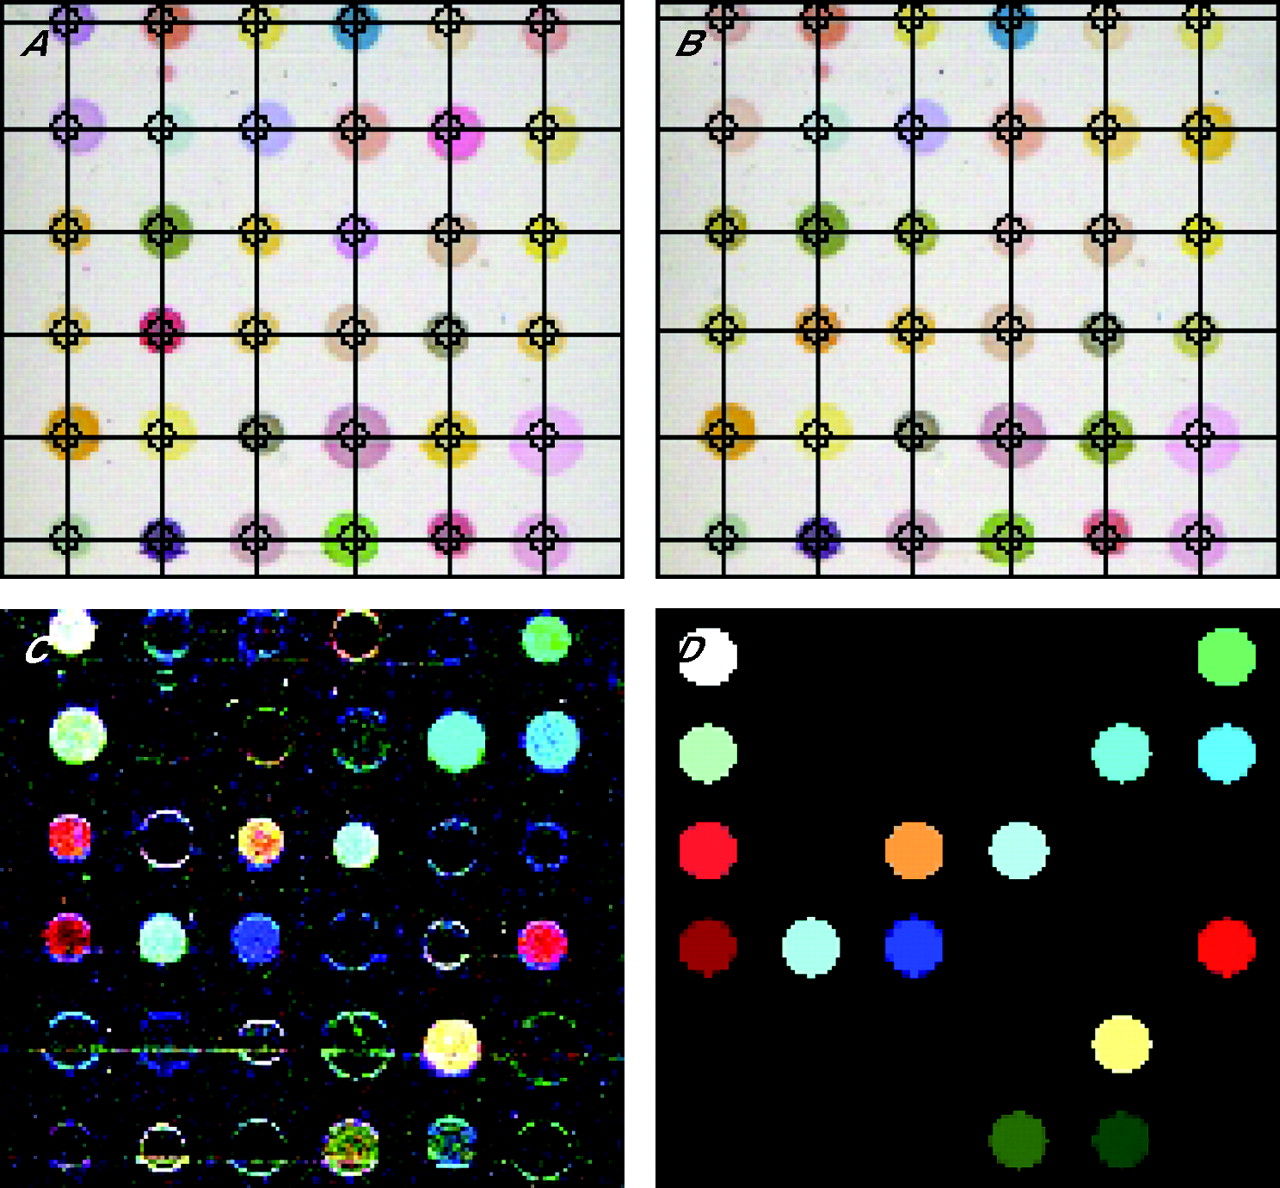
The scanner images the sensor array at baseline (A) and after being exposed to a chemical sample such as exhaled breath (B). The difference in the colors from time A to B is pictured in panel (C). (D) Cleaned-up version of panel C.
We hypothesised that a colorimetric sensor array would be able to detect the unique pattern of VOCs from the breath of patients with lung cancer.
METHODS
Subjects
We enrolled subjects with non-small cell lung cancer regardless of stage of the disease. In addition, controls with disease and healthy control subjects were included in the study. The controls with disease included subjects with chronic obstructive pulmonary disease (COPD), sarcoidosis, pulmonary arterial hypertension (PAH) and idiopathic pulmonary fibrosis (IPF). The patients with COPD were required to meet the Global Initiative for Chronic Obstructive Lung Disease criteria for at least mild COPD.15 The patients with sarcoidosis were either clinically or pathologically diagnosed. The patients with PAH were diagnosed by right-heart catheterisation. Primary and secondary aetiologies were included. The patients with IPF had disease proven clinically or by biopsy. There were no restrictions for participation based on treatment of any of the controls with disease. The healthy controls were ⩾18 years of age, without known lung conditions and free of active cardiopulmonary symptoms. They included smokers and non-smokers. Finally, individuals with indeterminate lung nodules, ⩽30 mm in maximal diameter, were asked to participate. The nodules were determined to be cancer when proven by biopsy. They were classified as benign if a specific benign diagnosis was found on biopsy or they were followed-up for 2 years without evidence of growth on imaging.
Breath collection
Each study subject performed tidal breathing of unfiltered room air for a total of 12 min. During this time, they inhaled through their nose and exhaled through their mouth into the breath collection device. The exhaled breath was drawn over the sensor array by a pump at approximately 250 ml/min. The sensor array was held in place on a flat-bed scanner. The system was contained in an incubator set to keep the exhaled breath at body temperature. At the end of the 12 min breath collection, all tubing and the sensor array were changed and a sample of room air was drawn across the system for another 12 min.
Breath analysis
Each colorimetric sensor array contained 36 chemically sensitive spots. Each spot had different sensitivities to VOCs. The chemicals that made up the spots on the sensor array used in this study were selected to be generally responsive (ie, not sensitive to one or two specific groups of volatiles). We chose a broadly sensitive system, as the identity of the key volatiles that make the breath of patients with lung cancer unique has not been clearly established. This type of system has been shown to be sensitive at the lower parts per million to upper parts per billion range for specific volatiles.16 Colour changes on the array were imaged with the scanner at 2 min intervals during the breath collection (ie, 6 images per study subject). Colour changes were converted into numerical values for the change in the red, green and blue component of each spot, for each scan taken. This resulted in a 108-dimensional vector (36 spots, 3 values per spot). The difference between exhaled breath and room air results was used in the analysis.
Data collection
Data collected on the study subjects with lung cancer included gender, age, smoking status, size of primary tumour, location of primary tumour, histology of cancer, stage of cancer, comorbidities and medications. Data collected on the study subjects without lung cancer included gender, age, smoking status, pulmonary diagnosis (if any), comorbidities and medications.
Statistical analysis
The random forest method was used to develop a model for discriminating patients with lung cancer from those without.17 The random forest is a model for the classification of observations that is an alternative to logistic regression models, single classification trees and other classification models. Forests or trees are more flexible than logistic regression models since they allow for a broader scope of possible relationships between the VOC model predictors and lung cancer, and they do not require any additional variable selection or data reduction techniques. Random forests provide an additional benefit over a single tree since there is a reduced risk of bias in estimating prediction performance. A random forest is a collection of classification trees derived from bootstrap samples of the data. The drawback of the random forest is that it is a complex structure that cannot be succinctly summarised. Despite the complexity of the forest, its construction and the classification of future observations is a simple process, making the validation and initial assessments of the classification strength of a set of predictors easy. We used R V.1.9.0, including the “randomForest” package, to produce and evaluate the random forest. Evaluation of the random forest was carried out using percentage estimates of error rates. In all, 30% of subjects were randomly selected as a validation dataset, and the remaining 70% of subjects were used to develop the random forest. Each time point was used as a separate observation; however, all time points for any given subject were included together in either the forest building set or the validation set. They were not split between the two. For the validation set, a prediction of lung cancer was made if at least four of the six time points for any one subject were classified as lung cancer by the random forest. The statistical significance of the validation phase was calculated using χ2 or Fisher’s exact tests. The associations between each of gender, age, histology and stage versus patient misclassification in the validation set were analysed using χ2 or Fisher’s exact tests. Associations between each of stage and tumour size versus misclassification were assessed using Wilcoxon rank sum tests.
Institutional review board approval
The institutional review board of the Cleveland Clinic Foundation, Cleveland, Ohio, USA, approved this study, and all subjects provided signed informed consent.
RESULTS
One hundred and forty-three subjects agreed to participate in the study. A total of 49 subjects had non-small cell lung cancer, 21 were healthy controls, 20 had sarcoidosis, 15 had IPF, 20 had PAH, and 18 had COPD. The age, gender and smoking histories of these groups were typical for the conditions included in the study (table 1). Of the subjects with lung cancer, 7 (14%) were in stage IA, 7 (14%) in stage IB, 2 (4%) in stage IIA, 2 (4%) in stage IIB, 4 (8%) in stage IIIA, 11 (24%) in stage IIIB, and 16 (33%) in stage IV. In all, 55% of patients with lung cancer had well-defined adenocarcinoma, and 27% had well-defined squamous cell carcinoma.
Baseline demographics
A model built to compare the breath analysis of patients with lung cancer with all other study subjects using 70% of all study subjects had an error rate of 14.1%. The model was validated with the remaining 30% of study subjects. Validation revealed a sensitivity of 73.3% and a specificity of 72.4% for the diagnosis of lung cancer (p = 0.01). These results were not influenced by the subjects’ gender (p = 0.22), age (p = 0.96), histology (p = 0.49) or smoking history (p = 0.87). Similarly, the tumour size (p = 0.69) and cancer stage (p = 0.79) did not affect the results. Although the study was not designed to evaluate the ability of this system to diagnose other lung conditions, the results of model building and validation when each individual control group was compared with all other subjects are shown (table 2).
Model and validation accuracy
Twenty-nine subjects with indeterminate lung nodules <30 mm in maximal diameter participated in the study. At this time, 21 of the subjects had confirmed diagnoses. Only 1 of the 21 was proven to have lung cancer. When the above model was applied to these 21 individuals, the sensitivity was 100% and specificity was 60% (table 3).
Lung nodules: subject characteristics and test performance
DISCUSSION
We have shown that a colorimetric sensor array is capable of identifying the unique chemical signature of the breath of individuals with lung cancer with moderate accuracy.
The results were not affected by the subjects’ demographics, smoking history or stage of cancer. The results were similar for a small group of individuals with indeterminate lung nodules.
The earliest study to analyse the pattern of VOCs in the exhaled breath as a diagnostic test was published in 1985. In this study, 12 individuals with advanced stage non-small cell lung cancer and 17 healthy controls provided breath samples for analysis using GC–MS. Forty-nine VOCs were found to have differences in peak occurrence or concentration. From these 49, 22 peaks were used to develop a discriminate function. Only 7 of the 22 were needed to discriminate fully between the two groups studied.8
Two recent studies using GC–MS to analyse breath constituents in lung cancer have been published. The first study included 67 individuals with lung cancer, 41 healthy volunteers, 15 with metastases to the lung and 91 without cancer (who were undergoing a diagnostic bronchoscopy). A model using nine compounds to discriminate lung cancer from healthy controls had a sensitivity of 85.1% and a specificity of 80.5%. When lung cancer samples were compared with those from patients with negative bronchoscopy results, the specificity was 37.4%. When the comparison was with those with metastases to the lung, the sensitivity was 66.7%.13 The second study compared concentrations of 13 VOCs from the breath of patients with early-stage non-small cell lung cancer (n = 36) with asymptomatic smokers (n = 35), control non-smokers (n = 50) and subjects with mild to moderate COPD (n = 25). There was an overall accuracy of 82% with a sensitivity and specificity of 72.2% and 93.6%, respectively, for lung cancer.14
The major benefits of GC–MS analysis are its sensitivity and ability to identify the chemical differences that make the breath of patients with lung cancer unique. The downside is that the expense of the system and the expertise needed for interpretation render the technology difficult to use as a point-of-care test. Gaseous chemical sensing devices are easier to use and less expensive. The ability of two of these systems to detect lung cancer has been reported previously.
In the first report, the authors used a quartz microbalance sensor system. The study population included 35 individuals with lung cancer, nine with previously resected lung cancer and 18 healthy controls. A model developed from this system was reported to show 100% correct classification of lung cancer and 94% classification of controls (although the figure in the paper suggests a small amount of overlap between the groups). The model was not validated.18
The second system reported was a carbon polymer sensor system. This study was performed in two phases—a training phase and a validation phase. In the training phase, the study population included 14 patients with lung cancer, 27 controls with other lung conditions and 20 healthy controls. Analysis suggested that the sensor output from the patients with lung cancer was distinguishable from healthy controls, whereas the output from other disease groups was not. The validation group included 14 patients with lung cancer, 32 controls with other lung conditions and 30 healthy volunteers. The accuracy of the model for detecting lung cancer was 85% (sensitivity of 71.4% and specificity of 91.9%).19
This study differs from previous reports in the type of gaseous chemical-sensing device used, the breath collection method, the type of analysis and the study population. Our results seem to be more modest than those reported in the study of the quartz microbalance system. However, that study only reported the accuracy of the model building phase and did not report data on validation of that model or include controls with disease. Our results were also lower than reported for the carbon polymer sensor system. This may represent a true difference in the ability of these sensor systems to detect the discriminatory patterns of VOCs, or it may represent differences in accuracy related to the breath collection methods (ie, real-time sampling of tidal breathing in this study vs collection of a forced exhalation into a sampling bag in the prior report) or in the populations studied (ie, more patients with lung cancer in the model building phase and a greater portion of controls with disease in the model building and validation phases of this study). This report is the only one to test the model on small indeterminate lung nodules.
Gaseous chemical-sensing devices have been criticised for their lack of ability to identify the specific chemical compounds in the breath, as well as their lack of sensitivity to detect all of the potentially important VOCs. However, the goal of these devices is not to identify the breath constituents but to detect patterns of VOCs that serve as bio-signatures of lung cancer. The current proof of principle study supports the promise that these systems can be developed into a useful clinical test. Future identification of the specific chemical differences in the breath by other technologies could be applied to the refinement of current, or development of new, sensor systems. The most accurate sensor system published to date is the ability of dogs to distinguish the breath of patients with lung cancer from that of healthy controls. In the double-blind phase of the study, the dogs had an accuracy of 99%.20 This highlights the fact that pattern recognition in the absence of specific identification has the potential to produce results accurate enough to be clinically useful.
In summary, a colorimetric sensor array can detect the unique pattern of VOCs in the breath of patients with lung cancer with moderate accuracy. Further work may clarify the nature of the distinct breath constituents. This would help to guide refinement of the sensor array and breath collection system to maximise the diagnostic accuracy of the test. Ultimately, this line of investigation could lead to an inexpensive, non-invasive screening or diagnostic test for lung cancer.
Acknowledgments
We thank Dr Serpil Erzurum for her guidance and support of this project.
REFERENCES
Footnotes
-
Competing interests: None.
-
Chemsensing (Champagne, Illinois, USA) provided the sensor arrays, breath collection and analysis equipment free of charge. They were not involved in the statistical analysis or writing of this manuscript.