Article Text

Abstract
Background: Within-breath reactance from forced oscillometry estimates resistance via its inspiratory component (Xrs,insp) and flow limitation via its expiratory component (Xrs,exp).
Aim: To assess whether reactance can detect recovery from an exacerbation of chronic obstructive pulmonary disease (COPD).
Method: 39 subjects with a COPD exacerbation were assessed on three occasions over 6 weeks using post-bronchodilator forced oscillometry, arterial blood gases, spirometry including inspiratory capacity, symptoms and health-related quality of life (HRQOL).
Results: Significant improvements were seen in all spirometric variables except the ratio of forced expiratory volume in 1 s (FEV1) to vital capacity, ranging in mean (SEM) size from 11.0 (2.2)% predicted for peak expiratory flow to 12.1 (2.3)% predicted for vital capacity at 6 weeks. There was an associated increase in arterial partial pressure of oxygen (PaO2). There were significant mean (SEM) increases in both Xrs,insp and Xrs,exp (27.4 (6.7)% and 37.1 (10.0)%, respectively) but no change in oscillometry resistance (Rrs) values. Symptom scales and HRQOL scores improved. For most variables, the largest improvement occurred within the first week with spirometry having the best signal-to-noise ratio. Changes in symptoms and HRQOL correlated best with changes in FEV1, PaO2 and Xrs,insp.
Conclusions: The physiological changes seen following an exacerbation of COPD comprised both an improvement in operating lung volumes and a reduction in airway resistance. Given the ease with which forced oscillometry can be performed in these subjects, measurements of Xrs,insp and Xrs,exp could be useful for tracking recovery.
- ADLs, activities of daily living
- COPD, chronic obstructive pulmonary disease
- FEV1, forced expiratory volume in 1 s
- HRQOL, health-related quality of life
- LCADL, London Chest Activities of Daily Living
- Pao2, arterial partial pressure of oxygen
- PEF, peak expiratory flow
- OCD, oxygen cost diagram
- Rrs, resistance of the respiratory system
- SGRQ, St George’s Respiratory Questionnaire
- TDI, Transitional Dyspnoea Index
- VAS, visual analogue scale
- Xrs, reactance of the respiratory system
- Zrs, impedance of the respiratory system
Statistics from Altmetric.com
- ADLs, activities of daily living
- COPD, chronic obstructive pulmonary disease
- FEV1, forced expiratory volume in 1 s
- HRQOL, health-related quality of life
- LCADL, London Chest Activities of Daily Living
- Pao2, arterial partial pressure of oxygen
- PEF, peak expiratory flow
- OCD, oxygen cost diagram
- Rrs, resistance of the respiratory system
- SGRQ, St George’s Respiratory Questionnaire
- TDI, Transitional Dyspnoea Index
- VAS, visual analogue scale
- Xrs, reactance of the respiratory system
- Zrs, impedance of the respiratory system
Changes in lung function, symptoms and health-related quality of life (HRQOL) during exacerbations of chronic obstructive pulmonary disease (COPD) have previously been evaluated. Lung function has been assessed by peak expiratory flow (PEF)1,2 and spirometry.1,3,4 The largest rates of change occurred in the first few days of the exacerbation with greater increases in FEV1 over the first 2 days being predictive of superior clinical outcome.5 Recovery was sometimes slow and incomplete with only 75% having regained their original PEF by 35 days after the exacerbation and 7.1% not returning to baseline lung function at 3 months.1 Changes in symptoms have been determined using patient diaries,1,6 with the onset of symptoms occurring before changes in lung function.1 Improvement in disease-specific HRQOL following a transient fall due to an exacerbation has been shown using the St George’s Respiratory Questionnaire (SGRQ) and the Chronic Respiratory Disease Questionnaire (CRQ).2,7,8 Improvement in HRQOL following an exacerbation has been shown to be curtailed if a further exacerbation occurs during recovery.9
Physiological measurements
Forced oscillometry is a method of measuring the resistive properties of the respiratory system, which can delineate within-breath changes with sub-second resolution.10 Its output is commonly expressed as two variables, resistance (Rrs) and reactance (Xrs), which represent the spectral relationship between pressure and flow of a low-amplitude sinusoidal forcing signal entrained in the air that the subject breathes. Rrs is derived from the in-phase relationship and is thought to be a direct estimate of resistance. Xrs is calculated from the out-of-phase relationship. In normal subjects, it is thought to reflect elastic and inertive properties but, in subjects with airway obstruction, inspiratory values of Xrs have a stronger linear relationship with transpulmonary resistance than do the equivalent Rrs values.11 In addition, expiratory values of Xrs have been used to establish the presence of expiratory flow limitation.12,13
Forced oscillometry may be particularly appropriate for the objective physiological assessment of patients with an exacerbation of COPD. It is a passive manoeuvre that requires only tidal breathing, and is easily performed by breathless subjects. Further, within-breath measurements of Xrs could be used to estimate simultaneously both airway resistance and degree of expiratory flow limitation. To date, only one study has reported forced oscillometry data during an exacerbation of COPD.14 This confirmed the expectation that Rrs would not change but that Xrs would rise significantly towards more normal values as the exacerbation resolved. Within-breath Xrs data during an exacerbation of COPD have not been reported.
The aim of this study was to assess the ability of within-breath forced oscillometry to detect longitudinal physiological changes during an exacerbation of COPD in comparison with spirometry, gas exchange, symptoms and HRQOL.
METHODS
Subjects
Patients with a clinical diagnosis of COPD admitted to the medical receiving ward or referred to the Acute Respiratory Assessment Service at Glasgow Royal Infirmary (GRI) were approached to take part in the study. They were within 48 h of the point of presentation when first assessed, age >40 years, smoking history >20 pack-years and had baseline spirometry which satisfied the British Thoracic Society definition of COPD (ie, FEV1 <80% predicted and FEV1 to forced vital capacity ratio <70%).15 They had recognised features of an exacerbation, the criteria used here being increased breathlessness for at least 24 h with at least two criteria of increased cough frequency or severity, increased sputum volume or purulence or increased wheeze.16 The only exclusion criterion was decompensated respiratory failure.
To detect a change in Rrs of approximately 0.05 kPa· s/l with 80% power and a significance level of 0.05, the sample size required was 35 assuming a SD for the change of approximately 0.15 kPa· s/l. Given that some attrition was expected because of the frail condition of the study subjects, it was decided to aim for 50 patients in total. Ethical approval for this study was obtained from the GRI Local Research and Ethics Committee (Glasgow, UK) and written informed consent was given by each subject.
Study design
This was a longitudinal observational study (summarised in fig 1⇓). At the start of each visit the subject received 5 mg nebulised salbutamol delivered over 10–15 min in a 2.5 ml volume using a jet nebuliser (Micro-Neb Nebuliser, Lifecare Hospital Supplies, Market Harborough, UK) driven by an air flow of 8 l/min (Aquilon Nebuliser System, AFP Medical, Rugby, UK) through a facemask (Duo Mask Adult, Lifecare Hospital Supplies). Measurements were performed 20 min after the nebulised salbutamol had been given. Visit 2 was scheduled to occur at approximately 1 week after visit 1, and visit 3 at 6 weeks. If the patient had a relapse between visits 2 and 3 which required hospital admission or further treatment by the hospital at home team, visit 3 was postponed until the patient was in a stable condition at home and on normal treatment. One operator (MKJ) performed all tests and was blinded to the results of earlier tests.

Study design showing order of tests. HRQOL, health-related quality of life.
Physiological measurement
Spirometry was performed using a laptop-based spirometer (KoKo Spirometer, Ferraris Respiratory, Louisville, Kentucky, USA). The variables measured were slow vital capacity, FEV1, FEV1 to vital capacity ratio, inspiratory capacity and PEF. Quality control and procedures of testing followed the guidelines of the European Respiratory Society endorsed by the British Thoracic Society and the Association of Respiratory Technology and Physiology.17,18 Results of at least three satisfactory manoeuvres were obtained and the reported values were the highest values for FEV1, vital capacity and PEF and the mean result for FEV1/vital capacity. Inspiratory capacity was measured during a slow expiratory vital capacity manoeuvre where a period of tidal breathing was followed by inspiration to total lung capacity to record inspiratory capacity and then a full expiration to residual volume to give vital capacity. Performance of this procedure was checked visually and repeated until two inspiratory capacity values were within 10% of each other. The average of these two values was used. Predicted normal values were calculated using the European Community for Steel and Coal equations.17 Predicted inspiratory capacity was calculated by subtracting predicted functional residual capacity from predicted total lung capacity.
Sampling of earlobe arterialised capillary blood was performed to obtain values for arterial partial pressure of oxygen (PaO2) and carbon dioxide (PaCO2).19 A nicotinate vasodilator cream (Transvasin, SSL International, Knutsford, UK) was applied to the earlobe 20 min before blood sampling. The earlobe was then punctured using a 21 G needle, blood was collected into a heparinised 140 μl capillary tube (Multicap, Bayer Diagnostics, Sudbury, UK) and analysed immediately on an arterial blood gas analyser (Chiron Diagnostics Rapidlab 865, Halstead, UK).
The method for forced oscillometry has been described in detail elsewhere11 and followed the recently published European Respiratory Society recommendations.10 While the subject performed tidal breathing through a mouthpiece with nose occluded and cheeks supported, the oscillometer performed within-breath measurements of the impedance of the respiratory system (Zrs) using a sinusoidal excitation signal of 5 Hz frequency generated by a loudspeaker. A bias flow of 0.25 l/s of air was fed into the breathing circuit in order to minimise rebreathing. Calculation of Zrs was performed by software. The breathing and forcing waveforms were separated using a moving average filter20 and Zrs was calculated from the forcing waveforms using the method based upon power spectra,21 further adapted for within-breath analysis.20 This was separated into Rrs and Xrs and calculated as a function of time at each digitisation point (sampling frequency of 200 Hz) using the 0.2 s interval of flow and pressure centred on that point. These within-breath values were low-pass filtered to remove biological noise using a Butterworth eight-pole filter with a cut-off frequency of 2 Hz. The Rrs and Xrs values were averaged over the inspiratory (Rrs,insp, Xrs,insp) and expiratory (Rrs,exp, Xrs,exp) phases of each breath to give separate values for the two phases of the respiratory cycle. The studies by Dellaca et al12,13 showed that, in subjects with COPD, the difference between mean values of inspiratory and expiratory reactance (ie, ΔXrs which equals Xrs,insp–Xrs,exp) could detect expiratory flow limitation proven by oesophageal manometry with high sensitivity and specificity. In the later study,13 ΔXrs >0.275 kPa· s/l had a sensitivity of 95% and specificity of 98% for detecting breaths as flow limited. Percentage flow limitation, which represents the proportion of breaths for which ΔXrs indicated the flow limitation, was calculated for the subjects in this study. For all oscillometry variables, values from two recordings of 1 min duration were averaged.
Symptom scales and HRQOL questionnaires
Symptoms were assessed using visual analogue scales (VAS) for sleep, wheeze and mobility derived from Davies16 and a numerical scale used by Paggiaro.22 Dyspnoea was measured by four scales: VAS,16 modified Borg score,23 oxygen cost diagram (OCD)24 and the Baseline and Transitional Dyspnoea Indices (BDI/TDI).25 Activities of daily living (ADLs) were assessed using the London Chest Activities of Daily Living Questionnaire (LCADL).26 HRQOL was assessed using the St George’s Respiratory Questionnaire (SGRQ).27
Statistical analysis
Baseline results were summarised either as mean (SD) or median (range) and changes as mean (SEM). The changes in each test parameter were analysed between visit 2 and visit 1, visit 3 and visit 1, and visit 3 and visit 2 using the Student’s paired t test. To compare the relative utility of each variable, a sensitivity index28 was calculated from the size of the change divided by the coefficient of variation.29 To assess the relationship between changes in physiological variables and symptoms or HRQOL, Pearson’s correlation coefficients were calculated for changes in the key variables between visit 1 and visit 3. The level of statistical significance was taken as 0.05 throughout. All statistics were performed with Statview V.5.0.1.
RESULTS
Subjects
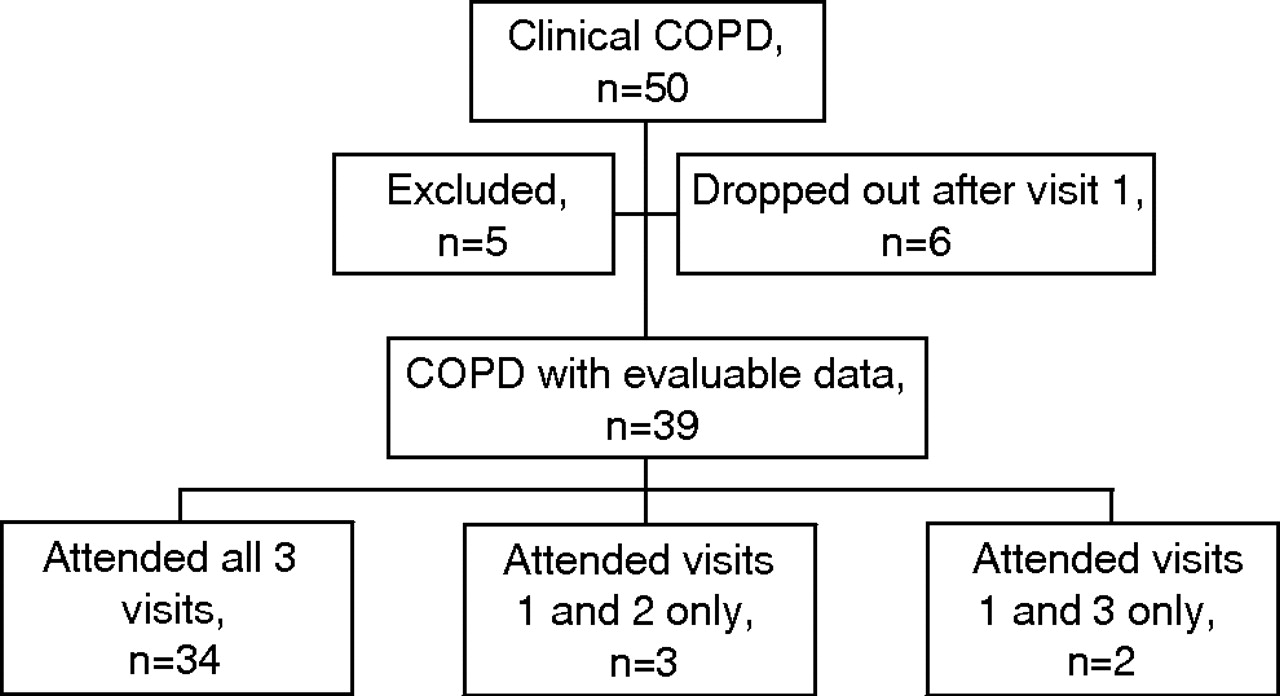
Figure 2⇓ summarises the recruitment of subjects into this study. Eighty six subjects with COPD were approached to take part. Of the 50 subjects who consented, five were excluded (three by spirometry showing absence of airways obstruction and two were non-smokers with bronchiectasis). A further six failed to attend after the first visit, leaving evaluable data on 39 subjects. The subjects successfully completed all the study protocols at the visits they attended and all had airways obstruction at their final visit after recovery from the exacerbation.

Flowchart showing recruitment of subjects. COPD, chronic obstructive pulmonary disease.
Baseline results
The data in table 1⇓ summarise the physiological status of the subjects at visit 1. Mean spirometry values showed moderate airway obstruction with a reduced inspiratory capacity similar to values elsewhere.2 Approximately half the subjects were in respiratory failure (mainly type 1). The oscillometry results showed increased magnitude of Rrs and Xrs compared with normal values.10 Expiratory flow limitation (indicated by ΔXrs) was present to some degree in 37 of the 39 subjects at visit 1. If expiratory flow limitation was present, not all breaths were necessarily affected, the proportion ranging from 0% to 100% with a mean of 68% (table 1⇓). The number showing flow limitation dropped on subsequent visits to 30 of 37 subjects at visit 2 and 24 of 36 subjects at visit 3. The patients were more symptomatic than normal, reflected by their VAS scores for sleep, wheeze and mobility and by their values on the TDI scale. ADLs were severely impaired and HRQOL was poor, with SGRQ values higher than those quoted by Spencer and Jones.7
Baseline values from visit 1
Change during exacerbation
Figure 3⇓ shows within-breath Xrs and Rrs results for three representative subjects from the three study visits. Qualitatively, it can be seen that the three subjects show a larger proportional change in Xrs than Rrs. Table 2⇓ shows the changes in physiological variables during the exacerbation. Percentage change values were derived in different ways for the spirometry and oscillometry variables. As lung volumes and flows were typically reduced and reliable predicted values available, these were given as percentage change relative to the predicted values. As oscillometry values were higher than normal during the exacerbation and predicted values less well known, the denominator for percentage change was the average of the values at the relevant visit. Figure 4⇓ summarises these results. The changes between visits 2 and 3 are not shown in detail as they were smaller and generally not significant (with the exception of FEV1, PEF, Xrs,insp, Paggiaro Symptom Score, TDI, Dyspnoea (VAS) and LCADL, which were marginally significant). Figure 5⇓ illustrates this time course of change.
Change in variables between visits for all patients
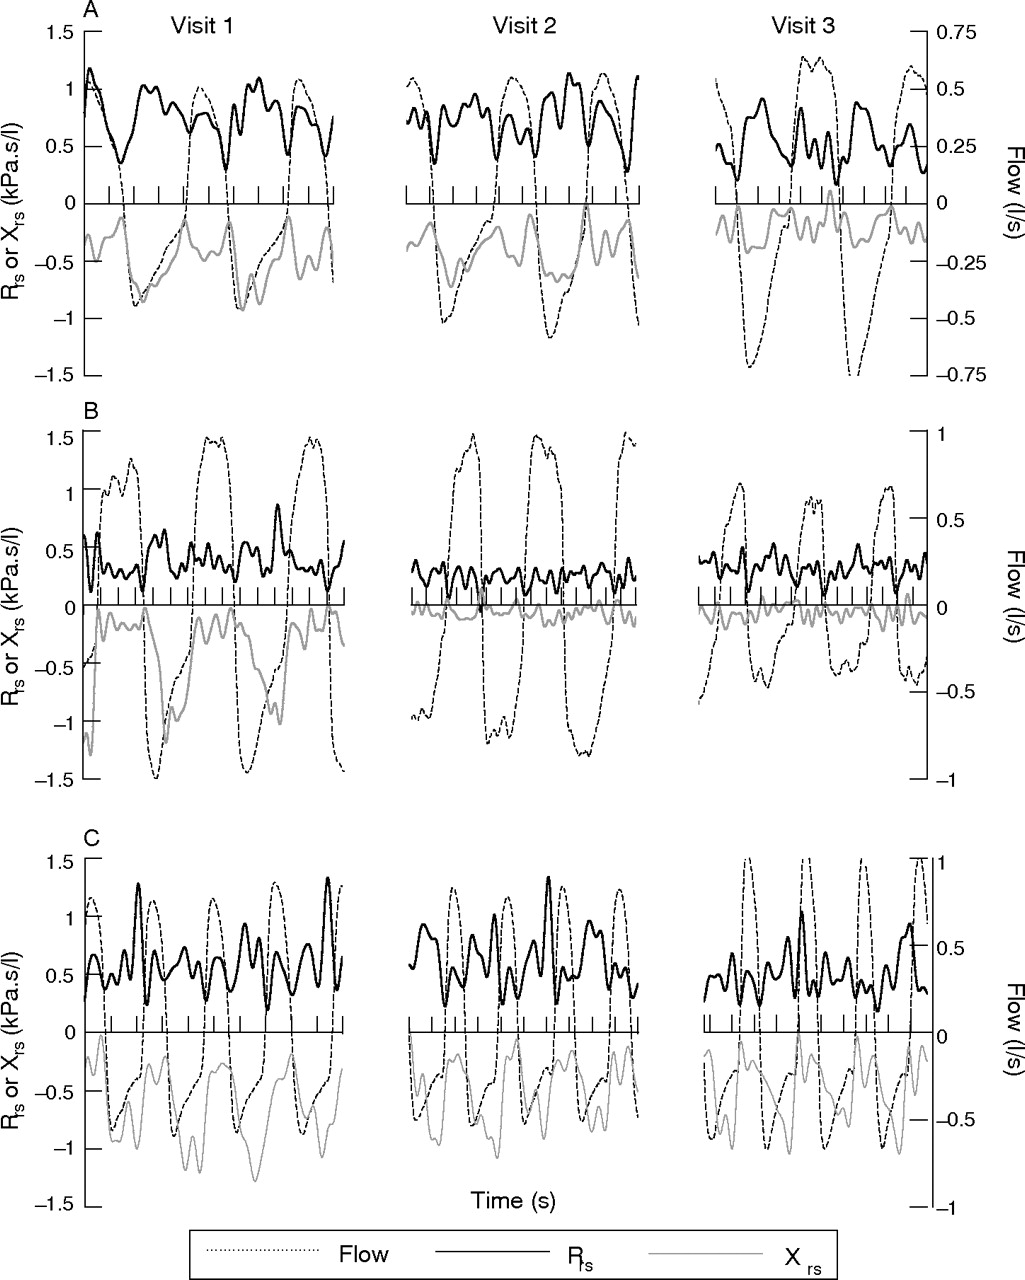
Within-breath resistance (Rrs) and reactance (Xrs) values from three subjects (A, B and C) showing the typical patterns of change between visits 1 and 3. The three subjects show a larger proportional change in Xrs than Rrs. Subject A experienced most improvement between study visits 2 and 3 whereas subject B changed most between visits 1 and 2. Subject C also showed improvement in both Xrs,insp and Xrs,exp but the continued expiratory fall in Xrs,exp suggested persistent flow limitation during tidal breathing throughout the study.

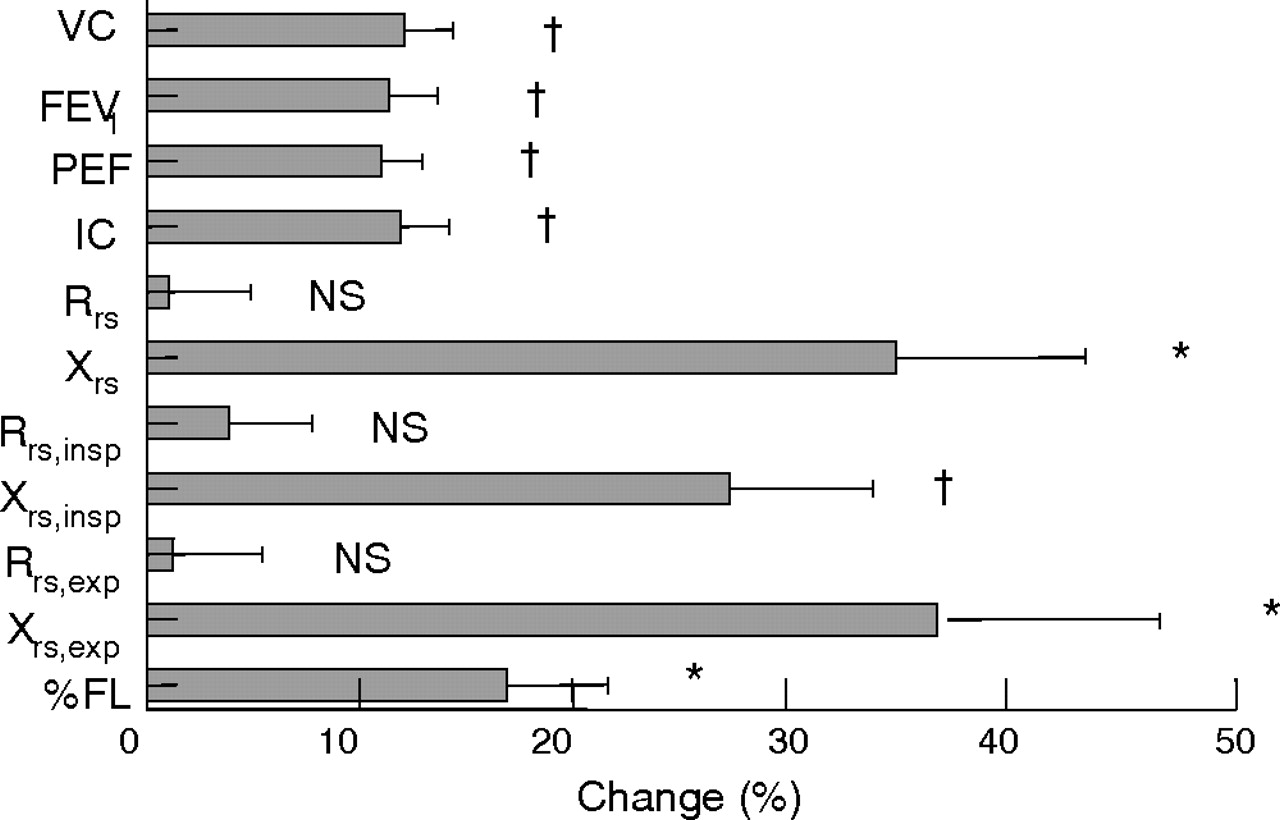
Comparison of the magnitude of the mean percentage changes in spirometry and oscillometry parameters between visits 1 and 3. Spirometry values are given as change in percentage predicted. Percentage changes in oscillometry parameters were calculated by averaging the results from the first and last visits and using this as the denominator. Error bars show SEM. *p<0.005, †p<0.001, NS, not significant. FEV1, forced expiratory volume in 1 s; %FL, percentage flow limitation; IC, inspiratory capacity; PEF, peak expiratory flow; Rrs, resistance of the respiratory system; VC, vital capacity; Xrs, reactance of the respiratory system.

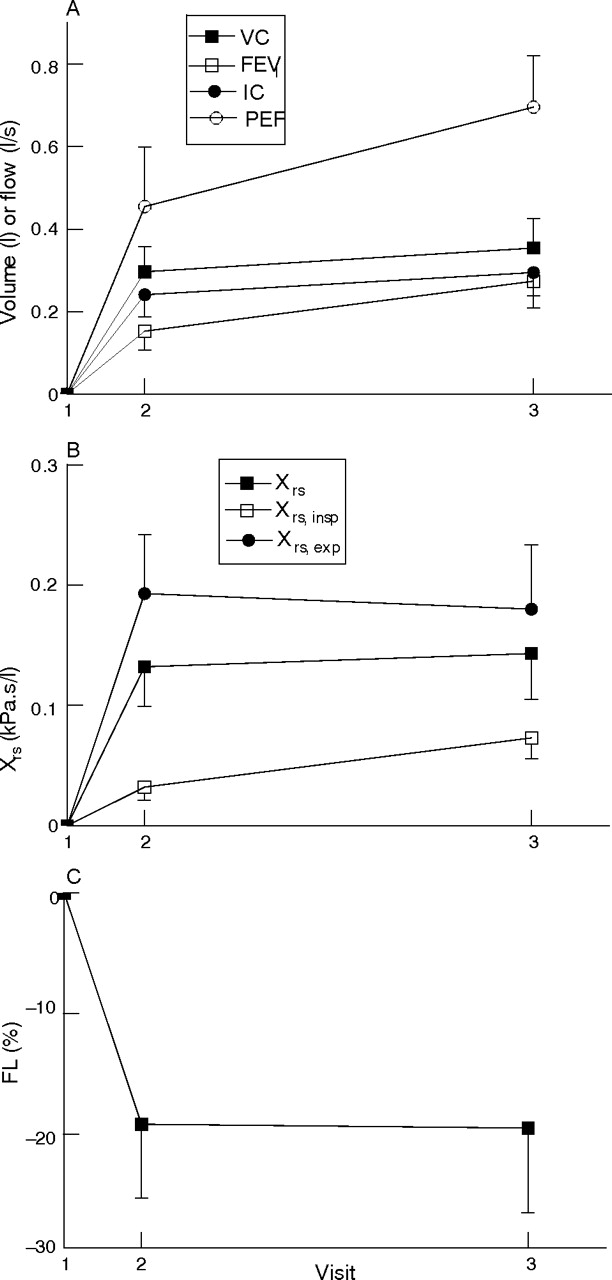
Time course of recovery of physiological variables. (A) Volumes and flows; (B) Xrs; (C) %FL. Values are mean change relative to visit 1. Error bars show SEM. FEV1, forced expiratory volume in 1 s; %FL, percentage flow limitation; IC, inspiratory capacity; PEF, peak expiratory flow; VC, vital capacity; Xrs, reactance of respiratory system.
To obtain a measure of the “signal-to-noise” content or sensitivity index of the physiological measurements,28 the changes between visits 1 and 3 are shown in table 3⇓ divided by the reproducibility or coefficient of variation of the measurement.29 FEV1, vital capacity and inspiratory capacity were the more reliable measurements followed by the Xrs variables.
Sensitivity index of spirometry and oscillometry measurements
Correlation between physiological variables and symptoms
Pearson’s correlation coefficients were calculated between changes in physiological variables and changes in symptoms or HRQOL, and are shown in supplementary table E1 (available at http://thorax.bmj.com/supplemental). The strongest correlation was seen between changes in PaO2 and OCD scores (r = 0.594; p = 0.0001). Of the spirometric variables, changes in FEV1 showed the strongest associations with changes in symptoms, having significant correlations with changes in OCD (r = 0.500; p = 0.002), TDI (r = 0.372; p = 0.02) and LCADL score (r = 0.499; p = 0.002). By contrast, changes in inspiratory capacity were only associated with changes in mobility (r = 0.329; p = 0.05). Changes in Xrs,insp were widely associated with changes in symptoms, showing positive correlations with changes in OCD (r = 0.430; p = 0.01), TDI (r = 0.458; p = 0.009), LCADL (r = 0.408; p = 0.01) and mobility (r = 0.493; p = 0.003). Changes in Xrs,exp showed fewer significant correlations. Both changes in Xrs,insp and Xrs,exp showed significant correlations with change in total SGRQ score (r = 0.442, p = 0.003 and r = 0.428, p = 0.009).
DISCUSSION
This study has shown that improvement after an exacerbation of COPD can be detected either objectively by physiological measurements such as spirometry, oscillometry or gas exchange or subjectively by the simpler strategem of following symptom scores or HRQOL (table 2⇑ and fig 4⇑). The majority of the improvement in all variables occurred within the first week of monitoring (table 2⇑, fig 5⇑).
In the study subjects there was a uniformly significant improvement in symptoms, ADLs and improvement in SGRQ (with the exception of the symptoms score) confirming subjective recovery from the exacerbation. All the spirometric variables (ie, FEV1, PEF, vital capacity and inspiratory capacity) increased significantly with the exception of FEV1/vital capacity, which is in line with findings elsewhere.1–,4 One difference found here was that the size of the change was very consistent in terms of percentage predicted, ranging from 11% for PEF to 12.1% for vital capacity. This diverges slightly from the results in the recent similar study by Stevenson et al where the absolute value of inspiratory capacity was lower throughout and the change in inspiratory capacity was found to be larger (19% predicted).14 Three factors which could account for these differences are the timing of the measurements, the baseline characteristics of the study populations and the technique used to measure inspiratory capacity. First, the patients in this study had their initial measurements performed on average a day later than those in studied by Stevenson et al, by which time they had already documented an increase in inspiratory capacity approaching 0.1 litre. Second, the subjects in Stevenson’s study at baseline had lower BMI and higher PaO2 values than those in this study. Being underweight and relatively well oxygenated are two characteristics of the group of patients formerly called “pink puffers” whose other key characteristic is marked hyperinflation and, hence, a relatively reduced inspiratory capacity. Third, inspiratory capacity was measured in this study during an expiratory vital capacity manoeuvre, whereas an inspiratory approach was used by Stevenson et al.
The subjects in this study showed a sizeable and significant increase in both Xrs,insp and Xrs,exp (27.4% and 37.1%, respectively). As explained earlier, this can be interpreted physically as a decrease in both transpulmonary resistance and expiratory flow limitation, respectively, during the study period. By comparison, there was no change in Rrs,insp and Rrs,exp (3.91% and 1.25%, respectively). The study by Stevenson et al14 is the only previous report of longitudinal changes of forced oscillometry variables during an exacerbation of COPD, and this showed a strikingly similar pattern of change to that seen here. They interpreted the lack of change in Rrs as implying that resistance does not improve during an exacerbation of COPD,14 but this inference can be contested. First, in subjects with COPD, airway obstruction is present both during the exacerbation and after recovery. In this situation, the relationship between transpulmonary resistance and Rrs is weakened by the upper airway wall shunt,11 and changes in the former may not be reflected in the measured Rrs value. Second, a fall in resistance during recovery from an exacerbation is suggested by the significant rise in FEV1 seen in this study. According to several models of flow limitation, maximal expiratory flow and, hence, FEV1 is dictated by the balance between thoracic elastic recoil and resistive pressure drop.30 As recovery progressed in this study, the degree of hyperinflation in the subjects reduced and the magnitude of elastic recoil must have fallen. To produce an increase in FEV1, there must have been a simultaneous and slightly greater fall in resistance.
To compare the relative ability of spirometry and oscillometry to detect improvement during an exacerbation of COPD, the sensitivity index of each variable was calculated by dividing the change in the variable by its coefficient of variation (table 3⇑). This effectively estimated the variable’s signal-to-noise ratio. It can be seen that spirometry was the superior measurement in this analysis. The coefficient of variation of the Xrs results could be improved by increasing the amplitude of the 5 Hz forcing signal, which would improve signal-to-noise ratio, or by increasing the number of data points averaged in the calculation of one Xrs value (by either prolonging the duration of data collection or increasing the number of times the measurement is repeated).
To assess the ability of changes in physiological variables to predict changes in symptoms or HRQOL, the correlation coefficients between changes in these variables from visit 1 to visit 3 were calculated (shown in the supplement available at http://thorax bmj.com/supplemental). The broadest association with symptomatic improvement was found for changes in FEV1, PaO2 and Xrs,insp. Only changes in the oscillometry variables (Xrs,insp and Xrs,exp) were associated with changes in HRQOL. Conversely, the symptom scales most broadly associated with physiological improvement appeared to be the TDI score and the VAS for mobility. Changes in Borg score were not correlated with physiological improvement and changes in PEF were not associated with symptom or HRQOL changes. The strength of all significant associations was modest at best. If the conservative Bonferroni correction was applied to compensate for the multiple statistical comparisons made, then only the association between changes in PaO2 and changes in OCD score remained positive.
A surprising aspect of the correlation analysis was the relatively weak association of change in inspiratory capacity with symptomatic improvement. It has recently been shown that change in resting inspiratory capacity post-bronchodilator is the strongest predictor of subsequent improvement in exercise capacity.31 Also, Stevenson et al14 found that patients reporting less breathlessness at the time of discharge were those in whom inspiratory capacity improved most during recovery. One factor contributing to this difference was that the patients in this study showed a slightly different pattern of physiological abnormality at baseline and change during recovery. The patients here showed more of an obstructive picture (mean baseline FEV1 0.96 l (43% predicted) compared with 1.03 l (47% predicted)14; mean change in FEV1 0.274 l (11.4% predicted) compared with 0.20 l14) and less hyperinflation (mean baseline inspiratory capacity 1.70 l (77% predicted) compared with 1.37 l (62% predicted)14; change in inspiratory capacity 0.295 l (11.9% predicted) compared with 0.42 l (19% predicted)14). When combined with the inferior reproducibility (in absolute terms) of inspiratory capacity measurements, the biological noise in the measurements may have masked the association between change in inspiratory capacity and change in symptoms or HRQOL in this study.
Several difficulties were encountered in performing this study. First, unless pre-exacerbation data are available, there are no precise objective criteria for establishing when a patient has reached a stable state post-exacerbation. This was defined pragmatically here as a time point at least 6 weeks after visit 1 with the patient at home in what they deemed a stable condition and on normal drugs. Second, it was difficult to achieve complete follow-up with the type of subjects in this study due to chronic, severe symptoms and the tendency to relapse. For clinical reasons there was some variability in the exact time point at which the patients were assessed, but the principle of assessing them at the beginning, early in recovery and then when largely back to stable state was achieved with reasonable success.
In conclusion, the physiological changes seen during recovery from an exacerbation of COPD comprised both an improvement in operating lung volumes (shown by inspiratory capacity) and a reduction in airway obstruction (assessed by FEV1 and Xrs). Forced oscillometry is potentially an attractive and simple test to perform in patients with breathlessness because it is a passive manoeuvre requiring only tidal breathing. Spirometry does have superior signal-to-noise behaviour but, compared with oscillometry, it is a maximal test that can be unpleasant to perform and leads to increased symptoms after the procedure. Changes in Xrs,insp and Xrs,exp were easily detected during an exacerbation in subjects with COPD, were widely associated with changes in symptom and HRQOL scores and could represent useful objective measurements for documenting recovery from an exacerbation. By contrast, changes in Rrs,insp and Rrs,exp were small in subjects with COPD and not useful in this context.
Acknowledgments
This study was funded by the Scottish Executive.
REFERENCES
Supplementary materials
Files in this Data Supplement:
Footnotes
Competing interests: None.