Article Text

Abstract
Trends in asthma indicators from population surveys (prevalence) and routine statistics (primary care, prescriptions, hospital admissions and mortality) in the UK were reviewed from 1955 to 2004. The prevalence of asthma increased in children by 2 to 3-fold, but may have flattened or even fallen recently. Current trends in adult prevalence are flat. The prevalence of a life-time diagnosis of asthma increased in all age groups. The incidence of new asthma episodes presenting to general practitioners increased in all ages to a plateau in the mid 1990s and has declined since. During the 1990s, the annual prevalence of new cases of asthma and of treated asthma in general practice showed no major change. Hospital admissions increased from the early 1960s, more so in children, until the late 1980s and have fallen since. Asthma mortality showed two waves, a shorter and more intense one in the mid 1960s and a longer and less intense one in the late 1970s and early 1980s. The relative roles of diagnostic transfer, coding changes, medical care and epidemiological factors are discussed.
- ICD, International Classification of Diseases
Statistics from Altmetric.com
In the UK, asthma is an important cause of impaired quality of life, use of primary care, consumption of prescribed drugs, hospital admission and mortality across the whole spectrum of age, sex, ethnicity, socioeconomic status and geographical location.1 Internationally, the UK ranks high in the prevalence of asthma,2 hospital admissions3 and mortality.4 Overviews of trends in asthma in the UK have been published previously,5,6 not including many reports of trends in individual indicators such as prevalence determined by repeat surveys or utilisation of services obtained from routine data sources. The aim of this paper is to provide a succinct update of trends in available national-level data on asthma in the UK over the past 50 years. It complements a companion paper on trends in allergic diseases.7
METHODS
Data were derived from a variety of sources chosen for the reliability of their estimates over time. They comprised routine prescribing, admissions and mortality data, large-scale general practitioner databases, national survey series, and local ad hoc surveys of asthma diagnosis and symptoms. Details of these can be found elsewhere8 or in individual publications (see below).
Trends in the prevalence of the reported diagnosis of asthma and of recent symptoms of wheezing (a measure less dependent on diagnostic changes over time) were obtained from available repeat surveys—that is, those that used the same methodology over time.9–20 In view of the probability of recall problems, only the 12-month period prevalence (3 years in the case of the Aberdeen Study) of wheezing symptoms is presented. In the British General Household Survey, conducted almost annually from 1971 to 2004, respondents are asked “do you have any long standing illness?” and then “what is the matter with you?” Since the late 1980s, the responses have been classified by diagnosis, including asthma.21 Trends in primary care consultations were obtained from three sources: Morbidity Statistics in General Practice (1955–6, 1970–1, 1981–2 and 1991–2),22–25 the Weekly Returns Service of the Royal College of General Practitioners, London, UK (annually from 1976 to 2004)26,27 and from the General Practice Research Database (annually from 1990 to 1998).28 Community prescriptions for asthma drugs (inhaled corticosteroids and “other” asthma drugs) were obtained from national surveys of NHS general practitioner prescriptions (annually from 1962 to 1975 and from 1980 to 2004).29,30 Hospital admissions were obtained from the Hospital Inpatient Enquiry (annually from 1958 to 1985),31 Hospital Episode Statistics (annually from 1988 to 2003)32 and Scottish Hospital Inpatient Statistics (annually from 1981 to 2003).33 Analysis of hospital admissions was restricted to emergency admissions and first hospital episode (for the Hospital Episode System). Mortality rates were obtained from National Statistics, and include both routine published data34 and primary mortality records held by the Lung and Asthma Information Agency (London, UK). Mid-year denominator population estimates were obtained from National Statistics. For mortality and hospital admission, asthma was identified by the relevant code from the World Health Organization International Classification of Diseases (ICD) in its successive revisions (241 in the 6th revision in 1950 and in the 7th in 1958, 493 in the 8th revision in 1968 and in the 9th in 1979, J45–46 in the 10th revision in 1995 for hospital admissions and in the 10th in 2001 for mortality). Trends will be presented graphically to retain consistency of presentation and ease of interpretation between different types of series and trend patterns, and using a log scale in order to make it easier to compare rates of change over time between trends with widely differing absolute rates. The sexes have been combined because they both tend to follow similar trends over time.
RESULTS
Prevalence of wheezing, asthma diagnosis and other measures
Figure 1A shows the trends in the period prevalence of recent wheezing of any severity in children. These are based on a variety of survey methods, population samples and targeted ages, but have in common that they report the period prevalence of any wheeze symptom over a prior-defined period (generally 1 year). Prevalence appears to have increased from around 10% in the 1960s and 1970s to around 20–30% in the late 1990s and early 2000s. Two national surveys with baselines in the mid-1990s show, respectively, very little increase20 and a decrease of about 20%.14

(A) Trends in the period prevalence of any recent wheeze in children. (B) Trends in the prevalence of frequent or persistent recent wheeze in children. (C) Trends in the period prevalence of wheeze and of a diagnosis of asthma ever in adults. (D) Trends in the prevalence of a diagnosis of asthma ever in children. m, month; y, year.
Figure 1B shows trends in the prevalence of frequent or persistent recent wheeze in children. These tended to increase or decrease in parallel with trends in any wheeze symptom in the same survey, suggesting that the increase in prevalence was related to both mild and more severe asthma symptoms.
There are fewer data on adults and the trends vary (fig 1C). A study of adults aged 20–44 years in Newcastle upon Tyne found an increase in recent wheezing from 29% to 34% from 1993 to 1999, and the prevalence of night waking with wheeze increased from 9.0% to 12.4% over the same period. In 45–54-year olds in Scotland between 1974 and 1995, there was a decrease in persistent wheeze from 11.5% to 4.9%. In adults over 16 years in the Health Survey for England, there was little change in frequent wheeze between 1996 and 2001. In the British General Household Survey, the prevalence of self-reported current chronic illness described as asthma in men and women aged 16–44 years appeared to rise and fall between 1998 (3.0%) and 2004 (4.4%).
There has been an increase in the prevalence of a history of asthma diagnosis “ever” in both children (fig 1D) and adults (fig 1C). Especially in studies with earlier baselines, this increase has been steeper than that for increases in the period prevalence of symptoms. For example, in south London, the proportion of currently wheezing children with a diagnosis of asthma increased from 31% to 61% to 77% from 1978 to 1991 to 2002.10 Even where there is evidence for a decrease in the prevalence of symptoms, the prevalence of “asthma ever” showed an increase.14
Only two of these repeat prevalence studies incorporated an objective measure of bronchial hyperreactivity. In 12-year-old children, the prevalence of bronchial hyperresponsiveness measured by the exercise test increased from 1974 to 1988 but was decreased in 2003.9 In young adults, the prevalence of responsiveness to methacholine challenge was reduced between 1993 and 1999.18 In both studies, these results were contrary to increases in the prevalence of asthma symptoms.
Primary care
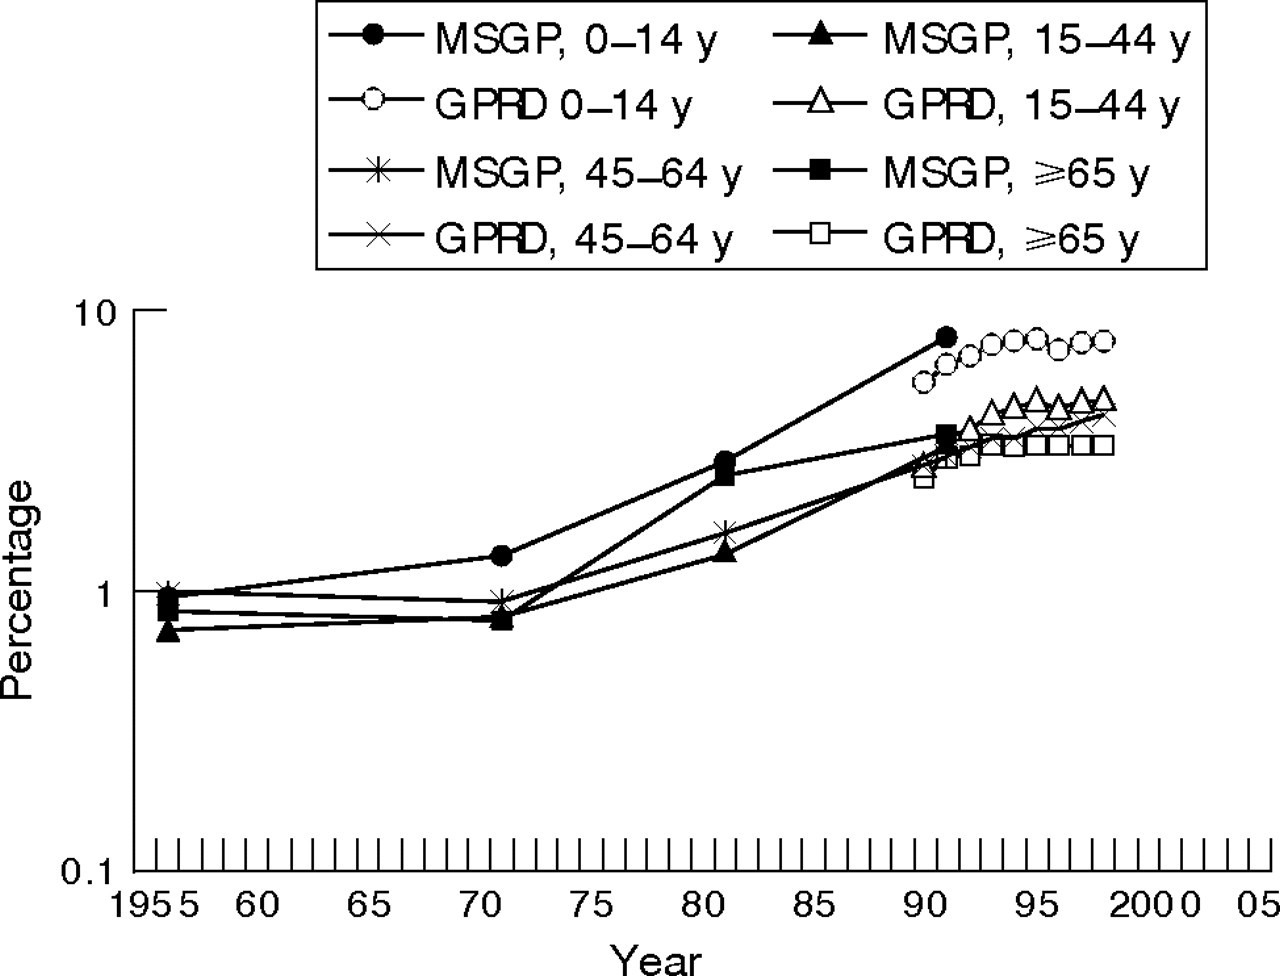
The results from four decennial national surveys of general practice spanning from 1955/6 to 1991/2 show an increase in rates for patients consulting for asthma—that is, in the number of people consulting per registered population at risk (fig 2). The 0–14 years age group showed about an eightfold increase whereas adults showed a three to fourfold increase. Consultation rates did not increase to the same extent because the increase in patients consulting was accompanied by a marked decrease in consultations per patient consulting. For example, in children consultations per patient fell from 4.4 to 2.1 per year over the same period (not presented).

Patients consulting general practitioners for asthma per 10 000 population, England and Wales, 1955–1998. Data from the General Practice Research Database (GPRD) and Morbidity Statistics in General Practice (MSGP). y, year.
From the general practice research database, which covers about 5% of the UK population, trends in the annual prevalence of managed physician-diagnosed asthma were estimated for the years 1990–1998 (fig 2). For both males and females, rates increased steadily from 3% to 5%. Increases were observed in all age groups, although in children there was some evidence for a flattening out from the mid-1990s. There was no evidence of a decline in severity, but increasing proportions were using inhaled corticosteroids and β2 agonists.
Incidence of asthma in general practice is defined by the rate of new patients consulting or new consultations within a period. In the general practice research database, between 1990 and 1998, a fall in the annual incidence of asthma was shown in patients of all age groups, which was most marked in the 5–14-year age group (not presented).
The Weekly Returns Service of the Royal College of General Practitioners has monitored the incidence of new weekly episodes of asthma since 1976 up to the present day (fig 3; online supplementary figures A and B). Rates for children show a monotonic proportional increase up to the early 1990s and a steady proportional fall in the late 1990s. Adults show a more uneven increase up to the early 1990s, and then a more gradual rate of fall. The turning point appears to be the same period (1991–4) for all age groups.
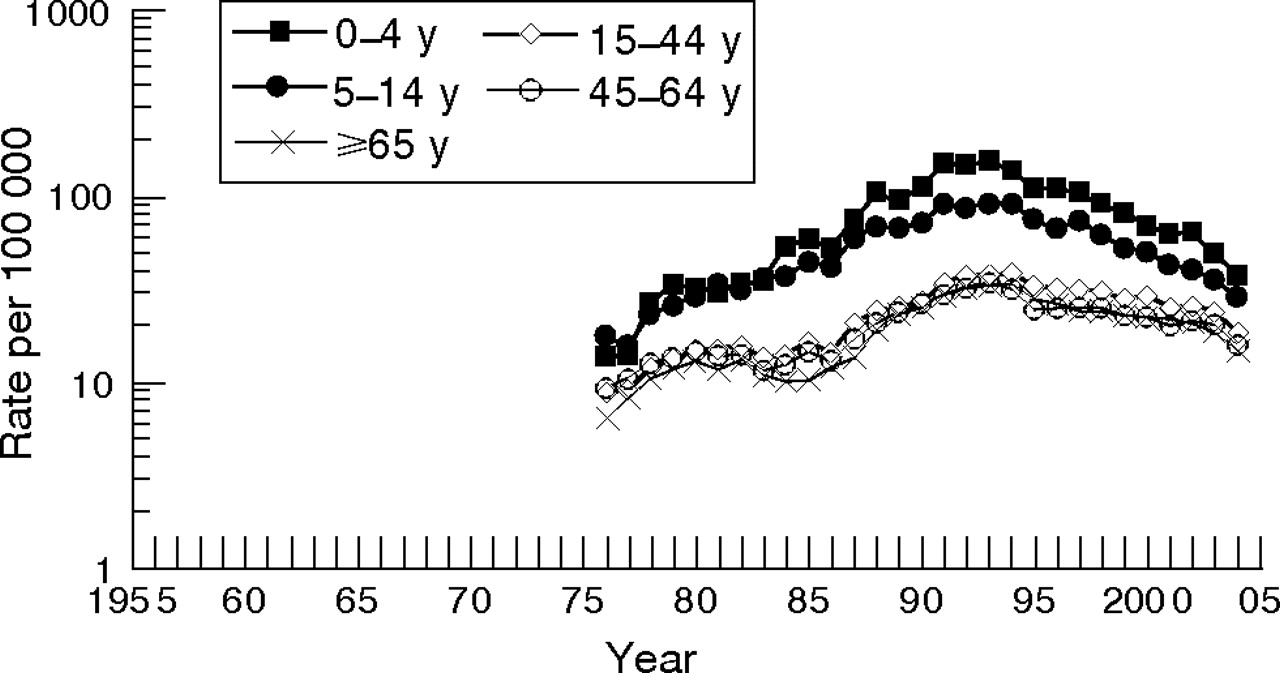
Mean weekly new episodes of asthma presenting to general practice, by age, England and Wales 1976–2004. y, year.
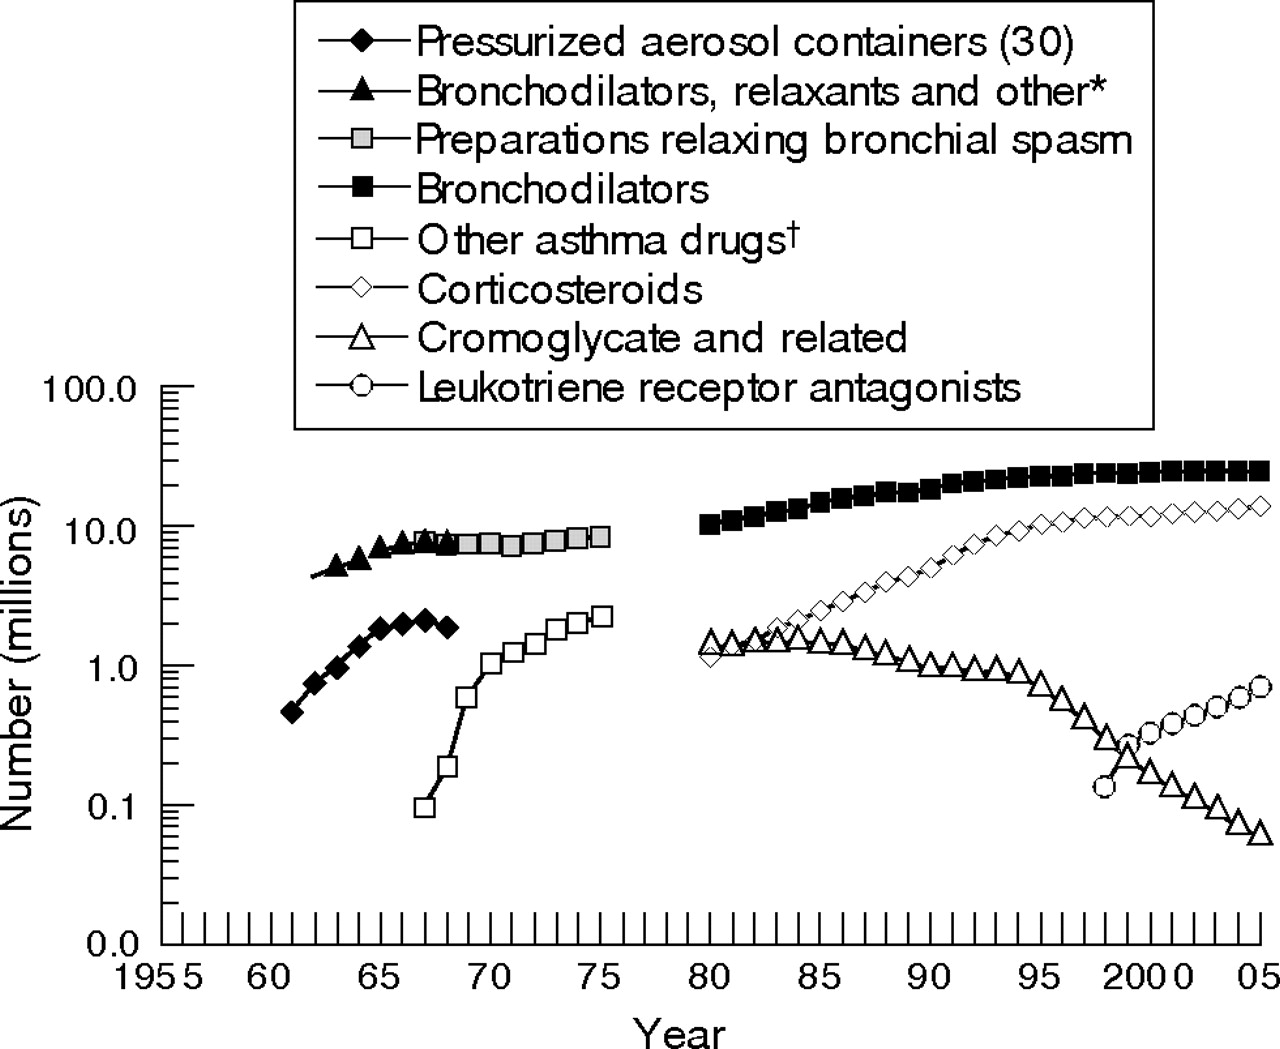
From 1967 to 2005, the number of community prescriptions for asthma drugs increased from 15.5 to 39.8 millions (fig 4). These data are not available by age or clinical indication and will include prescriptions for chronic obstructive pulmonary disease. Since their introduction in the early 1970s, prescriptions of inhaled corticosteroid drugs have risen at a greater rate than bronchodilators and now account for one third of prescriptions. Since the late 1990s, prescriptions for both of these categories have levelled off. Prescriptions for leukotriene receptor antagonists increased fivefold between 1998 and 2005, with a parallel decline in the prescribing of cromoglycate drugs.

Number of community prescriptions for asthma drugs, England 1961–2005. *Bronchodilators, relaxants and other preparations affecting the respiratory tract. Estimated from England and Wales data. There was a classification change between 1964 and 1965. †Other preparations acting locally on the lower respiratory tract, respiratory stimulants and others.
Hospital admissions
Figure 5 shows the annual emergency hospital admissions for asthma, by age, from 1958 to 2003 on a logarithmic scale (and on a linear scale in online supplementary figs C and D). From the early 1960s to the early 1970s there was an increase in all age groups. After that, the 0–4 year age group continued with the same rate of change until, by 1986, it had increased nearly 15 fold. Older children and adults showed a flattening or fall until in the mid-1970s they began to increase at a steady rate up to 1986. The highest rate of change was for the 0–4 year age group, followed by 5–14 years and young adults. Towards 1986, there was a suggestion of a fall in the rate of increase in the two age groups of children. From 1988, the first year of the Hospital Episode Statistics, the rates of admission (first hospital episode) have fallen in children, while those for adults have remained more or less steady. The gap in the series for the years 1987 and 1988 was due to the change in systems, but seems to have coincided with the peak in admissions. These two events are probably not causally connected because there was no change in the coding system at that time, and in Scotland, where there was continuity in the system, the rise and fall of admissions occurred over the same period as in England and Wales.7 The English hospital admissions system does not identify individuals; so it is not possible to distinguish the component of trends that might be explained by an increase in readmissions. An analysis of admissions in one English region from 1970 to 1985 found no evidence to suggest that the increase in admissions was due to an increase in readmission rates.35

Hospital admissions for asthma by age, England and Wales 1958–2003. The trend in >65-year olds is very similar to that in 45–64-year olds, hence is not included for clarity. y, year.
Mortality
Figure 6 and online supplementary figures E and F show the trends in annual mortality due to asthma by age from 1955 to 2004. Death rates increase with age and this is consistent over the whole period. Two waves are discernable. The first epidemic occurred at the beginning of the 1960s, reaching a turning point around the mid-1960s. The rate of increase was highest in children and young adults, less in the 45–64 year age group and barely discernable in the ⩾65 year age group. In children, annual rates have shown some variability due to random variation, but have tended to slowly fall since then. During the late 1970s, rates gradually increased in adults, reaching a plateau in the late 1980s and gradually declining since then. Except for the ⩾65 year age group, recent rates are below those observed around 1960. There is little evidence of major step changes associated with successive ICD revisions except that after the implementation of ICD9 in 1979, when there was an increase of 28% mainly in older age groups.36 The implementation of Rule 3 between 1984 and 1992, which gave priority to certain mentioned but not underlying causes, was associated with a 15% increase in deaths. In a combined analysis of underlying and mentioned causes using the Oxford Record Linkage Study, it was shown that this was an artefact arising from the change in coding system.37

Mortality from asthma by age, England and Wales, 1955–2004. y, year.
DISCUSSION
The sources of data described in this review do not provide a complete picture of trends in morbidity and use of health services for asthma. In particular, we do not have adequate data on morbidity in adults, nor are there data on the use of emergency or outpatient departments. Nevertheless, a number of conclusions may be drawn. Trends in the prevalence of childhood asthma generally indicate an increase in asthma symptoms of all grades of severity from the 1960s, when the earliest surveys were done. There is some evidence that trends flattened or even began to fall in the late 1990s and early 2000s. Evidence for adults is sparse and conflicting, but national surveys suggest that little change has occurred in recent years. There has been an upward trend in a lifetime diagnosis of asthma and in the proportion of currently wheezing children diagnosed as having asthma. Hospital admissions increased until the late 1980s and have been declining since. The rise and fall in hospital admissions was highest in younger age groups but affected all age groups around the same period, indicating that any important cohort effect was unlikely. The incidence of asthma episodes presenting to general practitioners rose in all ages to a plateau in the mid-1990s and has declined since. The prevalence of treated asthma in general practice rose and then flattened out during the 1990s, while at the same time incident asthma in general practice remained steady. Over the past four decades, community prescriptions for asthma drugs have been increasing, with corticosteroids showing the greatest relative increase. Since the late 1950s, mortality attributed to asthma has shown two waves, a shorter and more intense one in the mid-1960s and a longer and less intense one in the late 1970s and early 1980s. Current mortality is low and the trends are flat.
To a varying extent, these trends may be explained by artefactual, medical care and epidemiological factors, all of which have been explored in detail in some of the source publications and previous reviews.35,38–41 Only the salient points will be covered here. Changes in the way the data have been obtained and classified may potentially affect trends. For this reason, we have restricted the analysis of trends in prevalence to repeat surveys using consistent methods. This does not preclude artefact due to a secular trend in the way respondents perceive and describe respiratory symptoms. There may also be less reticence in recent years about reporting a diagnosis of asthma. For sources that use the World Health Organization ICD, there is the potential for changes in coding or coding rules to create step changes in the trends, but this factor has made little difference to the long-term patterns.
More important is the possibility of diagnostic transfer with other lower respiratory conditions that have asthma-like manifestations and clinical overlap. In children, examination of trends in bronchitis admissions and general practitioner episodes does not support this explanation.26,35,42 In older adults, however, diagnostic transfer from chronic obstructive pulmonary disease is a distinct possibility.43,44 Mortality, hospital admissions and general practitioner consultations for chronic obstructive pulmonary disease have risen or remained stable,45 but this condition is much more common than asthma and it would require only a small shift in diagnosis to make a considerable impact on asthma trends. If this were the case, we might expect a greater change in the elderly patients compared with younger adults, but this was not seen.
There have been a number of important changes in the medical care of asthma over the past few decades. These include improvements in the pharmacological selectivity and delivery of adrenergic and corticosteroid drugs, an increasing recognition that asthma may be underdiagnosed and undertreated, and a greater emphasis on preventive drug therapy. Such changes could explain in part why measures of utilisation such as admissions and general practitioner consultations increased up to the late 1980s. The subsequent decline in the incidence of severe asthma indicated by trends in both hospital and general practitioner data, during a time when the prevalence of treated asthma in general practice has remained fairly stable, is consistent with the greater penetration and effective use of inhaled corticosteroids. The recent fall in prevalence of moderate to severe asthma in 13–14-year-old children is also consistent with this, although it would not explain the concomitant fall in mild symptoms.
It is ironic that the most obvious increase in mortality due to asthma, the 1960s epidemic, is most plausibly explained by changes in the type and use of asthma drugs. The second epidemic that occurred in the mid-1970s to mid-1980s has never been explained in these terms, although an epidemic in New Zealand that occurred around the same time has been attributed to the adverse effects of treatment.46 One explanation might be that mortality due to asthma increased because of an increase in the underlying prevalence, and later declined as mortality was reduced due to improved treatment of severe asthma, particularly with oral steroids.47
These trends are also compatible with changes in the underlying incidence or prognosis of asthma, or factors that affect the intensity, duration and frequency of attacks, but we are uncertain as to what these have been.40,48 The most convincing evidence for an underlying increase in asthma up to the mid-1990s is the increase in prevalence of all grades of severity of symptoms. Depending on the time span and particular measure being considered, this is compatible with a two to threefold increase between the 1960s and 2000. This could reflect changes in incidence of asthma, or of precipitating factors, severity or prognosis, but we cannot distinguish between the influences of these on prevalence from the available data. The rate of change in prevalence has been much less than for utilisation statistics, suggesting that trends in the utilisation statistics were driven more by changes in medical care than by changes in epidemiological factors. However, the fact that an increase in prevalence represents an underlying increase in asthma is supported by independent evidence of increases in atopic eczema, allergic rhinoconjunctivitis and atopic sensitivity.8 Likewise, it is relevant that the recent fall in prevalence of asthma symptoms in 13–14-year-old children was accompanied by similar reductions in atopic eczema and allergic rhinoconjunctivitis.14
Although there are very important gaps in the asthma trends database, the UK is well served compared with other countries. It is outside the scope of this review to include an international comparison, but we note that some other countries have observed similar trends in mortality, hospital admissions and prevalence.3,4
REFERENCES
Supplementary materials
web only figures 62/1/85
Files in this Data Supplement:
Footnotes
-
RG and ESL are supported by Asthma UK, the British Thoracic Society and the British Lung Foundation.
-
Competing interests: None declared.