Article Text

Abstract
Background: Clinical detection of structural narrowing of the upper airway may facilitate early recognition of obstructive sleep apnoea (OSA). To determine whether the craniofacial profile predicts the presence of OSA, the upper airway and craniofacial structure of 239 consecutive patients (164 Asian and 75 white subjects) referred to two sleep centres (Hong Kong and Vancouver) were prospectively examined for suspected sleep disordered breathing.
Methods: All subjects underwent a history and physical examination with measurements of anthropometric parameters and craniofacial structure including neck circumference, thyromental distance, thyromental angle, and Mallampati oropharyngeal score. OSA was defined as an apnoea-hypopnoea index (AHI) of ⩾5/hour on full overnight polysomnography.
Results: Discriminant function analysis indicated that the Mallampati score (F = 0.70), thyromental angle (F = 0.60), neck circumference (F = 0.54), body mass index (F = 0.53), and age (F = 0.53) were the best predictors of OSA. After controlling for ethnicity, body mass index and neck circumference, patients with OSA were older, had larger thyromental angles, and higher Mallampati scores than non-apnoeic subjects. These variables remained significantly different between OSA patients and controls across a range of cut-off values of AHI from 5 to 30/hour.
Conclusions: A crowded posterior oropharynx and a steep thyromental plane predict OSA across two different ethnic groups and varying degrees of obesity.
- AHI, apnoea-hypopnoea index
- BMI, body mass index
- MS, Mallampati score
- NC, neck circumference
- OSA, obstructive sleep apnoea
- OSAHS, obstructive sleep apnoea-hypoponea syndrome
- TMA, thyromental angle
- TMD, thyromental distance
- sleep apnoea
- craniofacial structure
- upper airway
- ethnicity
- prediction equations
Statistics from Altmetric.com
- AHI, apnoea-hypopnoea index
- BMI, body mass index
- MS, Mallampati score
- NC, neck circumference
- OSA, obstructive sleep apnoea
- OSAHS, obstructive sleep apnoea-hypoponea syndrome
- TMA, thyromental angle
- TMD, thyromental distance
Structural narrowing of the upper airway is a major factor contributing to pharyngeal occlusion during sleep in the obstructive sleep apnoea-hypoponea syndrome (OSAHS).1 Patients with OSAHS manifest a spectrum of abnormalities of craniofacial soft tissue and skeletal anatomy that appear to act synergistically to promote upper airway obstruction during sleep.2 Adiposity in the neck region and retrognathia are recognised risk factors for OSAHS.3–5 Many patients with OSAHS have evidence of both neck adiposity and skeletal abnormalities.2 The relative contributions of soft tissue and skeletal abnormalities vary among patients and between ethnic groups: Asians have more pronounced skeletal abnormalities and are less obese than white subjects for a given degree of severity of OSAHS.6
Epidemiological data demonstrating the relationship between OSAHS and cardiovascular morbidity highlight the potential importance of early recognition and treatment.7 Yet, despite recent advances in the diagnosis and treatment of sleep disordered breathing, OSAHS remains under-recognised. This may be partly related to the limited availability of diagnostic facilities and to the non-specific nature of symptoms associated with OSAHS. Various attempts to use diagnostic algorithms based on features of the history, physical examination, and overnight oximetry to identify patients with OSAHS have met with limited success.8,9 Common symptoms such as snoring and daytime hypersomnolence lack specificity for the diagnosis of OSAHS. Witnessed apnoea is an important clue but requires observation by a regular bed partner. Oximetry is widely used as a case selection tool for OSA, but its sensitivity and specificity in predicting OSA are quite variable.8 Prediction models based on physical findings have used measurements that may not be easily incorporated into the routine physical examination.10 Some readily detectable visual cues to the presence of OSAHS would be useful for the primary care physician whose encounters with patients may be brief and infrequent.
In a preliminary report we observed that certain characteristics of craniofacial structure were commonplace in patients with OSAHS and could be readily identified on routine physical examination.11 We therefore hypothesised that a simple clinical assessment of craniofacial profile using measurements of soft tissue and skeletal abnormalities that may contribute to upper airway narrowing would predict the presence of OSAHS. We also wished to determine whether ethnicity affected the utility of this assessment.
Some of the results of this study have been previously reported in the form of an abstract.12 The study was reviewed and approved by the ethics review boards of our respective institutions.
METHODS
We studied 239 consecutive patients referred for the assessment of possible OSAHS to two university based regional sleep disorders clinics—one in Hong Kong and the other in Vancouver, British Columbia—between January and December 1999. At the time of the initial visit, having given written informed consent, each patient underwent a detailed history and physical examination including anthropometric measurements—height, weight, and calculation of body mass index (BMI).
Craniofacial measurements
Craniofacial measurements were made with the patient seated upright in a straight backed chair in the natural head position looking straight ahead (fig 1). Natural head position is used increasingly as a logical reference for the evaluation of craniofacial morphology and has been shown to be stable and reproducible in the short term to within 2°.13 The following measurements were made:

Profile of the head and neck region illustrating the following features: thyromental plane: running through the soft tissue mentum and the thyroid prominence; thyromental angle (TMA): between the thyromental plane and the soft tissue plane of the anterior neck; thyromental distance (TMD): the horizontal distance between the thyroid prominence and a perpendicular dropped from the soft tissue mentum; neck circumference (NC): at the level of the cricothyroid membrane.
-
Neck circumference (NC): at the level of the cricothyroid membrane, measured with a tape measure.
-
Thyromental distance (TMD): the horizontal distance from the thyroid prominence to a perpendicular dropped from the soft tissue mentum, measured with a modified tape measure with a vertical attachment.
-
Thyromental angle (TMA): the angle between the soft tissue plane of the anterior neck and a plane running through the soft tissue mentum and the thyroid prominence, measured from a lateral photograph of the head and neck taken in the natural head position with the patient looking straight ahead. The camera was mounted on a tripod with the front of the lens oriented vertically, at a constant distance of 6 feet from the patients’ left ear and with the height adjusted to maintain the body of the lens horizontal, centred on the tragus of the left ear.
-
Mallampati oropharyngeal score (MS):14 measured during a breath hold at end-tidal inspiration with the mouth wide open, tongue maximally protruded, but without phonation or attempted elevation of the soft palate (fig 2).
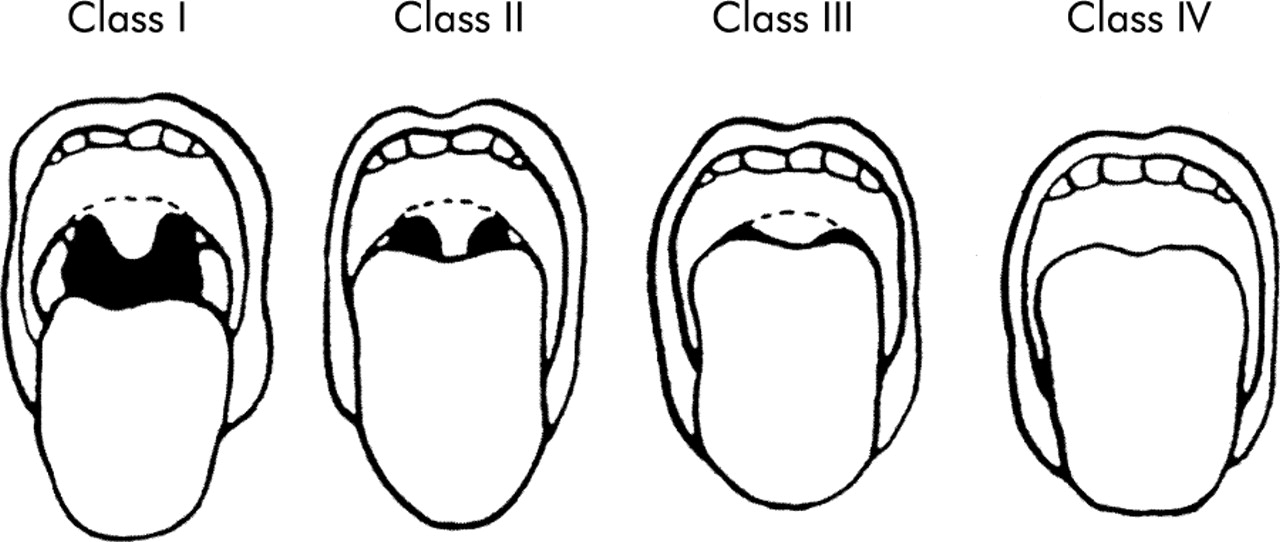
Mallampati oropharyngeal score (MS) measured during a breath hold at end-tidal inspiration with the mouth wide open, tongue maximally protruded, but without phonation or attempted elevation of the soft palate.
Reliability of measurements
A training session was held at one centre before study commencement during which the measurement techniques for all variables were standardised. Measurements were performed by a single investigator at each centre (CFR and BL). Intra-observer agreement was assessed for MS, NC, and TMD in a sample of 20 patients. On a sample of 50 randomly selected patients, tests of intra- and inter-observer agreement were performed for the measurement of TMA. For intra-observer reliability, measurements were made in random order on two occasions separated by several days. For inter-observer reliability, measurements were made at one centre and repeated in random order on duplicate images at the other centre in a blinded fashion.
Polysomnography
Each patient had full overnight polysomnography within 12 weeks of the initial assessment, reflecting the waiting times in our facilities at the time of the study. Polysomnography was performed using methodology, instrumentation, and analysis standardised between both sleep centres according to the recommendations on syndrome definition and measurement techniques published by the American Academy of Sleep Medicine.15 Polysomnograms were scored by technicians at the respective sites according to usual clinical practice. OSA was defined as an apnoea-hypopnoea index (AHI) of ⩾5/hour of total sleep time.
Statistical analysis
The rationale and methodology for the statistical analysis are outlined in detail in the supplement available online at the Thorax website (http://www.thoraxjnl.com/supplemental). A summary of the analysis is given here. Spearman rank correlation, to account for outlying measurements, was used to assess intra- and inter-observer reliability in the craniofacial measurements. SPSS Version 10.0.7 was used for all other analyses. The statistical strategy in this study was to determine which clinical, anthropometric, and craniofacial variables could be broadly applied to predict which patients were more likely to have OSA. The clinical variables of interest were age, BMI, NC, MS, TMA, TMD, and Epworth Sleepiness Scale. First, three Hotelling’s T2 analyses examined the relationship between (1) sex, (2) ethnic group, and (3) OSA and the clinical variables. The sample of patients was then randomly divided into two groups of 120 and 119 patients balanced with respect to sex, ethnicity, and OSA status. Discriminant function analysis was applied to the initial group of 120 patients to generate an equation using the clinical variables to predict whether a patient was more likely to have OSA or to be normal. A receiver operator characteristic curve (ROC) was also plotted to assess the equation in terms of sensitivity and specificity and for comparison with other previously published prediction equations. The second group of 119 patients was used to perform a prospective data analysis (cross validation) to assess the performance of the equation in a different but comparable group from the one in which it was originally developed. Finally, an analysis of covariance (ANCOVA) was performed to effectively make all patients equivalent for BMI, NC, and ethnic group in order to determine whether the relationship between selected clinical variables from the discriminant analysis was still significant when the group of patients was statistically rendered equivalent on these three variables. Additionally, several different cut-offs for the definition of OSA (AHI ⩾5, ⩾10, ⩾15, ⩾30) were tested to determine whether the same variables were significant for more rigorous definitions of OSA. Summary data are presented as mean (SD).
RESULTS
Demographic data summarised by group differences in disease category, ethnic group, and sex are shown in table 1. Of the 239 patients, 201 had OSA (AHI ⩾5). As a group, these patients were middle aged (49 (12) years), moderately obese (BMI 29.5 (6.3) kg/m2), and had moderate to severe OSA (AHI 31.9 (22.2)/h). All of the Hong Kong subjects (n = 154) and 10 of the Vancouver subjects were Asian; the remaining 75 Vancouver subjects were white. The majority (83%) were male. There was no change in body weight between the performance of the anthropometric measurements and the polysomnogram.
Group differences by disease category, ethnicity and sex†
Spearman rank correlation indicated intra-observer agreement (confidence intervals) of 0.81 (0.56 to 0.92) for MS; 0.97 (0.93 to 0.99) for NC: and 0.85 (0.71 to 0.90) for TMD. For TMA, intra-observer agreement was 0.91 (0.87 to 0.94) and inter-observer agreement was 0.83 (0.71 to 0.90). Values greater than 0.80 indicate acceptable reliability.
Hotelling’s T2 analyses of OSA and clinical variables
The results of the initial T2 analyses (OSA defined as AHI ⩾5) of the full demographic data set are provided in table 1. Patients with OSA had higher MS, larger TMA, and higher AHI than subjects without OSA. Asians had higher MS and shorter TMD than whites. Men had larger NC and higher AHI than women. Although the proportion of women was somewhat greater among whites, this was not significant. Because of their small numbers, it was not possible to repeat the same analyses on the women as a subgroup. When women were excluded from the analysis, there were no differences in the overall results when comparing groups by disease category or ethnicity, or in the multivariate analyses.
Discriminant analysis
From the preceding analyses a subset of potentially useful predictor variables including TMA, MS, age, BMI, NC and TMD was selected for a discriminant analysis. This analysis confirmed that these variables could be used to discriminate between patients with OSA and normal subjects. The size of each correlation (function) described in table 2 reveals the strength of the relationship between that predictor and OSA. Patients with OSA had, in order of importance, significantly higher MS, larger TMA, larger NC, higher BMI, and were older than normal subjects. An equation was derived from this analysis to categorise patients as either OSA or normal (table 3). When this equation was applied to the initial set of 120 patients from which it was derived, it correctly classified 86% of the patients. When applied prospectively to the second set of 119 patients its performance was comparable, correctly classifying 82% of patients as either OSA or normal.
Discriminant function analysis for the prediction of OSA (AHI ⩾5)†
Prediction equations for the presence or absence of OSA (AHI ⩾5)*
Analysis of covariance (ANCOVA)
Following the positive results of the discriminant analysis, the data from the 120 and 119 patients were again pooled for the ANCOVA. The purpose of the ANCOVA was to examine the relationship between OSA and MS, TMA, TMD, and age after statistically removing prior differences in three potentially important confounding variables—BMI, NC, and ethnic group. By treating ethnic group as an independent variable rather than a covariate, differences between ethnic groups could also be examined separately after removing prior differences in BMI and NC. BMI was significantly related to the set of dependent variables, as was NC and ethnic group (p<0.05). Thus, these three variables could be used to statistically render patients as if they had all scored equally on these variables. It is notable that there was no interaction between OSA and ethnic group. The relationship between OSA and age, MS, TMA and TMD could therefore be examined without regard to ethnic group; also investigation of ethnic group could proceed independently of OSA status. In addition, we were interested in determining whether the relationship remained stable using varying cut off levels of AHI to define OSA (⩾5, ⩾10, ⩾15, and ⩾30).
OSA
The set of dependent variables was related significantly to OSA (p<0.05). Follow up ANOVAs, with Bonferroni corrections to control the error rate, showed that age, MS, and TMA distinguished patients with OSA from normal subjects (p<0.05). In order of importance, these comparisons revealed that OSA patients were older than normal subjects (M = 49.27 v 44.08), had larger TMA (M = 161.17 v 148.92) and had higher MS (M = 3.71 v 3.37).
Ethnic group
After removal of prior differences in BMI and NC, Asians differed from whites in MS, TMD and TMA. In order of importance, Asians had higher MS, smaller TMD, and larger TMA than white subjects (p<0.05).
Varying definitions of OSA
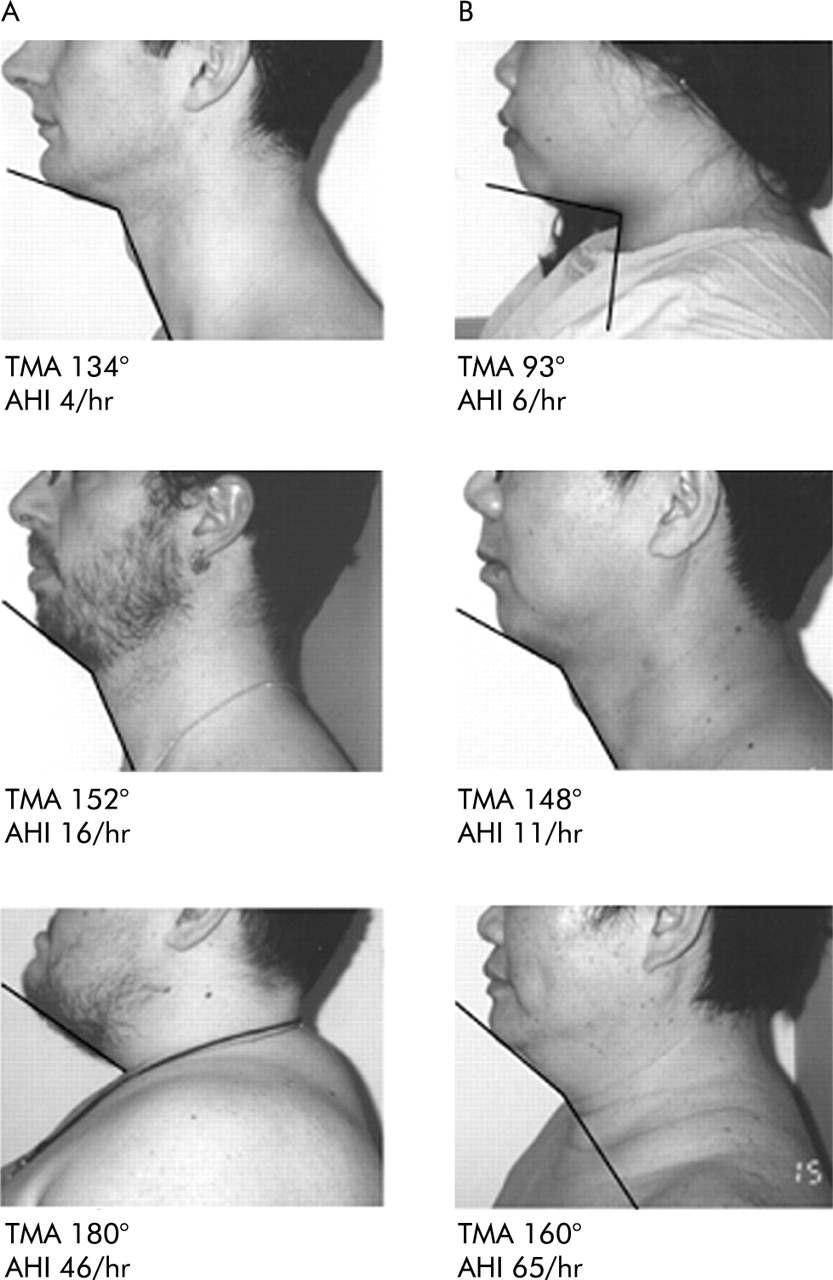
For each definition of OSA (AHI ⩾5, ⩾10, ⩾15, and ⩾30), increasing age, MS, and TMA were significantly associated with the presence of OSA (table 4). ROC curves of the predictive equations for different degrees of OSA severity are shown in fig 3. The area under the curve (AUC) was similar for each cut off (0.705 for AHI ⩾5; 0.676 for AHI ⩾10; 0.696 for AHI ⩾15; and 0.713 for AHI ⩾30). Figure 4 shows examples of the TMA measurement in white and Asian patients with different degrees of severity of OSA.
Comparisons between subjects with OSA and normal subjects for different cut off values for apnoea-hypopnoea index after adjustment for BMI, neck circumference, and ethnicity†

Receiver operator characteristic curves for the predictive equations using different cut off values of apnoea-hypopnoea index (AHI) for the definition of obstructive sleep apnoea: (A) AHI ⩾5, (B) AHI ⩾10, (C) AHI ⩾15, (D) AHI ⩾30. AUC = area under the curve.

Lateral photographs of the head and neck region showing examples of the thyromental angle in (A) white and (B) Asian patients with varying degrees of severity of obstructive sleep apnoea. TMA = thyromental angle (degrees); AHI = apnoea-hypopnoea index (/hour).
DISCUSSION
Our results indicate that patients with OSA of differing ethnicity and varying degrees of obesity have a crowded posterior oropharynx and a steep thyromental plane compared with non-apnoeic controls. After accounting for ethnic group, BMI and NC, patients with OSA are older and have larger MS and TMA. These craniofacial features probably reflect structural narrowing of the upper airway that contributes directly to the pathogenesis of upper airway obstruction in OSA. A crowded posterior oropharynx and a steep thyromental plane appear to be particularly useful clinical markers of OSA since they remain strong predictors even after correction for two important confounding variables—ethnicity and obesity—and over a wide range of cut-off values for the definition of OSA.
Whether clinical features can be reliably used to predict OSA among suspected individuals is still controversial.16–18 Ross and co-workers8 conducted a systematic review and meta-analysis of the literature regarding the diagnosis of OSA. Among the articles reviewed were eight studies reporting prediction equations. The pooled estimates of these models were 66.5 (14)% for sensitivity and 88.7 (4.9)% for specificity. Rowley and colleagues prospectively evaluated four clinical prediction equations for the diagnosis of OSA and the prioritisation of patients for polysomnography.9 The performance characteristics of these equations were similar with AUCs ranging from 0.669 to 0.736, comparable to those of the ROC curves for the prediction equation in our study. The authors concluded that these models could be used as part of a clinical pathway to prioritise patients for polysomnography.
Several craniofacial characteristics have been shown to be associated with the development and severity of sleep disordered breathing. The most commonly reported abnormalities include an inferiorly positioned hyoid bone, a posteriorly placed maxilla and mandible, an enlarged tongue and soft palate, and a smaller velopharyngeal cross sectional area.19–23 These craniofacial abnormalities have been reported in both white and Asian patients with OSAHS.24,25 Their measurement, however, requires the use of imaging modalities such as cephalometry and computed tomography, thus limiting their clinical utility. Most previous prediction models based on clinical variables have failed to include craniofacial measurements.
Few studies have reported the use of clinically derived craniofacial measurements in the prediction of OSA. Kushida and colleagues reported the development of a model based on BMI, NC, and oral cavity measurements.10 This model had a sensitivity of 97.6% and a specificity of 100% for the detection of OSA based on an AHI of ⩾5. The prevalence of OSA in the study by Kushida et al was 85% and analyses for different cut-off values for AHI were not performed. The results were strongly influenced by the large difference in BMI between patients with OSA and controls. This model required the performance of several complicated intraoral measurements using calipers, and it is questionable whether it would be suitable for routine clinical use. Friedman and colleagues examined the utility of various clinical features including upper airway measurements that predict a difficult endotracheal intubation.26 In a study of 172 patients they found that a modified MS, tonsil size and BMI (but not TMD) were predictive of OSA. In combination, these measurements accounted for 20% of the variance in respiratory disturbance index (RDI). Their analysis did not account for the potential interaction between BMI and the upper airway variables. Schellenberg and associates27 investigated several upper airway bony and soft tissue structural abnormalities for their ability to predict OSA after adjustment for important confounding factors. In a cohort of 420 subjects they measured the presence or absence of enlargement of the tonsils, uvula and tongue, low lying soft palate, retrognathia, overjet, and lateral pharyngeal narrowing. After adjusting for BMI and NC, only lateral pharyngeal narrowing and tonsillar enlargement were associated with OSA. Skeletal features such as overjet and retrognathia were not significant predictors. A subgroup analysis of women yielded no significant associations, probably as a consequence of the small sample size. In that study one investigator performed all the morphometric measurements and intra and inter-observer agreement were not assessed.
We chose simple clinical measurements of upper airway morphology such as the MS, TMD, and TMA because they are easy to perform. The MS has been used by anaesthetists for many years to help predict the degree of difficulty of endotracheal intubation.14 It reflects the amount of soft tissue in the posterior oropharynx relative to its skeletal constraints. The TMD represents the position of the chin relative to the thyroid cartilage and may be related to the length of the anterior cranial base. The MS and TMD have been shown to correlate with both difficult endotracheal intubation and OSA.26–28 The TMA has not been reported previously. To obtain an objective measurement of this feature of the craniofacial profile for the purpose of this study, we chose to determine the TMA from a lateral photograph of the head and neck obtained in a standardised fashion. We believe this angle reflects features of both obesity and abnormal craniofacial skeletal structure. Central obesity with accumulation of adipose tissue in the submental region will result in a large TMA. A short TMD or anterior cranial base will also result in a large TMA. Since the majority of patients with OSA have evidence of both obesity and craniofacial abnormalities,2 it is not surprising that TMA emerged as a significant predictor of OSA in our study. A high MS indicates a crowded posterior oropharynx which can be caused by obesity or craniofacial abnormality, or a combination of both. The predictive value of a large TMA and a high MS—after adjusting for ethnicity, BMI and NC, and for different AHI cut-off values for the definition OSA—indicates a strong relationship between these two measurements and OSA. Both BMI and NC have previously been shown to correlate well with OSA, and both emerged as significant variables in our predictive equation, although less so than MS and TMA. Symptoms were not included in our predictive equation; a previous study found that they do not differentiate reliably between patients with and without OSA.29 Our results show that a simple clinical assessment of anthropometric features and craniofacial structure can help predict the presence of OSA.
Tsai and associates recently developed a decision rule for the diagnosis of OSA based on similar features of upper airway morphology including cricomental space (the perpendicular distance to the skin of the neck from the midpoint of a line joining the cricoid to the mentum); pharyngeal grade (similar to the MS); and overbite.30 Use of the decision rule allowed these investigators to confidently confirm or exclude OSA in 44% of patients. These results, together with our data, strongly suggest that clinical measurements from the craniofacial profile are good candidates for inclusion in the development of clinical prediction algorithms for the diagnosis of OSA and the prioritisation of patients for polysomnography. Our results extend the potential utility of these simple clinical measurements by demonstrating their applicability to patients of differing ethnicity and degrees of obesity.
We found that Asians had higher MS, shorter TMD and larger TMA, and tended to have more severe OSA than white subjects. Although the shorter TMD might suggest retrognathia, previous studies have shown that Asians have a more protruded maxilla and mandible.31 We suspect that the shorter TMD in Asians may be explained by a shorter anterior cranial base reflecting their smaller anteroposterior facial dimensions.32 Li and associates compared two consecutive series of 50 Asian and 50 white men with OSA.6 When matched for obesity, Asians had more severe OSA than whites. After controlling for the severity of OSA, Asians were less obese than whites and had a more anteriorly positioned maxilla and mandible but a shorter anterior cranial base dimension (p<0.0001). Although the TMD did not differ between patients with OSA and normal controls in our study, the shorter TMD in Asians could contribute to a larger TMA and steeper thyromental plane in patients with OSA in this ethnic group. The higher MS and shorter TMD in Asians may reflect abnormalities of craniofacial anatomy that contribute to structural narrowing of the upper airway independent of obesity. The higher MS in Asians, reflecting more severe posterior oropharyngeal narrowing, might also explain why Asian men have more severe OSA than white men when matched for age and BMI.6 A few of our subjects (17%) were women and, as shown in previous studies, they had smaller neck circumferences and less severe OSA than the men. The TMA and MS did not differ significantly between men and women.
Our study has certain limitations that may have an impact on the generalisability of our findings. There was a high prevalence of OSA in our sample, as defined by our a priori definition of AHI ⩾5. We chose this definition to correspond with the generally accepted criteria proposed by the American Academy of Sleep Medicine.15 We performed post hoc analyses using different definitions for OSA which indicated that the predictive variables retained their utility over a wide range of cut-off values for AHI. Furthermore, discriminant analysis allows one to specify that prior probabilities are based on actual rather than equal group sizes, thus avoiding the problem of spuriously increased specificity. We studied only Asians and whites, so our results may not be applicable to other ethnic groups. There is a clear need for more data on the manifestations of sleep disordered breathing in different ethnic groups.
In conclusion, we have shown that risk factors for OSA such as obesity and craniofacial features that reflect structural narrowing of the upper airway are readily identified and can easily be incorporated into the routine physical examination. Patients with OSA of differing ethnicity and varying degrees of obesity have a crowded posterior oropharynx and a steep thyromental plane. Recognition of these abnormalities in the craniofacial profile should alert the physician to the possibility of OSA.
REFERENCES
Supplementary materials
Supplementary Data
This web only file has been produced by the BMJ Publishing Group from an electronic file supplied by the author(s) and has not been edited for content.
Files in this Data Supplement:
- Data supplement 1 - Online supplement
Footnotes
-
Supported by British Columbia Lung Association