Article Text

Abstract
Background: Bronchial provocation tests such as exercise, methacholine (MCH), and adenosine-5′-monophosphate (AMP) challenges are used extensively in the diagnosis of asthma. A study was undertaken to determine whether exhaled nitric oxide (eNO) can be used to diagnose asthma in patients with non-specific respiratory symptoms and to compare this test with conventional provocation tests.
Methods: Patients with non-specific respiratory symptoms and normal spirometric parameters were included in the study. eNO was measured and exercise, MCH and AMP challenges performed in all subjects. Patients were defined as asthmatic based on clinical follow up 24 months after testing.
Results: Forty patients were considered asthmatic and 45 were not. The area under receiver operating characteristic curves gave values of 0.896 for eNO, 0.781 for exercise, 0.924 for MCH, and 0.939 for AMP (p = 0.033, 0.575 and 0.085 for eNO v exercise, MCH and AMP respectively). From our data, a cut off value of NO >7 ppb at a flow rate of 250 ml/s best differentiates between asthmatics and non-asthmatics (sensitivity 82.5%, specificity 88.9%). Optimal cut off values for other tests were exercise: ΔFEV1 ⩾10% (sensitivity 57.9%, specificity 100%); PC20-MCH: ⩽3 mg/ml (sensitivity 87.5%, specificity 86.7%); and PC20-AMP: ⩽150 mg/ml (sensitivity 89.5%, specificity 95.6%).
Conclusions: Measurement of eNO can be used as a safe, simple and rapid test for the diagnosis of asthma and is as good as bronchial provocation tests.
- AMP, adenosine 5′-monophosphate
- eNO, exhaled nitric oxide
- FEV1, forced expiratory volume in 1 second
- FVC, forced vital capacity
- MCH, methacholine
- NO, nitric oxide
- asthma
- exhaled nitric oxide
- exercise
- methacholine
- adenosine 5′-monophosphate (AMP)
- diagnosis
Statistics from Altmetric.com
- AMP, adenosine 5′-monophosphate
- eNO, exhaled nitric oxide
- FEV1, forced expiratory volume in 1 second
- FVC, forced vital capacity
- MCH, methacholine
- NO, nitric oxide
A diagnosis of asthma is made on the basis of compatible clinical symptoms and signs together with the presence of reversible airway obstruction as shown by pulmonary function testing.1,2 When in doubt, the diagnosis may be confirmed by performing bronchial provocation tests such as exercise, methacholine (MCH), histamine, or adenosine 5′-monophosphate (AMP) challenges to demonstrate the presence of airway hyperreactivity.2–5 Although provocation tests are of great value, they are time consuming, costly, and bear a small risk of inducing severe bronchospasm.3 Furthermore, no single provocation test is considered the “gold standard” for the diagnosis of asthma.2–4 There is also controversy as to what extent airway hyperreactivity correlates with the degree of airway inflammation.6,7
Nitric oxide (NO) is detectable in the exhaled air of humans. An increase in the concentration of exhaled nitric oxide (eNO) has been found in asthmatic patients including those with mild disease.9,10 Levels of eNO parallel the inflammatory process in the asthmatic airway11–13 and treatment with anti-inflammatory drugs such as corticosteroids results in a marked reduction in these levels.14
Increased eNO is found in other inflammatory respiratory disorders including sinus disease, viral upper respiratory tract infection and lung transplant rejection,15–18 but not in patients with chronic obstructive pulmonary disease and cystic fibrosis.19,20 eNO levels are lower in cigarette smokers than in non-smoking controls.21
Although much has been published about the effects of various interventions on eNO levels, such as bronchial provocation tests22,23 and anti-asthma medications,14 until recently little had been published regarding the clinical utility of this test. Over the last 2 years several publications have shown that eNO is an excellent tool for the diagnosis of asthma.24–26 All of these studies used bronchial hyperreactivity and/or reversible airway obstruction to define asthma. We performed a prospective study in a select group of subjects using a clinical follow up of 24 months to define asthma, to determine the value of using eNO as a diagnostic test for asthma, and compared this with conventional bronchial provocation tests.
METHODS
Subjects
Patients with non-specific respiratory symptoms of at least 3 months’ duration referred to the outpatient pulmonary clinic of Hadassah University Hospital for diagnostic evaluation and in whom the consulting respiratory physician considered the possibility of a diagnosis of asthma were included in the study. Patients with a clear alternative diagnosis, a previous diagnosis of asthma, or evidence of airway obstruction on baseline spirometry (forced expiratory volume in 1 second (FEV1) <75% predicted or FEV1/forced vital capacity (FVC) <70%) or reversibility of FEV1 ⩾12% and patients on asthma medication of any type were excluded from the study. Chest and sinus radiographs were performed at the discretion of the physician.
Patients with acute upper respiratory tract infection were asked to return for testing 4 weeks after resolution of symptoms.
Subjects underwent initial measurement of eNO followed by bronchial challenges using MCH, exercise, and AMP. Provocation tests were performed in random order and in a blinded fashion (results of previous challenges and eNO were unknown to the technician performing the study). A minimum of 4 hours washout time was observed between each challenge. This complies with published recommendations.3
Local ethics committee approval and informed consent from all participants was obtained for performance of the study.
Follow up
All patients were assessed by the investigating physicians 24 months after performing provocation studies. A final diagnosis of doctor diagnosed asthma was made by a pulmonary physician (one of the authors) in a blinded fashion—that is, without knowledge of the results of the provocation tests. Patients with documented variability in FEV1 of ⩾12% at any time over the follow up period, whether in response to bronchodilators given on a single test day (“reversibility”) or as determined over time (with or without inhaled corticosteroids or other asthma medication; “variability”), were considered asthmatics. Alternatively, a final diagnosis of asthma was based on patient history only (three or more episodes of doctor recorded wheezing, dyspnoea or cough relieved by bronchodilators) even in the absence of spirometric documentation of reversible airway obstruction. Patients in whom asthma did not manifest within 2 years were considered non-asthmatics. Patients lost to follow up were excluded from further analysis.
Performance of spirometric tests/challenges
Spirometric tests were performed using a pneumotachograph based system (Vitalograph Compact, Buckingham, UK). Bronchial challenges for MCH (Spectrum Chemical Corp, Gardena, CA, USA), AMP (Sigma-Aldridge, Rehovot, Israel), and exercise were performed according to recommended guidelines and as previously described.3,4
Measurement of exhaled NO
Exhaled nitric oxide was measured using a chemiluminescence analyser (LR 2000, Logan Research, Rochester, UK). Patients performed a slow vital capacity exhalation manoeuvre according to recommended guidelines.17,27 Resistance, mouth pressure (5 cm H2O), and flow rate (250 ml/s) were kept constant for the duration of the manoeuvre using a visual aid for patient guidance. eNO levels were recorded during the plateau phase and coinciding with the plateau phase for exhaled CO2. Three successive recordings were made and the mean value was recorded.
Calibration was performed using 0 and 110 parts per billion (ppb) calibration gas cylinders. Ambient NO levels were measured daily and were always found to be <3 ppb.
Reference values for eNO in known non-atopic non-asthmatics and steroid naive asthmatics measured in our laboratory were as follows (median, 95% confidence intervals): normal subjects 5.3 ppb (4.90 to 6.97); asthmatics 19.2 ppb (15.15 to 28.82), (p<0.0001).
Data analysis
Comparison between tests was performed by constructing receiver operating characteristic (ROC) curves and measurement of area under the curve.28 In the ROC plot, the sensitivity (percentage true positive results) is plotted against the percentage false positive results (1 − specificity). The nearer the curve approaches the top left of the ROC plot, the greater the sum of sensitivity and specificity. ROC plots provide a pure index of accuracy of a test by demonstrating the limits of the test’s ability to discriminate between health and disease over the complete spectrum of operating conditions.29 Quantification of the overall diagnostic accuracy of a test can be expressed by calculating the area under the curve of the ROC plot and provides a value between 0.5 (no separation of test values in healthy and disease groups) and 1.0 (perfect separation). Comparison of AUC is performed according to the method of Hanley and McNeil.28
Using clinical follow up to define asthma, the sensitivity and specificity of increasing cut off values of eNO for the diagnosis of asthma were determined. Similar determinations were obtained for exercise, MCH, and AMP challenges. Optimal cut off values to differentiate asthmatics from non-asthmatics were determined from the highest value obtained by adding sensitivity and specificity.5
The diagnostic value of eNO was also determined using positive bronchial provocation tests to define asthma. The optimal cut off value of eNO for the diagnosis of asthma was calculated as above and, using this value, sensitivity, specificity, positive and negative predictive values were determined.
Values for provocation tests and eNO are expressed as medians and interquartile ranges (25–75%). Correlations between NO and other provocation tests were determined in the entire cohort and in the asthmatic group of patients using linear regression analysis. In the asthmatic group, subjects with PC20 values higher than the maximal concentration tested were excluded from analysis of correlations only but included for all other analyses.
Comparison between asthmatic and non-asthmatic groups was performed using the Mann-Whitney test. A p value of <0.05 was considered significant.
RESULTS
Symptoms for which patients were referred were as follows: cough (n = 39), dyspnoea (n = 32), cough and dyspnoea (n = 14), wheeze (n = 2), cough and wheeze (n = 1), dyspnoea and wheeze (n = 1), and chest tightness (n = 2).
Ninety patients completed the initial evaluation including bronchial provocation and eNO determinations. Of these patients, adequate follow up could not be obtained in five. We were left with 85 patients of whom 40 could clearly be classified as asthmatic. The 45 patients in whom a definitive diagnosis of asthma could not be made after 2 years of follow up were considered “non-asthmatic”. Because follow up was blinded, final diagnosis in the non-asthma group was determined retrospectively at the end of the 2 year period. Of the non-asthmatics, symptoms resolved over the 2 years in 16 (35.5%), were attributed to chronic sinusitis, postnasal drip or allergic rhinitis in 10 (22%), to reflux in four (9%), to anxiety attacks in two (4.5%), to cardiac failure in two (4.5%), and to poor physical conditioning in six (13.4%). No definitive diagnosis was made in five (11.1%) of the remaining cases.
Demographic data and values for lung function, bronchial provocation tests, and eNO levels in asthmatics and non-asthmatics are shown in table 1 and fig 1. The median (interquartile range) eNO level in asthmatics was 12.7 ppb (8.25–17.1) compared with 3.8 ppb (3.05–5.25) in non-asthmatics (p<0.0001).
Demographic data, spirometric parameters, and values for exhaled nitric oxide and bronchial provocation tests in asthmatic and non-asthmatic patients

(A) Exhaled nitric oxide levels (ppb), (B) percentage fall in FEV1 after exercise, (C) PC20 for methacholine (mg/ml), and (D) PC20 for adenosine 5′-monophosphate (mg/ml) in asthmatic and non-asthmatic patients (as defined by clinical follow up). Medians and 95% confidence intervals for each group are shown in table 2.
Comparison between tests for the diagnosis of asthma
Areas under the curve (AUCs) obtained from ROC curves for eNO, exercise, MCH, and AMP were 0.896, 0.781, 0.924, and 0.939, respectively (fig 2). Comparison of AUCs showed that exercise was significantly lower than all other tests but that eNO was similar to MCH and AMP. Comparison of the AUC for eNO with other tests was as follows: exercise, p = 0.033; MCH, p = 0.57; AMP, p = 0.085.

ROC curves obtained for (A) exhaled nitric oxide, (B) percentage fall in FEV1 after exercise, (C) PC20 for methacholine, and (D) PC20 for AMP in asthmatic and non-asthmatic patients. Area under the curve (AUC) was 0.896, 0.781, 0.924, and 0.939, respectively.
Optimal values to define asthma for eNO, MCH, AMP, and exercise
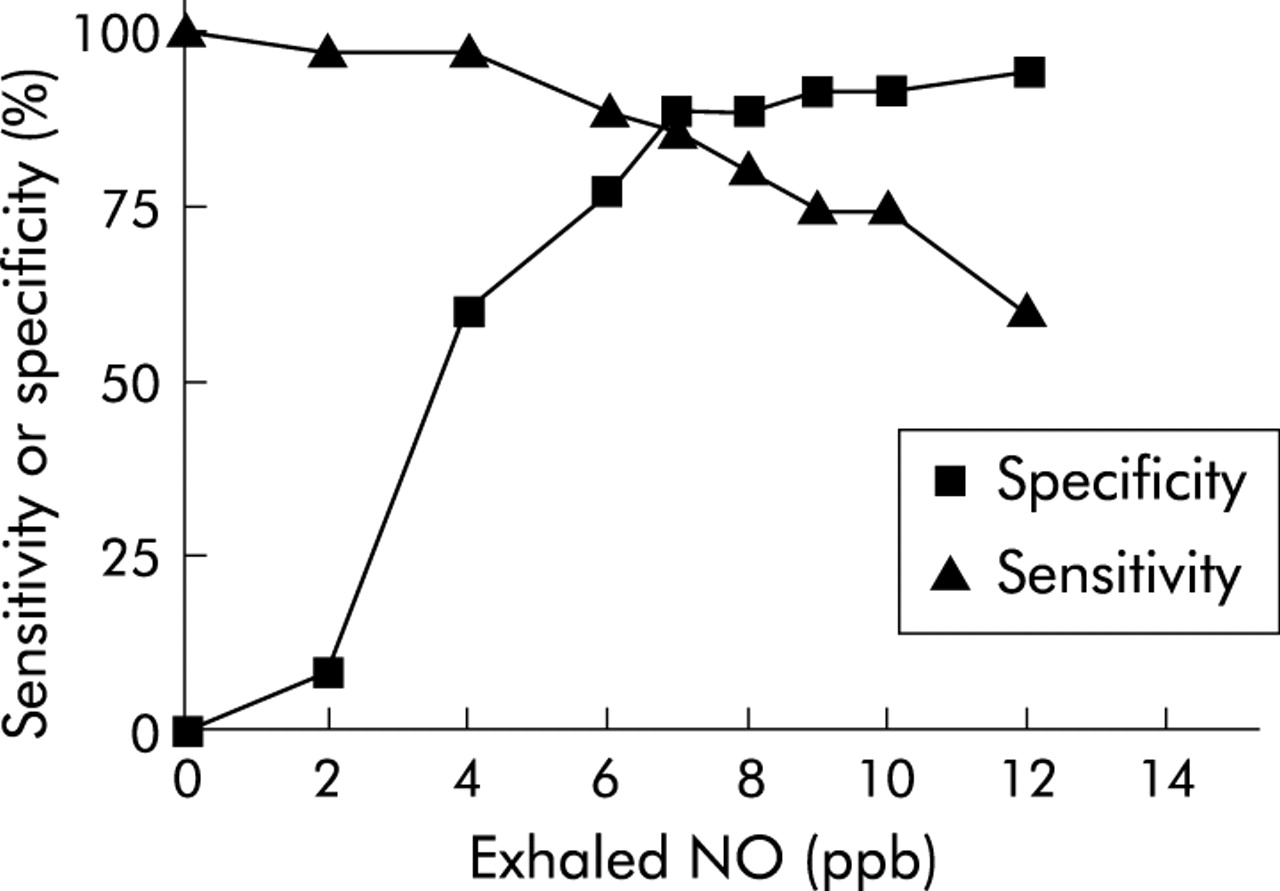
To define the optimal cut off value for eNO to differentiate asthmatics from non-asthmatics, we constructed curves for sensitivity and specificity of increasing eNO values for the diagnosis of asthma (fig 3) where sensitivity is the number of asthmatics with high eNO/total number of asthmatics and specificity is the number of non-asthmatics with low eNO/total number of non-asthmatics. The highest sum of these values was considered to be the optimal value to be used as a cut off value for asthma.5 A value of eNO >7 ppb gave a sensitivity of 82.5% and specificity of 88.9% for the diagnosis of asthma.

Sensitivity and specificity of increasing cut off values for exhaled nitric oxide in the diagnosis of asthma. An optimal value to differentiate between asthmatics and non-asthmatics was obtained from the highest sum obtained from adding sensitivity and specificity and corresponded to 7 ppb.
From our data we also determined the optimal cut off values for exercise, MCH, and AMP that differentiate between asthma and non-asthma (table 2).
Optimal cut off values for eNO and bronchial provocation tests for the diagnosis of asthma
eNO as a diagnostic test when provocation tests are used to define asthma
To validate the cut off value we obtained for eNO (>7 ppb) for diagnosing asthma based on clinical follow up, we also calculated the optimal cut off value for eNO when a positive provocation test was used to define asthma (MCH ⩽3 mg/ml, AMP ⩽150 mg/ml, exercise ΔFEV1 ⩾10%). The sum of the sensitivity and specificity obtained for increasing cut off values of eNO was calculated and the optimal value for eNO was that which gave the highest sum as detailed above. The optimal cut off value for eNO compared with MCH, AMP, and for exercise was the same for all three tests as that obtained using a clinical definition of asthma (>7 ppb). Sensitivity, specificity, positive and negative predictive values for eNO >7 ppb using various gold standards for defining asthma are shown in table 3.
Sensitivity, specificity, positive predictive value (PPV) and negative predictive value (NPV) of eNO >7 ppb for the diagnosis of asthma using different parameters to define asthma
Correlations
Correlations between eNO and exercise (percentage change in FEV1), log PC20 for MCH and AMP were performed in the whole study cohort and repeated in asthmatics only. A significant linear correlation with eNO was found for exercise, MCH, and AMP when all subjects were included, with log-AMP giving the best correlation followed by exercise. Values were r2 = 0.41, p<0.0001 for log-AMP; r2 = 0.31, p<0.0001 for exercise; and r2 = 0.21, p<0.0001 for log-MCH. When only asthmatics were included and those with assumed values for AMP (>400 mg/ml) and MCH (>8 mg/ml) were excluded, a significant correlation was observed for exercise only but not for log-AMP or for log-MCH (r2 = 0.21, p = 0.003 for exercise; r2 = 0.06, p = 0.17 for log-AMP; and r2 = 0.002, p = 0.8 for log-MCH; fig 4).

Correlation between eNO and (A) log PC20 for MCH, (B) log PC20 for AMP, and (C) change in FEV1 following exercise in asthmatic subjects. A significant correlation was observed for exercise but not for log-MCH or for log-AMP (r2 = 0.21, p = 0.003 for exercise; r2 = 0.06, p = 0.17 for log-AMP; and r2 = 0.002, p = 0.8 for log-MCH). Assumed values (PC20 ⩾8 mg/ml for MCH and ⩾400 mg/ml for AMP) were excluded from this analysis.
DISCUSSION
We have performed a prospective study to compare the value of eNO for the diagnosis of asthma with conventional diagnostic tests in patients with non-specific respiratory symptoms. Area under the curve analysis obtained from ROC curves showed that exhaled eNO is a better test than exercise and is as good as MCH and AMP as an aid to the diagnosis of asthma. The optimal value of eNO for the clinical diagnosis of asthma was >7 ppb at a flow rate of 250 ml/s, with a sensitivity and specificity of 82.5% and 88.9%, respectively. This sensitivity and specificity was similar to that obtained with MCH (PC20 ⩽3 mg/ml) and superior to exercise (ΔFEV1 ⩾10%), although AMP (PC20 ⩽150 mg/ml) was superior to other tests including eNO.
For our study we chose to define asthma by clinical follow up. This approach has several advantages. Provocation tests have a significant false positive and negative yield and are therefore in themselves somewhat problematic when used as a gold standard for the diagnosis of asthma. Furthermore, the primary aim of our study was to compare the diagnostic value of eNO with these tests. This necessarily excluded them from inclusion in the “gold standard” for the definition of asthma in our study. Rather, we chose a clinical “gold standard” which also included reference to changes in lung function with either bronchodilator or corticosteroids. Irrespective of the “gold standard” chosen, there is always a degree of uncertainty at a single point in time regarding the diagnosis of asthma in some patients. We attempted to overcome this problem by using a prolonged (24 month) follow up time, at which point patients were classified as having “doctor diagnosed asthma” or as “non-asthmatic”.
Although several studies have shown that eNO is raised in steroid naive asthmatics and that levels correlate with airway inflammation,11–13 only a few studies have evaluated this test as a tool for the diagnosis of asthma. Chatkin et al30 showed that eNO may be used for diagnosing asthma in patients with chronic cough. Dupont et al24 found that measurement of eNO (using a cut off value of 16 ppb) yielded a specificity of 90% and a positive predictive value of >90% for the diagnosis of asthma. Deykin et al25 showed that measurement of eNO allows differentiation between asthmatic patients and healthy subjects, and Smith et al26 recently found that eNO is superior to spirometry and peak flow variation and comparable to sputum eosinophilia for the diagnosis of asthma. In contrast to our study, all of these studies used a positive initial response to bronchodilators or a positive challenge test to define the presence of asthma.
Like the studies of Dupont and Smith,24,26 we felt that performing diagnostic tests including eNO in patients in whom a definitive diagnosis has not yet been established—rather than testing known asthmatics and non-asthmatic controls—gives more meaningful information because it reflects the real clinical scenario in which we propose that eNO be used.
Physicians may be reluctant to dispense with bronchial provocation tests in favor of eNO for diagnosing asthma. Guidelines define asthma by the presence of reversible airways obstruction which therefore requires performance of spirometric tests and, if normal, bronchial provocation tests.1 Nevertheless, airway inflammation is also considered a key element in the diagnosis and pathogenesis of asthma and, while eNO is widely considered to reflect airway inflammation, spirometric testing is at best a poor and inconsistent indicator of inflammation.30 There is also controversy as to whether airway hyperresponsiveness as measured by bronchial provocation studies reflects airway inflammation.6,7 Measurement of eNO is extremely easy, quick, and safe to perform, while performance of bronchial provocation tests is time consuming, expensive and associated with some risk, albeit small, of inducing severe bronchospasm. It is therefore not unreasonable to suggest that eNO may be preferable or at least of comparable value to bronchial provocation studies for diagnosing asthma.
We found that an eNO level of >7 ppb is the optimal single cut off point for differentiating asthmatics from non-asthmatics. We obtained the same optimal cut off value for eNO irrespective of whether asthma was defined by clinical parameters, positive MCH challenge, positive AMP challenge, or by positive exercise test. This consistency adds considerable strength to the validity of the findings in our study. Using a higher or lower cut off value alters the specificity or sensitivity of this test and may be preferable in certain patients depending on pretest probability of asthma. eNO values of 4 ppb yield sensitivity and specificity similar to that of PC20 ⩽8 mg/ml for MCH (sensitivity 95.0%, specificity 57.8% for eNO, 92.5% and 66.7% for MCH), while an eNO value of 12 ppb is analogous to a positive exercise test (ΔFEV1 ⩾10%) (sensitivity 55%, specificity 95.6% for eNO, 57.9% and 100% for exercise). Clearly, the optimal cut off for eNO for a diagnosis of asthma will depend on the population studied. Our study was performed in a select group with a high prevalence of asthma (40/85, 47%) and different considerations would apply for diagnosing asthma in a less select group of subjects.
Considerable differences in absolute eNO values have been found in different centres. These are related to differences in technique used to measure eNO, the analyser used, and possibly ambient NO levels.17,27,31 For this study we used an expiratory flow rate of 250 ml/s. ATS guidelines recommend a flow rate of 50 ml/s, although the statement makes it clear that other flow rates can be used.27 Our study started before publication of the ATS guidelines and was performed in accordance with ERS guidelines which recommend flow rates of 10–15 l/min.17 eNO has been shown to discriminate between known asthmatics and healthy subjects over a wide range of flow rates (50–250 ml/s for online measurements).25 Although attempts have been made to standardise eNO measurements, caution should be used in extrapolating absolute values obtained in one centre to those obtained elsewhere.
In conclusion, we found that eNO can be used as a diagnostic test for asthma in patients presenting with non-specific respiratory symptoms. This test has high sensitivity and specificity for the diagnosis of asthma, is safe and easy to perform, and has a diagnostic value comparable to that of conventional bronchial provocation tests.
REFERENCES
Footnotes
-
Sponsors: none
-
The contributing authors have no competing interests related to this publication.