Article Text

Abstract
Background: The fractional concentration of nitric oxide (NO) in exhaled breath (FeNO) is increased in asthma. There is a general assumption that NO synthase (NOS) 2 in epithelium is the main source of NO in exhaled breath. However, there is no direct evidence to support the assumption and data from animal models suggest that non-inducible NOS systems have important roles in determining airway reactivity, regulating inflammation, and might contribute significantly to NO measured in exhaled breath.
Methods: Bronchial epithelial cells were obtained from healthy, atopic, and asthmatic children by non-bronchoscopic brushing. Exhaled NO (FeNO) was measured directly using a fast response chemiluminescence NO analyser. RNA was extracted from the epithelial cells and real time polymerase chain reaction was used to determine the expression of NOS isoenzymes. NOS2 was examined in macrophages and epithelial cells by immunohistochemistry.
Results: NOS1 mRNA was not detectable. NOS3 mRNA was detected in 36 of 43 samples at lower levels than NOS2 mRNA which was detectable in all samples. The median FeNO was 15.5 ppb (95% CI 10 to 18.1). There was a significant correlation between FeNO and NOS2 expression (R = 0.672, p<0.001). All epithelial cells exhibited NOS2 staining, whereas staining in the macrophages was variable and not related to phenotype.
Conclusions: Only NOS2 expression was associated with FeNO in respiratory epithelial cells obtained from children (R = 0.672; p<0.001). This suggests that FeNO variability is largely determined by epithelial NOS2 expression with little contribution from other isoforms.
- FeNO, fractional concentration of nitric oxide in exhaled breath
- NOS, nitric oxide synthase
- exhaled nitric oxide
- nitric oxide synthase
- epithelium
- asthma
- atopy
- children
Statistics from Altmetric.com
The fractional concentration of nitric oxide (NO) in exhaled breath (FeNO) is increased in a number of inflammatory disorders of the lung1–3 including asthma,4 leading to the proposal that FeNO could be a useful marker of airway inflammation.5 A large number of reports have used FeNO measurements, and there is considerable interest in this aspect of NO biology despite relatively limited understanding of the cellular source and physiological factors responsible for NO in exhaled air. Nitric oxide is synthesised by a family of NO synthase (NOS) enzymes. Neuronal NOS (NOS1) and endothelial NOS (NOS3) are constitutively expressed enzymes in the lung that produce NO in low amounts and have an absolute requirement for intracellular calcium/calmodulin. Inducible NOS (NOS2) is constitutively expressed in the human airway epithelium,6 but its expression can be upregulated many times by inflammatory agents.7 Epithelial cells and some inflammatory cells (including macrophages) in human lung express NOS2,6 and levels of FeNO are reduced in asthmatic8 and healthy subjects9 following administration of selective inhibitors of NOS2. Although there is no direct evidence, these observations support the assumption that NOS2 in the epithelium—with its large surface area—is the main source of NO in exhaled breath. However, data from animal models suggest that the non-inducible NOS systems have important roles in determining airway reactivity10 and regulating inflammation.11 These models have yielded conflicting results regarding the enzymatic source of FeNO; studies in mice have shown either NOS212 or NOS110 to be a major determinant of FeNO whereas, in rabbits, NOS3 is reported to contribute the bulk of NO in exhaled breath.13
This report attempts to address these potentially contradictory observations from studies in humans and animals. We studied epithelial cells and airway macrophages obtained from a unique unselected population of children in order to test the hypothesis that epithelial NOS2 is the major contributor to NO measured in exhaled breath.
METHODS
To compare levels of NOS in the epithelium with FeNO concentrations, we recruited 41 children (21 girls) of median age 10 years (range 6–16) admitted to Princess Margaret Hospital for a gastroscopy. Parents gave written informed consent for their children to participate. Exhaled NO levels were measured with a chemiluminescence analyser (Sievers Instruments Inc, CO, USA) using a standard single breath technique14 at a flow rate of 35 ml/s. All children undergoing routine gastroscopy were eligible for the study. Children with previous respiratory symptoms other than those that could be explained by mild asthma and children with evidence of reflux oesophagitis on biopsy were excluded from the analysis. Children were free of respiratory symptoms at the time of the study.
Blind brushing was performed to sample distal tracheal epithelial cells. Before gastroscopy, each child was anaesthetised and intubated. A cytology brush (BC 25105, Olympus, Australia) was inserted directly through the endotracheal tube, advanced until resistance was felt, and rubbed against the epithelial surface to sample cells. The brush was then withdrawn and agitated in 5 ml BEBM (Clonetics, CA, USA) to remove epithelial cells. This brushing procedure was repeated 3–5 times. Cell samples were immediately taken to the laboratory and processed within 15 minutes of sampling. An aliquot (10 µl) of the resulting cell suspension was taken to determine cell number using a haemocytometer. The suspension contained 95–98% epithelial cells with 2–5% macrophages which were then removed by positive selection. Briefly, 3 ml of the cell suspension was added to a culture dish that had been coated with CD-68 antibody. The plate was placed in a humidified incubator (37°C, 5% CO2) for 20 minutes to allow macrophages to adhere. The macrophages were removed from the plate with trypsin (0.25%). Cytospin slides were prepared in a subgroup of samples (four controls, two asthmatic subjects, one atopic subject) for staining with a monoclonal antibody to macrophages (DAKO, Australia) and a polyclonal antibody to NOS2 (Selby-Biolab, Australia). Samples were incubated with monoclonal primary antibody (1:50) for 1 hour followed by a 45 minute incubation with Alexa fluor 488-labelled secondary antibody (1:200; Bio Scientific, Australia). The polyclonal primary was then used at 1:50 for 1 hour, followed by an Alexa fluor 546-labelled secondary antibody (1:200, 45 min, Bio Scientific).
RNA was extracted from epithelial cells using the Qiagen RNeasy mini kit (Qiagen, Victoria, Australia). Cells were lysed in 350 μl RLT buffer before homogenisation using QIAShredder columns (Qiagen, Australia) and the lysate was added to the RNeasy columns. Total RNA was eluted in 50 μl RNase-free water. cDNA was synthesised from up to 0.5 μg of total RNA in a volume of 25 μl consisting of 1 × RT buffer, 10 mM deoxyribonucleotide triphosphates, 25 mM MgCl2, 50 µM random hexamers, 20 U/μl RNase inhibitor, and 50 U/μl Multiscribe reverse transcriptase (all from Applied Biosystems, NSW, Australia). Reactions were incubated at 25°C for 10 minutes, 48°C for 45 minutes, 95°C for 5 minutes, and then cooled to 4°C before storage at −80°C.
The β-actin primers and probes used for this study were obtained from Applied Biosystems (CA, USA) and, as such, the sequence data are proprietary. Primer and probe sequences for NOS2, NOS3 and NOS1 are given in table 1. Inducible NOS primers and probes were designed using the Primer Express software program (Version 1.5, Perkin-Elmer). The primers were designed to be intron spanning and a BLASTn search (National Center for Biotechnology Information, Bethesda, MD, USA) was performed to confirm the total gene specificity of the sequences.
Sequences of the TaqMan primers and probes used in the study
There has been discussion recently regarding the selection of housekeeping genes.17 We evaluated a panel of housekeeping genes (β-actin, 18S and HPRT) and found that HPRT was poorly correlated with β-actin or 18S expression, whereas β-actin and 18S expression were highly correlated. β-actin was chosen as the housekeeping gene because the level of expression was in the range expected for NOS2.
Expression of NOS2, NOS3, and NOS1 genes was quantified relative to the expression of β-actin using Taqman real time polymerase chain reaction (PCR). PCR was performed using the ABI Prism 7700 Sequence Detection System (Perkin-Elmer, CA, USA). cDNA was incubated in a 25 μl reaction volume containing 1 × Taqman Universal PCR Master Mix (Applied Biosystems, NSW, Australia), forward primer (10 μM), reverse primer (10 μM), and probe (200 nM). The cycles used were 50°C for 2 minutes, 95°C for 10 minutes, followed by 40 cycles of 15 seconds at 95°C and 60 seconds at 60°C. Signals were analysed by the ABI Prism Sequence Detection System software version 1.9.
Exhaled NO concentrations, NOS2 and NOS3 levels were skewed to the right so all values were transformed to their natural logarithm (ln) to achieve a normal distribution. Gene expression was expressed as a ratio of expression of β-actin and was calculated using the method of Pfaffl et al.18 Simple linear regression models were used to determine relationships between FeNO levels and NOS2 expression and between age and levels of FeNO and NOS2. Multiple linear regression was performed using a hierarchical procedure to examine the effect of NOS1 and NOS3 expression and age on the relationship between FeNO and NOS2 expression. All analyses were performed using SPSS 10.0 (SPSS Inc, Chicago, IL, USA).
RESULTS
The characteristics of the study participants are shown in table 2. The median number of epithelial cells obtained per sample was 2.05 × 10⁶ (95% CI 1.95 to 2.60). NOS2 mRNA was detectable in all samples. Expression of NOS1 mRNA was detectable in only 14 samples at levels below the reliable limit of detection for the TaqMan assay. Only seven samples did not have detectable levels of NOS3 but, overall, the expression was significantly lower than that of NOS2 (fig 1A).
Characteristics of healthy, healthy atopic, and atopic asthmatic subjects recruited to study

(A) Nitric oxide synthase expression in the epithelium. NOS levels are expressed as a ratio to β-actin. The median is the line bisecting the box, box limits represent 25th and 75th percentiles and whiskers extend to the maximum and minimum values. NOS1 levels were all below the limit of detection and are not therefore displayed. (B) Correlation between (ln) FeNO and (ln) NOS2 expression (R = 0.672, n = 43).
The median FeNO level was 15.5 ppb (95% CI 10 to 18.1) and was significantly higher in atopic children than in either healthy or asthmatic children (p<0.05). There was a significant correlation between FeNO and NOS2 expression in this cohort (R = 0.672, p<0.001; fig 1B). The relationship with NOS2 expression was stronger in asthmatic children (R = 0.828, p = 0.006) than in asymptomatic atopic (R = 0.752, p = 0.02) or healthy children (R = 0.525, p = 0.008). Age was a significant predictor of FeNO (p = 0.014) but not of NOS2 (p = 0.402). There were no significant correlation between FeNO and NOS1 or NOS3 expression. Adding NOS1 and NOS3 levels as explanatory variables to a hierarchical regression model did not explain more of the FeNO variability, but the inclusion of age increased the R value marginally from 0.672 to 0.725.
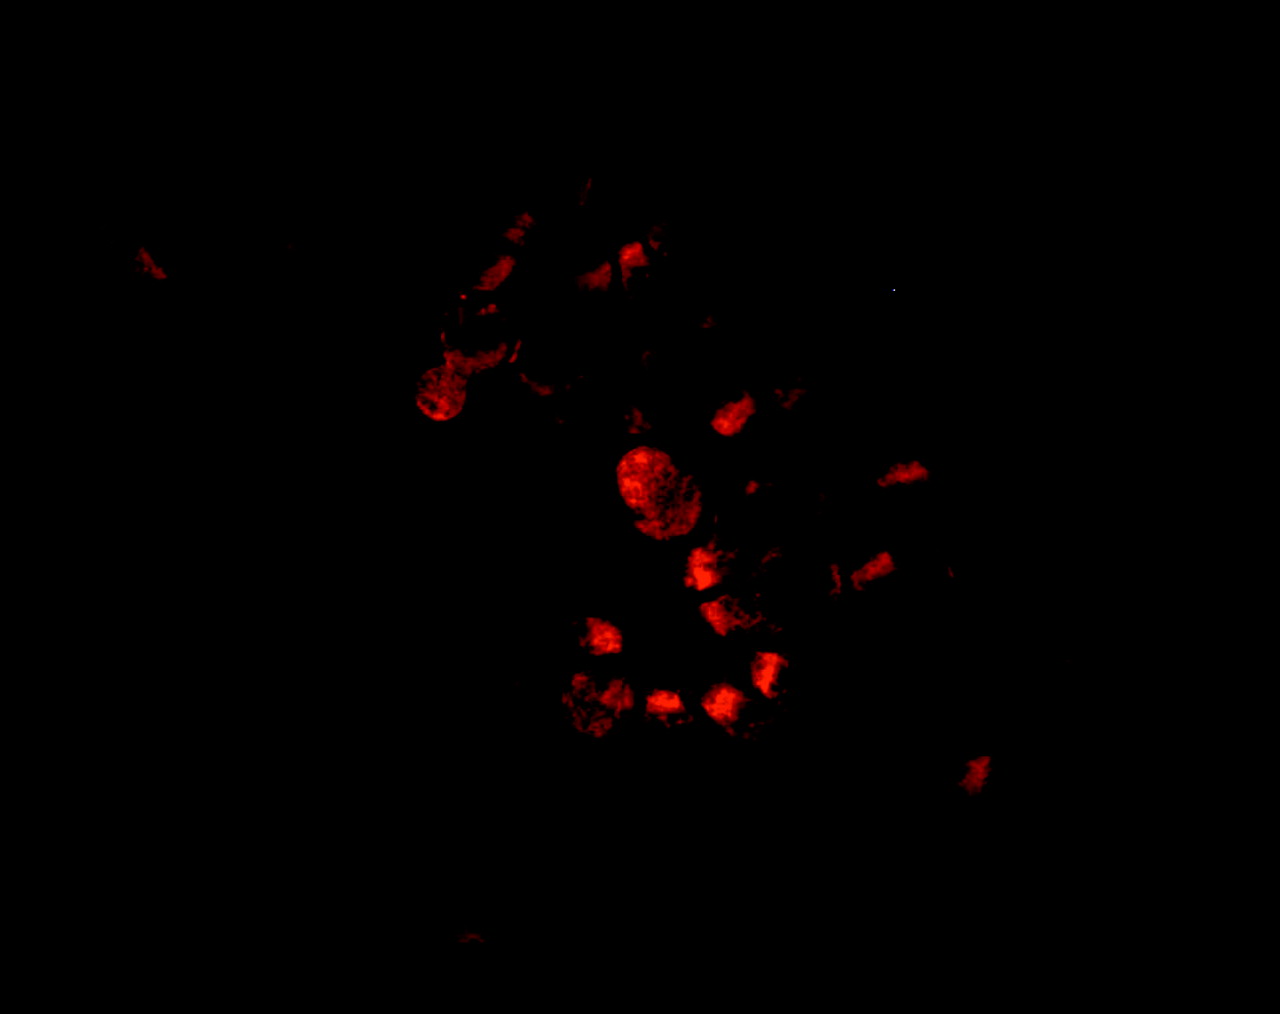
All epithelial cells stained positive for NOS2 (fig 2). Immunostaining of macrophages revealed very little expression of NOS2. There was variability in expression between samples but there was no relationship with FeNO or phenotype.

Cytospin preparations of epithelial cells were stained for NOS2. Cells stained positive for NOS2. The levels of NOS2 could not be quantified as the percentage of cells expressing NOS2 did not vary between individuals and the intensity of staining cannot be accurately quantified in cytospin preparations.
DISCUSSION
We observed a wide range of FeNO levels in this mixed population of healthy, atopic, and asthmatic children (fig 1B), even in the absence of current respiratory symptoms. The sampling technique used in this study samples NO produced in the lower airway, proximal to respiratory bronchioles,19 so the blind brushing sampled an appropriate segment of the airway. In agreement with other studies,20 we found that age was a significant predictor of FeNO. There was no relationship between age and NOS2 expression, supporting the finding that the relationship between age and FeNO in children is due to the volume of the respiratory anatomical dead space.21
The correlation between FeNO and NOS2 was strongest in the asthmatic children but was still significant in the healthy subjects. This suggests that NOS2 expression is responsible for the increased FeNO and significantly contributes to baseline FeNO. The constitutive isoforms of NOS may play a more important role in baseline FeNO than in increased FeNO, but our study was not designed to test this hypothesis. When corrected for age, most of the variability in FeNO can be explained by differences in epithelial NOS2 expression regardless of phenotype. We chose subjects with different phenotypes in order to ensure a range of FeNO levels. In this age group we have previously found that FeNO levels are determined by the presence of atopy and bronchial responsiveness rather than a diagnosis of asthma. Our observations in the present study are consistent with these previous data, but the study was not designed with the power to differentiate between groups on the basis of FeNO.
Both epithelial cells and macrophages were stained for NOS2. As all epithelial cells stained positive for NOS2, we were not able to differentiate between samples by counting the percentage of cells expressing NOS2. Levels of protein expression could not be determined using this technique. We did not observe consistent within or between sample evidence of NOS2 activity in macrophages and it is therefore unlikely that differences in FeNO could be explained by macrophage NOS2 expression.
Since the production of NOS2 is regulated at the transcriptional level,7 it is reasonable to assert that, in the absence of acute asthmatic symptoms, FeNO is largely determined by epithelial NOS2 expression with little contribution from other isoforms. In a clinical context it seems reasonable to assert that changes in FeNO will largely reflect changes in epithelial NOS2 expression. The measurement of FeNO might therefore be a useful indicator of broader epithelial function in addition to being an inflammatory marker, and this aspect requires further investigation. Moreover, in the light of these observations, caution should be used when extrapolating from animal models to explain NO airway biology in humans.
We have shown that a simple blind brushing technique can be used in children to obtain samples of epithelial mRNA suitable for gene expression analysis which is likely to prove useful for investigating the role of the epithelium in respiratory disease.