Article Text

Abstract
Background: There have been few inter-observer studies of diffuse parenchymal lung disease (DPLD), but the recent ATS/ERS consensus classification provides a basis for such a study.
Methods: A method for categorising numerically the percentage likelihood of these differential diagnoses was developed, and the diagnostic confidence of pathologists using this classification and the reproducibility of their diagnoses were assessed.
Results: The overall kappa coefficient of agreement for the first choice diagnosis was 0.38 (n = 133 biopsies), increasing to 0.43 for patients (n = 83) with multiple biopsies. Weighted kappa coefficients of agreement, quantifying the level of probability of individual diagnoses, were moderate to good (mean 0.58, range 0.40–0.75). However, in 18% of biopsy specimens the diagnosis was given with low confidence. Over 50% of inter-observer variation related to the diagnosis of non-specific interstitial pneumonia and, in particular, its distinction from usual interstitial pneumonia.
Conclusion: These results show that the ATS/ERS classification can be applied reproducibly by pathologists who evaluate DPLD routinely, and support the practice of taking multiple biopsy specimens.
- reproducibility
- interstitial lung disease
- histopathology
- inter-observer variation
Statistics from Altmetric.com
Inter-observer variation studies in pulmonary pathology are generally concerned with neoplasia,1–7 and few have been applied to the reproducibility of non-neoplastic disease.8–10 A consensus classification has recently been published by a joint American Thoracic Society/European Respiratory Society (ATS/ERS) sponsored committee comprising clinicians, radiologists and pathologists,11 and there is evidence that recognition of these patterns provides significant prognostic data.8,12–17 However, unlike neoplasia where the pathology is typically definitive, the diagnosis of interstitial lung diseases is seldom unequivocal and diagnostic confidence levels vary. Furthermore, this variation is difficult to capture numerically for analytical purposes for two reasons. Firstly, the wealth of published terminology has historically been interpreted in different ways by clinicians and pathologists and, secondly, studies have concentrated on observer variation between first choice diagnoses and have not evaluated variation in the designation of diagnostic probabilities.
The ATS/ERS consensus classification therefore provides an opportunity to develop a numerical system for assessing pathological diagnoses of diffuse parenchymal lung disease (DPLD), and to use this system to assess the reproducibility of the diagnosis for such cases.
METHODS
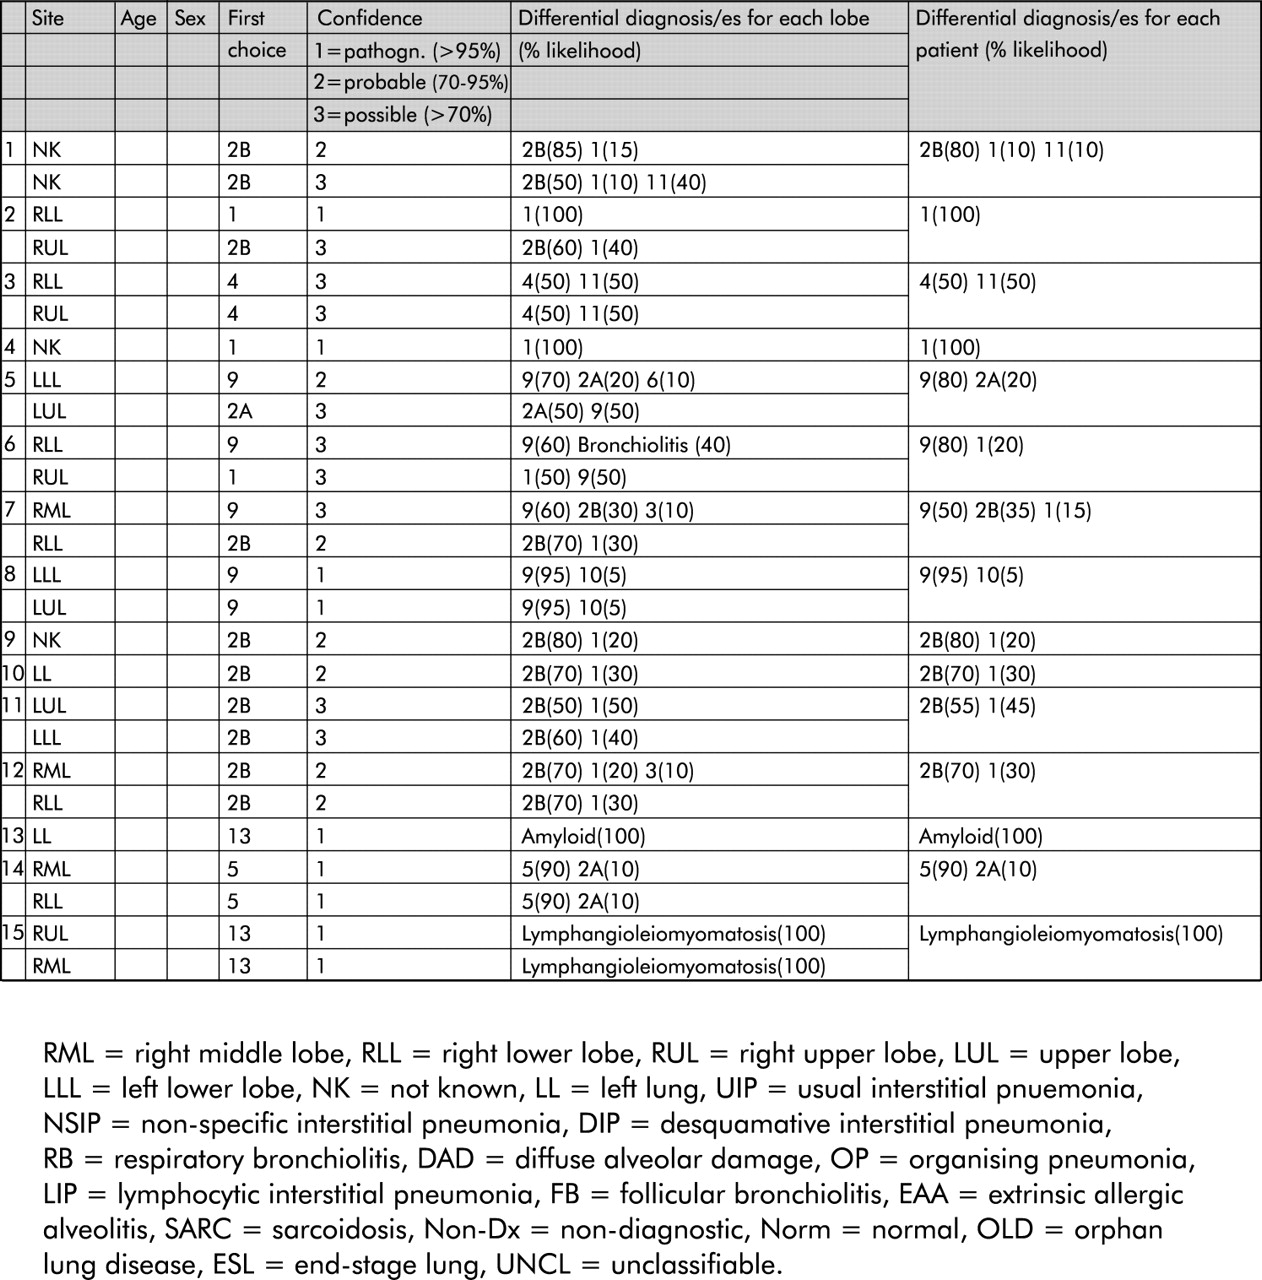
Cases referred to the Royal Brompton Hospital for the clinical assessment of DPLD between January 1996 and December 1997, in which a surgical lung biopsy specimen was taken, were retrieved and haematoxylin and eosin stained sections were circulated to 10 members of the UK Interstitial Lung Disease panel. These reviewers were provided only with knowledge of the age and sex of the patient and the site of biopsy and were asked to categorise the histopathological pattern as follows: usual interstitial pneumonia (UIP), desquamative interstitial pneumonia (DIP), respiratory bronchiolitis, diffuse alveolar damage (DAD), organising pneumonia (OP), cellular and fibrotic non-specific interstitial pneumonia (NSIP), lymphoid interstitial pneumonia (LIP), follicular bronchiolitis (FB), extrinsic allergic alveolitis (EAA), sarcoidosis, end stage lung disease, normal, non-diagnostic, unclassifiable, and “other” (box 1). The observers were instructed to assume that infection had been excluded and to ignore pleural disease. They were asked to specify the differential diagnosis for each lobe, and for each patient when more than one biopsy had been performed. For each stated diagnosis the percentage likelihood was specified to the nearest 5% (censored at 5% and summing to 100% in each lobe and for each patient). A first choice diagnosis was specified (even when the two most likely diagnoses were assigned the same percentage likelihood). If more than one pattern was recognised (for example, follicular bronchiolitis superimposed upon fibrotic NSIP), the differential diagnosis was to be weighted according to the predominant pattern (for example, follicular bronchiolitis (70%); NSIP (30%)) An example of scoring from one reviewer is shown in fig 1.

An example of scoring for one reviewer using the numbered system from box 1.
Box 1 Permitted histopathological patterns
1 Usual interstitial pneumonia (UIP)
2a Non-specific interstitial pneumonia (NSIP), cellular
2b Non-specific interstitial pneumonia, fibrotic
3 Desquamative interstitial pneumonia (DIP)
4 Respiratory bronchiolitis (RB)
5 Diffuse alveolar damage (DAD)
6 Organising pneumonia (OP)
7 Lymphocytic interstitial pneumonia (LIP)
8 Follicular bronchiolitis (FB)
9 Extrinsic allergic alveolitis (EAA)
10 Sarcoidosis (Sarc)
11 Non-diagnostic (Non-diag)
12 Within normal limits (Normal)
13 Other: specify disease (e.g. giant cell interstitial pneumonia, eosinophilic pneumonia, amyloidosis, Langerhans’ cell granulomatosis, lymphangioleiomyomatosis, bronchopneumonia, bronchiolitis)
14 End stage lung (ESL)
15 Unclassifiable (Unclass)
Data analysis
The first choice diagnosis was assigned a confidence rating of 1 (>95% = pathognomonic), 2 (diagnostic likelihood 70–95% = high confidence), or 3 (diagnostic likelihood <70% = low confidence) for each lobe (n = 133) and for each patient (n = 83). For the purposes of data analysis, cellular and fibrotic NSIP were combined. Confidence ratings for each biopsy specimen were summed for the 10 observers; overall diagnostic confidence for each biopsy specimen was subcategorised as high (summed confidence rating ⩾13, n = 74) or low (summed confidence rating <13, n = 59).
Inter-observer variation was quantified using the unadjusted kappa coefficient of agreement (κ), with the generation of kappa values for (a) the first choice lobar diagnosis and (b) the first choice diagnosis for each patient. In addition, observer variation for the first choice diagnosis was computed for each individual condition.
Inter-observer variation in the estimation of the probability of each condition was then quantified. For each biopsy specimen the percentage likelihood of each individual diagnosis was converted into a 5 point semi-quantitative scale according to clinically useful diagnostic probabilities: grade 1 = pathognomonic (100%); grade 2 = high probability (70–95%); grade 3 = intermediate probability (30–65%); grade 4 = low probability (5–25%); grade 5 = condition not included in the differential diagnosis. A weighted kappa coefficient of agreement using quadratic weighting (κw)18 was then generated for each condition for the whole cohort; weighted kappa computation must be performed between paired observers and, thus, weighted kappa values are expressed as median values with ranges for the 45 possible combinations of 10 observers—that is, observer 1 versus observer 2; observer 1 versus observer 3 etc.
Observer agreement was categorised as poor, fair, moderate, good, or excellent according to kappa values of <0.20, 0.20–0.39, 0.40–0.59, 0.60–0.79, and >0.80, respectively.19 Statistical analyses were performed using STATA data analysis software (Computing Resource Center, Santa Monica, CA, USA).
Data were then further interrogated to identify the cardinal sources of inter-observer variation. Biopsy specimens in which divergent diagnoses were made by a minimum of two observers were tabulated—for example, UIP, n = 7; NSIP, n = 2; EAA, n = 1 was categorised as diagnostic discordance between UIP and NSIP. This analysis was then repeated with the requirement that divergent diagnoses were made by a minimum of three observers.
RESULTS
As shown in fig 2, the median prevalence of biopsy specimens considered to be pathognomonic by the 10 pathologists was 39% (range 29–57%). The median prevalence of first choice diagnoses thought to be pathognomonic or made with high confidence (>70% likelihood) was 82% (range 73–94%). Pathologists made first choice diagnoses with low confidence (<70% likelihood) in a median of 18% of cases (range 6–27%).

Diagnostic confidence of first choice diagnoses. The median prevalence of biopsy specimens considered to be pathognomonic was 39% (range 29–57%), the median prevalence thought to be pathognomonic or made with high confidence (>70% likelihood) was 82% (range 73–94%), and the median prevalence for diagnoses with low confidence (<70% likelihood) was 18% (range 6–27%).
Kappa coefficients for first choice diagnoses are shown in table 1. The overall kappa coefficient for agreement of diagnosis was only fair (κ = 0.38), with higher kappa values for patterns with relatively specific histological parameters such as UIP (κ = 0.42), OP (κ = 0.57) and sarcoidosis (κ = 0.76), and lower kappa values for patterns in which multiple features are required such as EAA (κ = 0.36) or in which the diagnosis is made, in part, by exclusion such as NSIP (κ = 0.29). Observer agreement was higher in biopsy specimens for which diagnostic confidence (as judged by summed confidence ratings) was high (κ = 0.50) than in those for which diagnostic confidence was low (κ = 0.22).
Kappa coefficients of agreement of diagnostic categories of diffuse parenchymal lung disease
Biopsy specimens were taken from multiple sites in 48 patients (98 biopsies: two sites, n = 46; three sites, n = 2). In view of the reduction in sample size, kappa computation for first choice diagnoses was confined to 10 diagnostic categories recognised in a minimum of five cases. As shown in table 2, the kappa coefficient for the first choice diagnosis was marginally higher for patient diagnoses (κ = 0.43) than for lobar diagnoses (κ = 0.39).
Kappa coefficients (κ) between lobar and final diagnoses in patients undergoing multiple biopsies
Weighted kappa coefficients were also limited to five categories where the prevalence of the histological patterns was considered sufficient for diagnosis (table 3). These show that, for lobar diagnoses, there was a mean improvement in the kappa coefficient from 0.48 to 0.58. Furthermore, when the final diagnosis was compared with the lobar diagnosis, taking into account the combined assessment of multiple biopsies in 48 patients, all weighted kappa coefficients were either satisfactory or good (range 0.40–0.76, mean 0.58).
Comparison of kappa and weighted kappa coefficients of agreement
The sources of inter-observer variation are shown in table 4 (divergent diagnoses made by two or more pathologists) and table 5 (divergent diagnoses made by three or more pathologists). Disagreement most often centred upon a diagnosis of NSIP (made in over 50% of cases with divergent diagnoses), with the discrimination between NSIP and UIP a particular difficulty. The distinctions between end stage lung disease and both UIP and NSIP were also important sources of disagreement between observers.
Noise analysis in which a minimum of two observers gave the same patterns as divergent diagnoses for a biopsy specimen
Noise analysis in which a minimum of three observers gave the same patterns as divergent diagnoses for a biopsy specimen
Inter-observer variation within the category “other” is shown in table 6. Diagnoses here included Langerhans’ cell granulomatosis, eosinophilic pneumonia, lymphangiomatosis, pulmonary haemosiderosis, amyloid and lymphangioleiomyomatosis. There were also diagnoses more appropriate to bronchiolar than parenchymal disease, although terminology differed between individuals.
Cases in which a diagnosis of “other” was made by more than one observer (n = 10)
DISCUSSION
This study was undertaken to quantify inter-observer variation in DPLD, an area of considerable diagnostic complexity where pathologists often offer a differential diagnosis. The devised method enabled us to see how pathologists come to a particular diagnosis by analysing their differential diagnoses. Our data show, for the first time, the diagnostic confidence and degree of observer variation among a large group of pulmonary pathologists dealing with DPLD. They also allow us to identify areas in which diagnostic problems are most frequently encountered.
The first analysis considered the degree of diagnostic confidence and showed that a 100% (pathognomonic) confidence level for a single diagnosis was only reached in 39% of cases, with 18% of first choice diagnoses made with low confidence. This is probably because recognition of these patterns requires the presence of several independent histological parameters in the sample—for example, fibroblastic foci, patchy subpleural or paraseptal fibrosis, and honeycombing in UIP. The presence of fibroblastic foci is particularly important in distinguishing UIP and NSIP, which may explain the frequent discordance in patients who have multiple biopsies.16
With regard to first choice lobar diagnoses, the overall kappa value was 0.38. This lies slightly below the “clinically acceptable” level of 0.40, but rose to 0.43 when diagnoses were made from multiple biopsies. We therefore also quantified inter-observer variation in the estimation of diagnostic probability. In order to make these analyses clinically meaningful, percentage likelihood estimations were converted to broad categories of diagnostic probability, applicable to clinical practice. This approach allowed us to address an important deficiency in statements of inter-observer variation based upon first choice diagnoses. When the diagnosis is a close call, two pathologists often concur in their clinically meaningful conclusions—that is, they agree that two specified diagnoses are similarly likely—but may be absolutely in disagreement on the first choice diagnosis. Our data show a reduction in inter-observer variation when diagnostic probabilities are evaluated; when diagnoses were based upon multiple biopsies, weighted kappa values indicated a satisfactory level of agreement for all evaluated patterns. This is particularly significant in relation to NSIP, in which a single biopsy specimen may provide a low degree of confidence whereas a second specimen showing similar features would probably increase the diagnostic confidence and lower the inter-observer variability. Our data therefore indicate that, in the hands of experienced pulmonary pathologists, the ATS/ERS consensus classification is sufficiently reproducible for routine diagnostic usage.
We also analysed the sources of inter-observer variation by identifying the frequency with which particular differential diagnoses were offered (tables 5 and 6). Our data indicate that over half the observer noise related to a single pattern—namely, NSIP. This was true even without dividing NSIP into its cellular and fibrotic subtypes. Indeed, there were problems distinguishing NSIP from every other category apart from normal lung and sarcoidosis, but distinction from UIP was particularly problematic, these two patterns being frequently offered as alternative diagnoses. This is possibly because some cases of fibrotic NSIP represent early or inactive idiopathic pulmonary fibrosis so that fibroblastic foci are absent or scarce.16,20 Table 5 also highlights the problems when a pathologist is confronted with a biopsy specimen showing end stage lung disease (category 14) and attempts to tease a diagnosis of either fibrotic NSIP or UIP from such a sample. Previous studies have shown that coefficients of agreement fall to unacceptable levels in relation to end stage lung disease,8 and our analysis shows that pathologists are often unable to make a firm diagnosis because of inappropriate sampling or because the biopsy specimen shows only non-specific advanced disease.
Table 5 also illustrates problems that arise with particular histological patterns. For example, in EAA one might expect the most common differential diagnosis to be sarcoidosis, given that these are both granulomatous in nature. However, sarcoidosis proved to be a less common differential diagnosis than UIP and NSIP, suggesting that the fibrotic component of chronic EAA (versus UIP and fibrotic NSIP) and the relative bronchiolocentricity of the inflammation (subacute EAA versus cellular NSIP) provide greater problems for pathologists than the relative frequency of granulomas. Highlighting these areas therefore indicates areas that require further study and refinement of diagnostic criteria. To this end, a workshop specifically focused on NSIP is currently being sponsored by the ATS.
Our last analysis was of the “other” category which was primarily included to allow assessment of rare diffuse parenchymal lung diseases. These included individual cases of Langerhans’ cell granulomatosis, eosinophilic pneumonia, primary pulmonary hypertension, lymphangioleiomyomatosis, amyloidosis, lymphangiomatosis/lymphangectasia, and pulmonary haemosiderosis, all of which were diagnosed by more than one observer. Both lobar and overall kappa coefficients were satisfactory for this group, but levels of 0.41 and 0.49 are perhaps lower than expected for disorders with quite distinct histological features. However, sub-analysis shows that most observer disagreement centred on pathologists classifying six out of the 13 such biopsy specimens as showing some form of bronchiolocentric lung injury. This is of interest in view of a recent report describing idiopathic bronchiolocentric pneumonia.21 It also suggests an overlap between small airways disease and diffuse parenchymal disease that needs clarification.
One potential limitation to this study is the fact that the participating pathologists all have a special interest in pulmonary pathology. General histopathologists may be less confident in dealing with DPLD. However, most surgical lung biopsies in the UK are reported by pathologists with a designated interest in lung disease, so we believe that this study reflects current practice and is likely to be internationally applicable.
Historically, the use of surgical biopsy specimens has been viewed as the diagnostic standard in diffuse lung disease. Our data call into question this premise since, in two-thirds of cases, the histological appearances were not pathognomonic, with major uncertainty in 18% of cases. Furthermore, we have quantified major observer variation among pathologists even though the overall level of agreement was clinically acceptable. These findings highlight the importance of integrating histopathological data with HRCT scanning and clinical findings, as recently recommended by expert groups.11 Indeed, the reconciliation of histopathological and HRCT data has recently been shown to refine the prognostic evaluation in fibrotic idiopathic interstitial pneumonias.22
In conclusion, this study shows that the ATS/ERS consensus classification is sufficiently reproducible when used by pathologists who routinely evaluate lung biopsy specimens in diffuse lung disease. It also shows that much of the disagreement among pathologists centres on the category of NSIP. Bronchiolocentric fibrosis is another area worthy of further study.