Article Text

Abstract
Background: This study examines the operating characteristics of the expiratory flow response to a negative pressure (NEP) applied to the mouth in the prediction of obstructive sleep apnoea syndrome (OSAS) in snoring patients.
Methods: Two hundred and thirty eight patients with normal spirometric values were studied. Full laboratory polysomnography was performed and an NEP of −5 cm H2O was applied in the sitting and supine positions.
Results: A significant correlation was found between the degree of flow limitation measured by NEP in both positions (expressed as the percentage of the expired tidal volume over which NEP induced flow did not exceed spontaneous flow) and the apnoea-hypopnoea index (AHI). This correlation was significantly higher in the supine position (p<0.0001) where an expiratory flow limitation cut off value of ⩾27.5% of the tidal volume produced a sensitivity of 81.9% and a specificity of 69.1% in predicting OSAS.
Conclusion: These findings show that the degree of instability of the upper airway measured by NEP is correlated with the severity of OSAS. NEP had moderate sensitivity and specificity and may be useful in predicting OSAS in a clinic based population.
- AHI, apnoea-hypopnoea index
- BMI, body mass index
- FEF25–75, forced mid expiratory flow
- FEV1, forced expiratory volume in 1 second
- FRC, functional residual capacity
- FVC, forced vital capacity
- NEP, negative expiratory pressure
- OSAS, obstructive sleep apnoea syndrome
- VC, vital capacity
- negative expiratory pressure
- snoring
- obstructive sleep apnoea
- operating characteristics
Statistics from Altmetric.com
- AHI, apnoea-hypopnoea index
- BMI, body mass index
- FEF25–75, forced mid expiratory flow
- FEV1, forced expiratory volume in 1 second
- FRC, functional residual capacity
- FVC, forced vital capacity
- NEP, negative expiratory pressure
- OSAS, obstructive sleep apnoea syndrome
- VC, vital capacity
Polysomnography in a sleep laboratory is the widely accepted standard method used to diagnose obstructive sleep apnoea syndrome (OSAS). The procedure is, however, expensive, time consuming and, in some centres, the waiting times are unacceptable. In such a context, simpler and less expensive tests are needed.
Even if the peripheral airways appear implicated in obese patients with OSAS,1,2 the major physiopathological factor involved in the generation of sleep disordered breathing is increased upper airway collapsibility.3–5 Brown et al,6 using the acoustic reflection technique, showed that expiratory compliance of the upper airway was higher than inspiratory compliance and was higher in OSAS patients than in normal subjects, indicating that the focus of studies should be on expiration. Demonstration of expiratory flow limitation (EFL) has been facilitated by the introduction of the negative expiratory technique (NEP).7,8
The basis of the technique is that, during spontaneous breathing, a small negative pressure (−3 to −5 cm H2O) is applied at the start of expiration. In normal subjects an increase in expiratory flow is observed. In subjects with EFL the flow measured under NEP will not exceed spontaneous flow. This simple, non-invasive, effort independent and fast technique can be applied in any body position.
Listro et al,9 using the NEP technique, found that non-intrathoracic airflow limited patients with a desaturation index of ⩾15/hour of sleep (who were considered to have OSAS) had >30% of EFL when supine. They also found a close correlation between % EFL supine during wakefulness and the desaturation index during sleep.
Verin et al10 reported further evidence for EFL of the extrathoracic airway. In a population of 19 patients with OSAS with no obstructive lung disease they found a significant relationship between the degree of EFL and the severity of OSAS. This could suggest that the greater the EFL over tidal expiration, the higher is the collapsibility of the upper airway in apnoeic/hypopnoeic patients. Tantucci et al11 showed that, in contrast to awake non-snorers, non-apnoeic snorers during NEP procedures with negative pressure levels between −3 and −5 cm H2O had increased expiratory flow resistance compared with that obtained without NEP at corresponding flow rates, both when seated and supine. The presence of flow limitation already present in primary snoring led to the conclusion that upper airway instability varies not only over the spectrum of OSAS but also from health to disease, and hence this could lower the capacity of the NEP test to differentiate between healthy snoring persons and those more severely affected.
At present the potential usefulness of the NEP technique as a diagnostic tool for OSAS in daily clinical practice is unknown. We have therefore undertaken a large prospective study to determine the operating characteristics of the NEP technique—in both the seated and supine positions—in detecting OSAS in snoring patients.
METHODS
Patient selection
282 consecutive patients attending a sleep clinic for the first time for snoring and/or suspicion of OSAS were eligible for the study. Exclusion criteria were regular use of hypnotic medications, presence of upper airway disorders, a history and physical examination compatible with cardiopulmonary disease, the presence of airway obstruction (forced expiratory volume in 1 second (FEV1)/forced vital capacity (FVC)) less than 80% of the predicted value, signs of pulmonary hyperinflation on pulmonary function tests, and curvilinear expiratory flow-volume curves. Subjects with evidence of neuromuscular disease were also excluded. Three patients were excluded because of absence of snoring during the night of recording.
238 patients (182 men) were included in the study. The mean (SD) body mass index (BMI) for the whole cohort was 33.5 (7.5) kg/m2 (range 20.8–65.3). Forty patients were morbidly obese (BMI ⩾40 kg/m2). Fifty two patients were suffering from primary snoring (apnoea-hypopnoea index (AHI) <5 events/hour).
The study was approved by the ethical committee of the hospital and informed consent was obtained from all subjects before inclusion in the study.
Measurements
NEP and pulmonary function tests were performed by a well trained pneumologist helped by a technician. All the measurements and the clinical evaluation were assessed blindly (each interpreter was unaware of the results of the other investigations) and the clinician was not involved in the NEP and polysomnography interpretations.
Sleep studies
Full laboratory polysomnography during one night was performed in all patients and was used as the gold standard in the evaluation of the operating characteristics of the NEP technique to detect OSAS. The sleep study included electroencephalography, right and left electro-oculography, bipolar submental electromyography, oronasal airflow, thoracic and abdominal excursions (inductive plethysmography bands), arterial oxygen saturation monitored via a finger probe, and snoring by a microphone attached to the patient’s neck (Medatec, Brussels, Belgium).
Sleep stages were scored according to the criteria of Rechtscaffen and Kales12 by two experienced technicians. Snoring was designated on the basis of the characteristic microphone trace during sleep. Respiratory events were defined as follows: obstructive apnoea was the cessation of airflow at the nose and mouth for ⩾10 seconds in the presence of continued respiratory effort; obstructive hypopnoea was a discernable reduction in respiratory effort with the presence of paradoxical breathing accompanied by a decrease of >3% in oxygen saturation or with an EEG arousal.13 The results were expressed as the number of apnoeas+hypopnoeas per hour of sleep (apnoea-hypopnoea index, AHI); an AHI of ⩾15/hour of sleep was used to define the presence of OSAS.
Spirometric, flow-volume, and plethysmographic data
All subjects had spirometric measurements and maximal inspiratory and expiratory flow-volume curves using a Fleish no 2 pneumotachograph (Spirometer micro 5000; Medisoft, Dinant, Belgium). Expiratory flow at 25%, 50%, and 75% of vital capacity (VC) were also measured. The highest values of three technically satisfactory forced expirations were used.
Functional residual capacity (FRC) and total lung capacity (TLC) were measured using a body plethysmograph (Medisoft). All values were expressed as percentages of predicted values. Quality criteria and reference values were those of the European Community.14
Negative expiratory technique
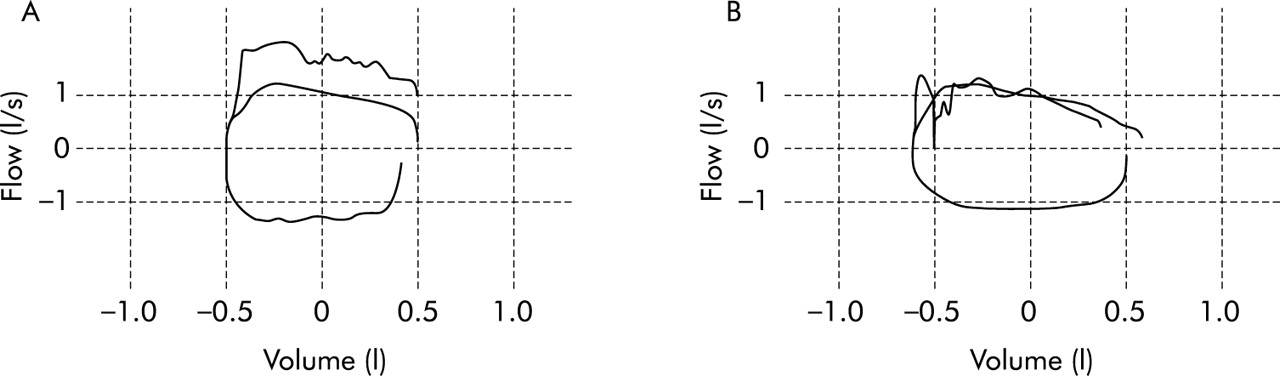
EFL was assessed using a computerised NEP technique (Micro 5000+ NEP, Medisoft). Wearing a nose clip, patients breathed through a mouthpiece connected to a “Pitot tube” pneumotachograph which was connected downstream to a Venturi device. The dead space of the assembly was 45 ml and the resistance was negligible. The pressure regulator was set to generate −5 cm H2O at the airway opening. Signals were amplified, filtered, and sent to a 16 bit A/d converter connected to a personal computer. Measurements were performed in the seated and supine positions in a random order. During the measurements care was taken to avoid any change in head and neck position. Five or more breath tests were performed and at least four regular breaths were allowed between two subsequent NEP breath tests. Expiratory flow limitation (EFL%) was expressed as the percentage of the expired tidal volume over which the NEP induced flow did not exceed spontaneous flow. Figure 1 shows two examples of such measurements recorded in two different patients both in the supine position. The recorded value resulted from the mean of five measurements. When EFL was detected, five reproducible measurements were selected to keep the difference between the lowest and the highest values for the five measurements in a given patient below 25% of the highest value. The mean (SD) number of procedures per patient was 7.4 (1.7).

Superimposed flow-volume curves during quiet breathing and during negative expiratory pressure (NEP) in two different subjects both in the supine position showing (A) the absence of flow limitation and (B) the presence of expiratory flow limitation of 77%.
Statistical and mathematical analysis
All analyses were performed using SigmaStat software package (Jandle Scientific). Data were expressed as median (range). Subjects were categorised based on their AHI. An AHI of 15 or more was considered as OSAS. Differences between patients according to the presence or absence of OSAS were assessed using the Mann-Whitney test. Correlations between variables were evaluated using the Spearman rank correlation coefficient. Receiver-operating characteristic (ROC) curves were constructed to determine the sensitivity (true positive rate) versus 1 − specificity (false positive rate) at various levels of the measured EFL induced by NEP and to identify the cut off value yielding the largest number of correctly classified patients.15
Sensitivity, specificity, positive predictive value (PPV), negative predictive value (NPV) and the likelihood ratios were then calculated. The likelihood ratio is the likelihood that a given test result would be expected in a patient with the target disorder compared with the likelihood that the same result would be expected in a patient without the target disorder.
In order to determine the predictor of EFL% independently of OSAS, a multilinear regression analysis was tested using a backward selection of the explicative variables.16 The results of the model were expressed in terms of standardised regression coefficients.
For all comparisons, two tailed p values of <0.05 were considered significant.
RESULTS
Anthropometric characteristics, pulmonary function data, and polysomnographic data of the patients are summarised in table 1. Of the 238 patients, 143 were found to have OSAS (prevalence 0.60). Age, BMI, and neck circumference were significantly higher in patients with OSAS than in the non-OSAS group.
Anthropometric data and respiratory and polysomnographic characteristics of patients according to the presence or absence of OSAS
To examine whether the diagnosis of OSAS was associated with changes in lung volumes and flows, we compared the different parameters in the two groups. The only significant statistical difference between the groups was observed for the forced mid expiratory flow (p = 0.0118).
Negative expiratory pressure
As shown in table 1, EFL measured in both the seated and supine positions was significantly higher in the OSAS group than in the non-OSAS group. However, in the seated position EFL over tidal expiration was globally smaller, more inconsistent, and there was a larger overlap between apnoeic and non-apnoeic patients (150 of 238 had no EFL).
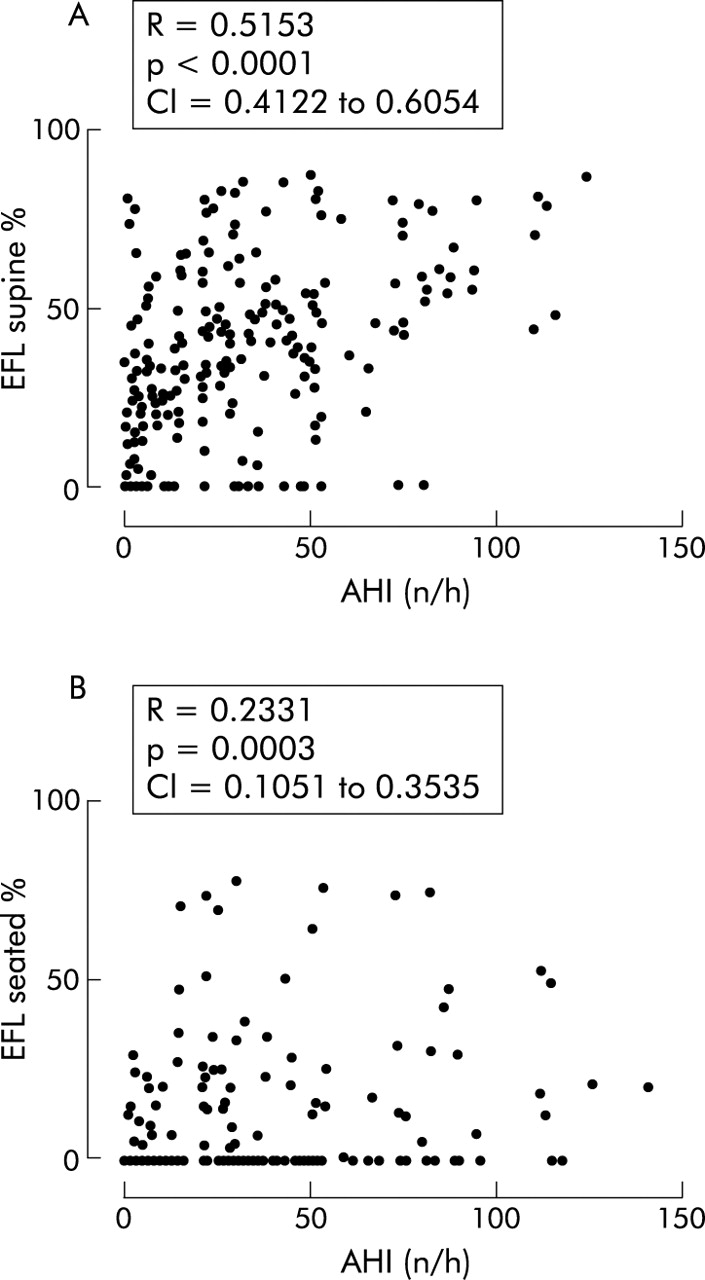
Spearman rank correlation analysis was performed to assess the association between the degree of flow limitation measured by NEP (seated and supine) and the AHI (fig 2). A highly significant association was found between the degree of flow limitation measured in the supine position and AHI (R = 0.5153, p<0.0001, 95% CI 0.4122 to 0.6054). The association was weaker when the degree of flow limitation was measured in the seated position (R = 0.2331, p = 0.0003, 95% CI 0.1051 to 0.3535).

Spearman rank correlation between expiratory flow limitation (EFL), expressed as the percentage of expired tidal volume over which NEP induced flow did not exceed spontaneous flow, and the apnoea/hyponoea index (AHI) in (A) the supine and (B) the seated positions.
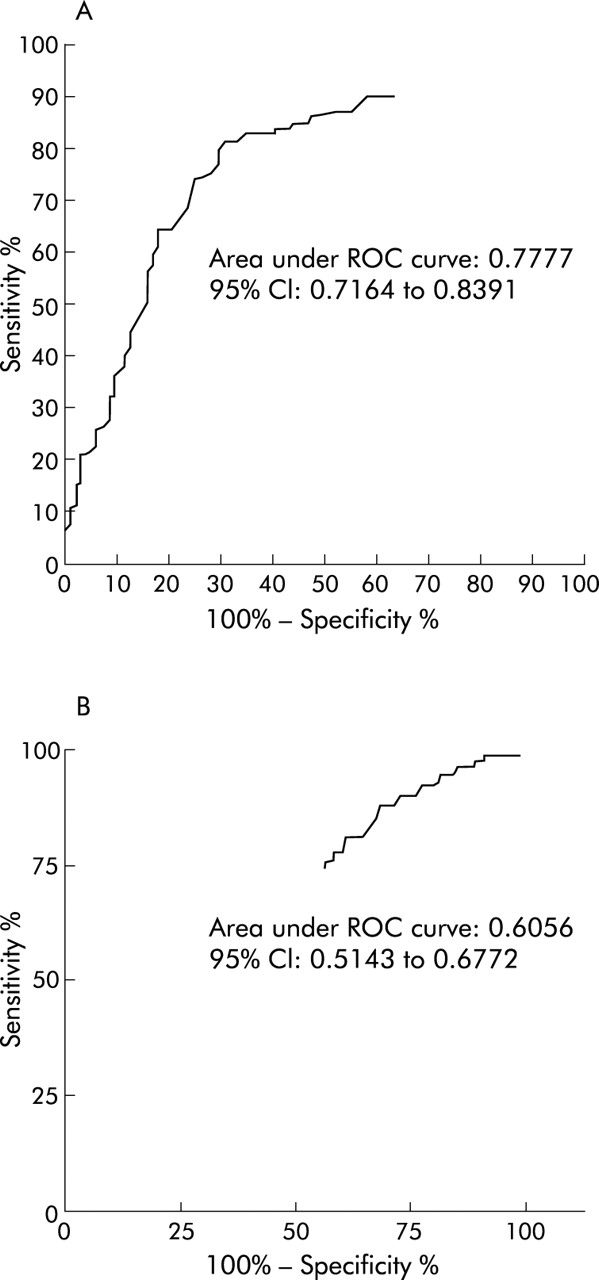
The ability of the NEP procedure to correctly classify patients without and with OSAS (AHI <15 or ⩾15/hour) was estimated by calculation of the area under the ROC curve (fig 3). The value of the area was 0.777 (95% CI 0.716 to 0.839) when supine and 0.6056 (95% CI 0.5143 to 0.6772) when seated, indicating the potential usefulness of the values obtained in the supine position but not in the seated position for the prediction of OSAS.
Receiver-operating characteristic (ROC) curves of the measured expiratory flow limitation (EFL) induced by negative expiratory pressure (NEP) in 143 patients suffering from OSAS and 95 non-OSAS patients in (A) the supine and (B) seated positions. The area under the ROC curve is a measure of the global ability of NEP to correctly classify patients without and with OSAS (AHI <15 or ⩾15/hour).
From the ROC curve the optimal cut off value of the EFL was chosen as the point nearest to the top left corner in order to give maximal sensitivity for specificity. It was set at ⩾27.5% producing a sensitivity of 81.9% and a specificity of 69.1%. The positive and negative predictive values were 0.803 and 0.714, respectively. The likelihood ratios (LR) were calculated to give the likelihood that a test result—that is, EFL <27.5% or ⩾27.5%—would be expected in a patient with OSAS compared with the likelihood that the same result would be expected in a patient without OSAS (table 2). Using a simplified form of Bayes’ theorem17 (pre-test odds* LR = post-test odds and odds = P/1 − P), we calculated the post-test probabilities for a positive or negative test. The post-test probability of a positive result was 0.8 and of a negative result was 0.28 (pre-test probability 0.60).
Operating characteristics of the NEP procedure
To define the predictors of EFL independently of obstructive sleep apnoea, we performed a multilinear regression analysis using a stepwise backward selection of the variables displayed in table 1 (age, BMI, smoking habit, neck circumference, FEV1/FVC, FEV1, VC, FRC, FEF25–75).
As shown in table 3, the proportion of the variance in EFL that is shared by the weighted combination of the predictors (neck circumference, FRC, FEF25–75, age) reached only 18%. The standardised partial regression coefficients indicated that neck circumference was the most important variable in this model.
Multiple linear regression: outcome variable expiratory flow limitation (EFL%)
DISCUSSION
In this study we assessed the performance of the NEP technique in supine and seated positions compared with full polysomnography in the detection of OSAS in consecutively referred mainly obese snorers.
Only the NEP technique performed in the supine position was potentially useful. This measurement showed a significant relationship between the extent of EFL over tidal expiration and the severity of OSAS (r = 0.5153, p<0.0001). The accuracy estimated by the area under the constructed ROC curve was 0.777 (95% CI 0.716 to 0.839). Using a threshold value of 27.5% for the level of EFL, the operating characteristics of the NEP technique in detecting OSAS had a sensitivity of 81.9% and a specificity of 69.1%. For a positive result (EFL ⩾27.5% of tidal expiration) the post-test probability was 0.8, and for a negative result (EFL <27.5% of tidal expiration) the post-test probability was 0.28.
This research was carried out in subjects who attended a sleep clinic at a general hospital. They are not typical of the population as a whole or even of snorers in the general population, but we are confident that our sample represents the whole spectrum of disease severity and avoids the problem of spectrum bias that arises when all classes of severity of the targeted disease are not represented. This bias effect is important because new diagnostic tests have an exaggerated diagnostic accuracy when evaluated in a sample with a limited disease spectrum. Moreover, covariates that affect the new diagnostic test can exist only in some subgroups within a case mix and, in this way, can also alter the diagnostic accuracy.21
In a collapsible airway, flow limitation is facilitated when airflow resistance and airway wall compliance are increased and when the airway cross sectional area is decreased.18 Upper airway resistance is higher in the supine than in the seated position in both awake healthy subjects and OSAS patients.19 One factor responsible for this increase in upper airway resistance is the passive movement of the tongue which reduces the upper airway diameter.20 These differences between the two positions could explain the unsatisfactory operating characteristics of the NEP procedure in predicting OSAS when performed in the seated position.
In agreement with Verin et al,10 our results showed a significant correlation between the degree of EFL and the AHI, suggesting that the compliance of the upper airway in apnoeic/hypopnoeic patients increases as the EFL increases (fig 2A).
The calculated area under the ROC curve (0.777) corresponds to an acceptable discriminating power (0.7<AUC<0.9)15 with an optimal EFL cut off value of ⩾27.5%. This is in agreement with the results of Liistro et al who found an EFL of >30% in their subjects with a desaturation index during sleep of ⩾15/hour.9
With a few exceptions, the demonstration of EFL with NEP is the same whatever the source of the limitation (intrathoracic or extrathoracic).10 It is therefore important to examine at these two levels the potential confounding variables which have the capacity to induce false positive and negative results. The subjects were carefully assessed to rule out chronic obstructive pulmonary disease (COPD) and asthma. None of the included subjects had an obstructive limitation as defined by the FEV1/VC ratios and visual inspection of the expiratory flow-volume curves. We are therefore confident that the observed EFL could not be accounted for by COPD or asthma.
An EFL response to NEP has recently been observed in patients with severe cardiac disease and acute episodes of left heart failure.22 The clinical cardiac evaluation performed in our study was not very sensitive so we cannot rule out slight to moderate heart dysfunction. However, there is no reason to think that some of our asymptomatic patients could have suffered from cardiac failure sufficient to induce intrathoracic flow limitation.
Another potential intrathoracic source of EFL, particularly in the recumbent position, is early small airway closure in severe obese subjects with a decrease in FRC and expiratory reserve volume.23,24 Breathing at a low lung volume is associated with a reduction in the expiratory flow reserve that could lead to EFL in the face of NEP. We did not measure pulmonary function tests in the supine position so we can only speculate from the results obtained in the seated position. FEF25–75 was significantly lower in subjects with OSAS than in the non-OSAS group (p = 0.0229, table 1). A backward stepwise multivariate analysis showed that FEF25–75 and FRC were independently correlated to EFL, but the complete model including neck circumference and age could only explain 18% of the variance in EFL, with neck circumference being the main predictive variable (standardised regression coefficient 0.225).
Our multivariate model is in line with Yap et al24 who found a significant increase in supine respiratory resistance determined by the forced oscillation method (Rrs) in obese subjects compared with normal controls. However, the small decrease in the forced expiratory flows at low lung volumes observed in obese subjects associated with a larger fall in peak flow favoured extrathoracic airway narrowing as the main site of increased Rrs in the supine position.
The intrathoracic hypothesis of EFL therefore does not appear to be sufficient by itself to explain the false positive rate (30.9%) observed in our study. Potential extrathoracic sources of false positive rates in the ability of NEP to detect OSAS in snorers have been suggested by Tantucci et al.11 Their study indicated that, during wakefulness, non-apnoeic snorers have more collapsible upper airways than do non-snorers as reflected by the marked increase in the resistance of the respiratory system measured under NEP by the flow interruption technique. This observation is in agreement with our results; 12 (23%) of the 52 subjects with primary snoring had EFL of ⩾27.5%, 23 (44%) had no detectable EFL, and 17 showed 0%<EFL<27.5% of the tidal expiration.
The false negative rate, which reached 18.1%, could be due, at least in part, to one or more of the following factors. Apart from reduced airway dilating forces leading to upper airway obstruction, it has been postulated that chemoreflex and arousal mechanisms also play a role.25 The modification of ventilatory drive observed during sleep is independent of the airway structure and of the effect of neuromuscular control on the dilating upper airway musculature and can be important in the development of obstruction in OSAS. The neural output to the respiratory pump may determine the amount of collapsing inspiratory pressure for any given degree of upstream resistance. Finally, abnormalities in the temporospatial repartition of the inspiratory drive (desynchronisation between the activity of the upper airway dilator muscle and the inspiratory muscles) can lower the transmural pressure sufficiently to cause collapse of the upper airway.26 In awake OSAS patients this is observed using phrenic nerve stimulation to dissociate the activities of the upper airway dilators and the diaphragm.27
Biological variability can cause aggregation of all these factors in different ways, leading to the absence of demonstrable diurnal expiratory instability of the upper airway under the applied NEP in some patients with OSAS. The velopharynx or retropalatal oropharynx is a potentially important site of obstruction that is bypassed by oral application of the NEP procedure. Application of the negative pressure with a face mask should provide some information on these possibilities. The optimal level of the applied pressure using a face mask needs to be determined.
The behaviour of the collapsible upper airway is characterised by a pattern of flow that initially increases with the driving pressure but plateaus above a critical pressure (flow limitation). This is a feature of the Starling resistor model.28 The analysis of such a system predicts that the collapsibility does not only depend on the critical segment where it occurs but also on the upstream resistance in the upper airway (nose and nasopharynx). The high resistance of the nose and/or nasopharynx, which can play a role during sleep,29 is also not taken into account by the oral application of NEP.
We only used one level of NEP in our study (−5 cm H2O) but it could be argued that a higher level is indicated for detecting EFL. Verin et al10 did not find a significant difference in the degree of flow limitation with NEP at −5 cm H2O and −10 cm H2O, but their sample was small and the absence of statistical significance could be due to a type 2 error. Increasing the level of applied NEP can induce an early fall in expiratory flow below the flow of control tidal expiration. If this fall is prolonged, the NEP method is no longer able to assess EFL (whatever its origin) because of the persistent severe narrowing or collapse of the upper airways.30
Finally, the calculated LRs (LR+ = 2.66; LR− = 0.28) showed that the use of the NEP technique in the clinical work-up induced moderate changes in the post-test probabilities (table 2).
Despite these moderate changes, the NEP procedure appears to be the best single diurnal test for predicting OSAS to date. In a meta-analysis of studies of the diagnosis of sleep apnoea, Ross et al31 confirmed that the performance of the flow-volume loop in predicting OSAS was inappropriate. The pooled estimates of sensitivity and specificity of FEF50/FIF50 were 19.6% and 79.2%, respectively. For the sawtooth sign the sensitivity was 61.9% and the specificity 62.7%. In the same paper it was noted that most cephalometric studies did not report correlations with AHI and none reported sensitivity and specificity in relation to AHI. Xiujun et al32 recently reported that cephalometric measurements were significantly correlated with AHI in non-obese patients but not in the obese subgroup, and no values of sensitivity and specificity were given in this study.
The meta-analysis by Ross et al31 also evaluated single nocturnal tests for predicting OSAS. Overall estimates of sensitivity and specificity of nocturnal oximetry were 87.4% and 64.9%, respectively.
Shochat et al33 introduced a novel screening device: the SleepStrip. 402 patients underwent polysomnographic recordings concomitant with the use of the SleepStrip. For the whole group the sensitivity and specificity were in the ranges 80–86% and 57–86%, respectively. The values of the operating characteristics of these two techniques applied during sleep are not so different from those displayed in table 2 for the NEP procedure (sensitivity: 95% CI 74.7% to 87.9%; specificity: 95% CI 58.8% to 78.3%).
Our results indicate that, in a referred snoring population suffering from the whole spectrum of respiratory sleep disorders, the degree of instability as measured by the NEP technique is correlated with the severity of sleep disordered breathing. Although the best cut off value (EFL ⩾27.5%) results in moderate changes in the post-test probability, EFL measured in the supine position appears to be the best single and simple diurnal respiratory function test for predicting OSAS in a clinic based population. Further studies are needed to confirm these results and to determine the potential role of NEP in the diagnostic work-up of OSAS.
Acknowledgments
The authors thank Karim Zouaoui Boudjeltia for statistical advice.
REFERENCES
Footnotes
-
Competing interests: None declared