Article Text

Abstract
Background: A limited or absent bronchodilator response is used to classify chronic obstructive pulmonary disease (COPD) and can determine the treatment offered. The reliability of the recommended response criteria and their relationship to disease progression has not been established.
Methods: 660 patients meeting European Respiratory Society (ERS) diagnostic criteria for irreversible COPD were studied. Spirometric parameters were measured on three occasions before and after salbutamol and ipratropium bromide sequentially or in combination over 2 months. Responses were classified using the American Thoracic Society/GOLD (ATS) and ERS criteria. Patients were followed for 3 years with post-bronchodilator FEV1 and exacerbation history recorded 3 monthly and health status 6 monthly.
Results: FEV1 increased significantly with each bronchodilator, a response that was normally distributed. Mean post-bronchodilator FEV1 was reproducible between visits (intraclass correlation 0.93). The absolute change in FEV1 was independent of the pre-bronchodilator value but the percentage change correlated with pre-bronchodilator FEV1 (r=−0.44; p<0.0001). Using ATS criteria, 52.1% of patients changed responder status between visits compared with 38.2% using ERS criteria. Smoking status, atopy, and withdrawing inhaled corticosteroids were unrelated to bronchodilator response, as was the rate of decline in FEV1, decline in health status, and exacerbation rate.
Conclusion: In moderate to severe COPD bronchodilator responsiveness is a continuous variable. Classifying patients as “responders” and “non-responders” can be misleading and does not predict disease progression.
- chronic obstructive pulmonary disease
- bronchodilator reversibility
Statistics from Altmetric.com
Chronic obstructive pulmonary disease (COPD) is currently defined by the presence of airflow limitation, measured by the forced expiratory volume in 1 second (FEV1), that shows little or no improvement after inhaled bronchodilator drugs.1–3 Selection of the maximum change in FEV1 compatible with a diagnosis of COPD has proved difficult, but could be important clinically. Approximately 10% of patients with COPD show a short term spirometric “response” to a course of oral corticosteroids4 that is maintained during subsequent inhaled corticosteroid treatment.5 This is most likely to occur in those patients with a substantial (>400 ml) improvement in FEV1 after oral corticosteroids.6 A positive bronchodilator response may define a different natural history,7,8 while European regulators now require that COPD patients included in treatment trials meet the European Respiratory Society (ERS) definition of irreversible disease. Bronchodilator testing can therefore have both clinical and regulatory importance.
Several criteria have been proposed to define a significant bronchodilator response.9 Each has tried to encompass the known variability in FEV1 measurements between and within days10 by including a threshold value to reduce the risk of a chance finding. However, the approaches adopted differ. The American Thoracic Society (ATS) and the Global initiative for Obstructive Lung Disease (GOLD) both use a change of >12% of the baseline if this also exceeds 200 ml,11,12 while the ERS recommends a change that is >9% of the predicted FEV1.13 Many reports simply quote a percentage change from baseline, which varies between 12 and 20%.14 The reliability of these definitions has been challenged previously by data from the IPPB study15 and in primary care where the patients studied had relatively mild disease and the stability of the categorisation was not assessed.9 Direct comparisons between the different criteria and the effect of adding other bronchodilator drugs on the subsequent response rate have not been reported in large numbers of stable patients with moderate to severe COPD. Other factors such as smoking status, atopy, or changes in treatment may also influence the likelihood of a response.16
To determine whether routine bronchodilator testing is a robust measurement in individual patients already classified as having “poorly reversible” COPD, we examined data from the pre-randomisation phase of the ISOLDE (Inhaled Steroids in Obstructive Lung Disease) study.17 We hypothesised that the number of patients classified as reversible would be influenced by spontaneous variation in airway calibre and by the use of additional test drugs, regardless of the choice of threshold for reversibility. We also tested the effect of atopy, smoking status, or the withdrawal of inhaled corticosteroids on the response to inhaled bronchodilators. Finally, we tested the hypotheses that the size of the bronchodilator response predicted the subsequent rate of decline in FEV1, health status, or exacerbation rate over the following 3 years.
METHODS
Patients were recruited from the outpatient clinics of 18 UK hospital centres. All had a clinical diagnosis and symptoms compatible with non-asthmatic COPD and met both the ERS and ATS1,2 spirometric criteria for this disorder. All were aged 40–75 years and were current or ex-tobacco smokers. Their baseline post-salbutamol FEV1 was at least 0.8 l but <85% predicted and all had a ratio of FEV1 to forced vital capacity (FVC) of <70%. At the first visit we excluded from further follow up those patients whose FEV1 improved after inhaled salbutamol by more than 10% of their predicted FEV1. Other exclusion criteria included the use of β adrenergic blockers, regular oral corticosteroids, or co-morbidities likely to reduce life expectancy below 5 years. Nasal and ophthalmic corticosteroids, theophyllines, other oral bronchodilators, and any inhaled bronchodilators were allowed. All patients gave their written informed consent before the study, which was approved by the local ethical committees of the participating institutions.
Measurements
All spirometric measurements were made using identical rolling seal spirometers (Sensormedics 2130D, BV Warwickshire, UK). Forced expiratory manoeuvres were performed in a standardised fashion13 and the best FEV1 and FVC recordings within 50 ml of each other were accepted. We developed an intra-centre and inter-centre quality control protocol based on the criteria used in the Lung Health Study.18 These were modified to accept an FVC in which a volume change of <40 ml in a 2 second period was not required provided that the forced expiratory time exceeded 12 seconds. Each spirometric recording was reviewed centrally and the percentage of tests meeting the external quality control criteria was fed back to the study centre to ensure high quality data throughout the study. Patients were asked to omit short acting inhaled bronchodilators for 4 hours before attendance, and long acting oral and inhaled agents for 12 hours. If the patient experienced a respiratory tract infection or exacerbation of COPD requiring treatment in the 4 weeks before their clinic visit, this was re-scheduled to provide valid spirometric testing.
Smoking status was assessed using exhaled breath carbon monoxide (CO) measured after a 20 second breath hold using a mini Smokerlyzer (Bedfont Technical Instruments Ltd, Kent, UK). Urinary cotinine was measured by thiocyanate assay in all patients during the run-in and subsequently in patients who claimed not to be smoking but had an expired CO level of >8 ppm. Self declared non-smokers were classified as smokers if their urinary cotinine concentration was >40 mg/ml and expired CO was >10 ppm or if the urinary cotinine value was missing but the expired CO was >10 ppm on more than two visits.
Atopic status was assessed objectively by skin prick testing to four common allergens (Aspergillus fumigatus, Dermatophagoides pteronyssinus, cat dander, and mixed grass pollen) together with a positive and negative control. Individuals were considered to be atopic if they reacted with a wheal of more than 3 mm in diameter to more than one of these allergens. Testing for atopy was conducted at the time of the first attendance.
Study protocol
Patients attended on three occasions at 4 weekly intervals before treatment randomisation. On the first occasion (V0) they performed spirometric tests, then received 400 μg salbutamol via a large volume spacer (Volumatic) and spirometric tests were repeated after 30 minutes. Ipratropium bromide 80 μg was then given via the spacer and spirometric tests were repeated 30 minutes later. At the next attendance (V1) the order of the drugs was reversed, while on the third visit (V2) salbutamol inhalation was immediately followed by ipratropium and spirometric testing at 30 minutes. After V2, patients were randomised to receive either fluticasone 500 μg twice daily via the spacer or an identical placebo. They attended 3 monthly for repeat spirometric testing as described at V2 until 3 years of follow up had been completed or they had withdrawn from the study.
Data analysis and statistical methods
The change in spirometric values after bronchodilation were expressed as: (a) absolute change (ml); (b) percentage change from baseline; and (c) change in percentage predicted normal values. Spirometric values for the normal population used the ECCS formulae.13
Student’s t tests were used to test differences from baseline and differences in mean values between visits. FEV1 repeatability was measured using the intraclass correlation coefficient. The relationship between pre-bronchodilator values and bronchodilator response was estimated using regression coefficients.19 Interactions with smoking status, sex, and atopy were investigated using analyses of covariance. The rate of decline in FEV1 was derived using the placebo data set only and was expressed as the change in post-bronchodilator FEV1 (ml) per year. These data were analysed using a random coefficients mixed effects model as described by Burge et al.17 Similarly, data for the change in health status with time and the exacerbation rate were collected and analysed as described in detail by Burge et al.17 All tests were two sided with a 5% level of significance. Data are expressed as mean (SE) unless otherwise stated.
RESULTS
Study population
Of the 990 patients fulfilling the entry criteria, 751 completed the 2 month run-in and were randomised, 375 receiving placebo. Of the randomised population, 54% had used regular inhaled corticosteroids before the study. Complete data at all three bronchodilator assessments were available for 660 patients. The loss of data in the remaining 91 patients was largely due to delayed assessment because of respiratory tract infections; these patients did not differ significantly in any baseline characteristic or prior treatment from those who are reported here. Details of the study population are presented in table 1 based on measurements made at V0.
Demographic and lung function characteristics of study subjects
Response to bronchodilator drugs
FEV1 and FVC both increased significantly after inhaled salbutamol at V0 (mean change in FEV1 128 (4) ml, mean change in FVC 286 (12) ml). A further significant increase in both variables occurred after ipratropium (fig 1). The pre-bronchodilator FEV1 at V1 was lower than at V0 (p<0.0001), and the increase in FEV1 after ipratropium (the first drug given at V1) was larger than when salbutamol was given first at V0. The change in FEV1 when ipratropium was added to salbutamol at V0 was 63 (4) ml, and the change when salbutamol was added to ipratropium at V1 was 39 (4) ml (difference 24 ml, p<0.0001). There were no significant differences in the mean post-bronchodilator FEV1 between V1 and V2 or in the mean bronchodilator response at any visit. The intraclass correlation coefficient for pre-bronchodilator FEV1 was 0.91 and for post-bronchodilator FEV1 was 0.93 for the three visits.

Mean (SE) FEV1 before and after salbutamol, ipratropium, and the combination on three occasions at monthly intervals. Note the differences in pre-bronchodilator values between visits and the lack of change in post-bronchodilator FEV1 after the combination at visits 1 and 2.
The distribution of the change in FEV1 expressed as a percentage of predicted after salbutamol was censored by our inclusion criteria (fig 2). The distribution became more obviously normal when data after both salbutamol and ipratropium were plotted (fig 3A). Similar patterns were seen when the absolute change in FEV1 and percentage change from baseline were used, although the latter group were skewed towards apparent responsiveness (fig 3B and C).
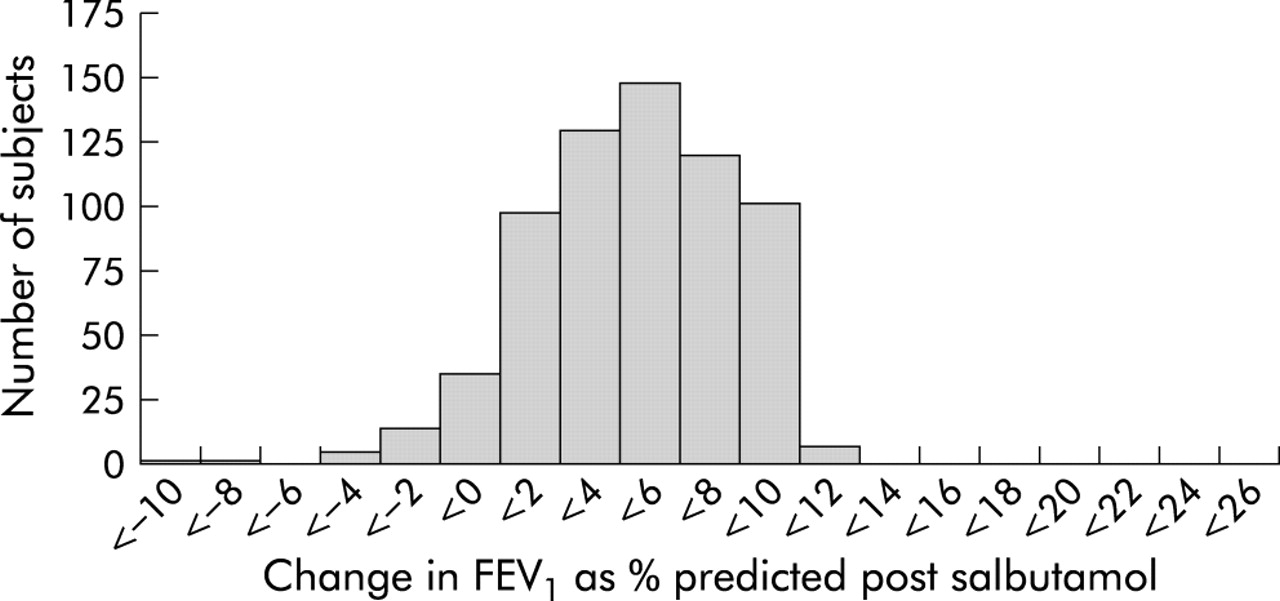
Histograms of the distribution of bronchodilator response seen in data derived at visit 0 after salbutamol alone.
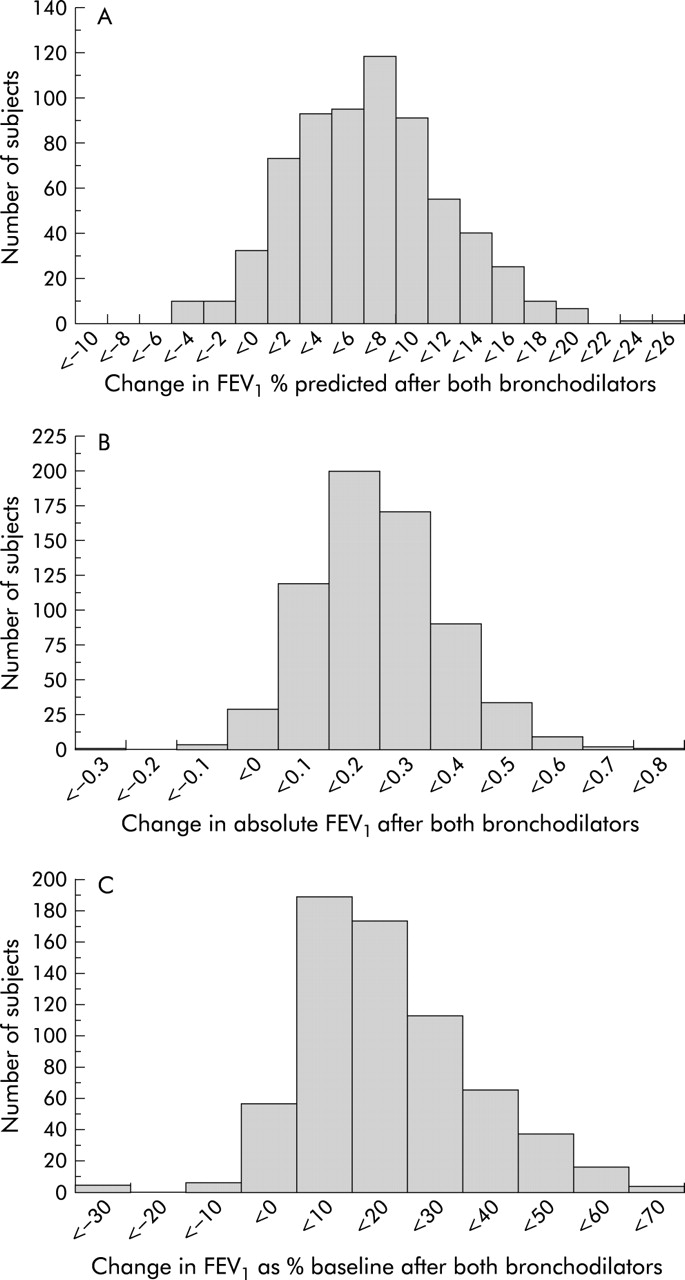
Data at the same visit as fig 2 but after salbutamol and ipratropium and expressed as (A) percentage of predicted FEV1, (B) absolute change in FEV1, and (C) percentage change from baseline.
Influence of baseline FEV1 on likelihood of being classified as responsive
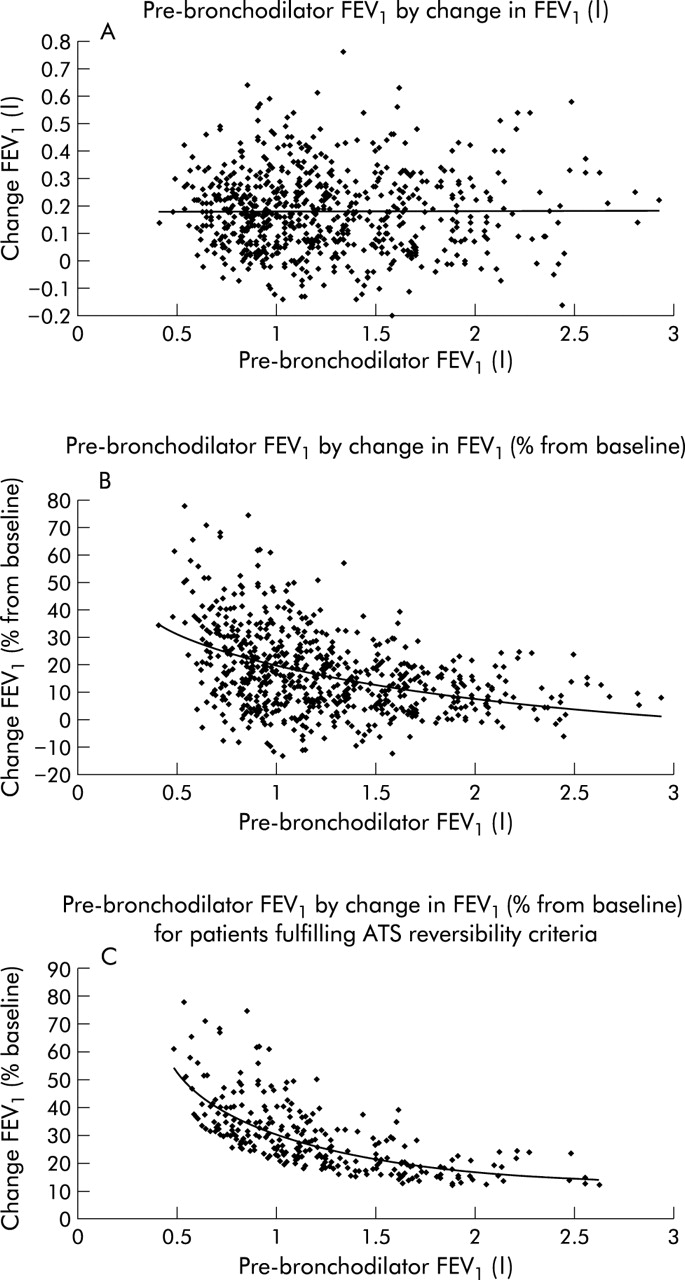
The relationships between the pre-bronchodilator FEV1 and the size of the bronchodilator response expressed in different ways are shown in fig 4 using data from V2. The change in FEV1, whether expressed as an absolute value or as a percentage of predicted, was uninfluenced by the pre-bronchodilator FEV1 when measured in absolute units. When the data were expressed as a percentage change from baseline there was a clear curvilinear relationship with the pre-bronchodilator FEV1, best described using a power function (r=0.17, p<0.0001). This relationship persisted (r=0.44, p<0.0001) even when patients whose FEV1 changed by less than 200 ml were excluded (fig 4C).

Relationship between the response to bronchodilator and the pre-bronchodilator FEV1 at visit 2. (A) Absolute change in FEV1 is unrelated to initial FEV1. (B) Change as a percentage of baseline FEV1 is related to initial FEV1 in a curvilinear fashion which persisted even when the ATS absolute volume criteria were included (C).
Reproducibility of the response
The reliability of the patient’s responder classification is shown in fig 5 using data obtained following both bronchodilator drugs. Using the ATS classification, only 103/275 (37%) of those initially classified as reversible remained so on the two subsequent visits while 213/385 (55%) of those classified as irreversible showed equally inconsistent results. Comparable figures for the ERS classification were 32/149 (21%) initially classified as reversible and 375/511 (73%) as irreversible. Overall, 52% of patients classified by ATS criteria and 253/660 (38%) classified using ERS criteria would be reclassified if tested on a different occasion. There was a significant association (p<0.0001) between the change in pre-bronchodilator FEV1 between visits and the change in response classification—that is, an increase in pre-bronchodilator FEV1 between visits was likely be associated with reclassification to being irreversible and, conversely, a fall in pre-bronchodilator FEV1 between visits led to reclassification as reversible. Patients identified as being consistently reversible by ATS and ERS classifications are compared in table 2. There were no significant differences between these groups in the numbers of smokers and atopic subjects.
Demographic characteristics of patients consistently reversible and irreversible using ATS and ERS criteria

Changes in responder classification and corresponding subgroup mean FEV1 at each visit after both bronchodilators using (A) American Thoracic Society and (B) European Respiratory Society criteria. Numbers in circles refer to the total classified as positive responders at that visit and those in squares are the non-responders on the same occasion. Note that some patients in the ERS criteria group exhibited a “response” after both drugs at the first visit despite being classified as non-responsive to salbutamol alone.
Using data obtained at V2 following both bronchodilators, the absolute change in FEV1 was unrelated to smoking status or atopy. There were no sex differences in the magnitude of response to bronchodilators. In this study 53% of the population had inhaled corticosteroids withdrawn at screening but there was no difference in the change in FEV1 at V2 between these patients and those who had not previously received inhaled corticosteroids.
Bronchodilator response as a predictor of subsequent disease progression
The mean rate of decline in FEV1 in placebo treated patients was 53 ml per year. We found no relationship between the absolute or percentage predicted changes in FEV1 after bronchodilator and the subsequent rate of decline in FEV1 in our model which controlled for the baseline post-bronchodilator data. The mean rate of decline in health status was unrelated to baseline bronchodilator response (p=0.4). Bronchodilator response was divided into responders and non-responders by the median value (170 ml). Decline in health status was not significantly different between the two groups (responders 2.8 units/year; non-responders 3.4 units/year; p=0.3). The annual rate of exacerbations was not significantly different between the two groups (responders 1.5 exacerbations/year; non-responders 1.5 exacerbations/year; p=0.6).
DISCUSSION
COPD is now defined using the combination of a clinical history and objective evidence of airflow limitation. Data from this study show that these criteria identify patients with an accelerated rate of decline in FEV1. However, the distinction from chronic asthma with limited reversibility remains difficult, and most treatment guidelines use the spirometric response to a bronchodilator drug to aid the diagnosis and, in some cases, to make recommendations about treatment decisions.12 Previous studies have examined the ability of bronchodilator testing to differentiate between asthma and COPD in milder disease and have found no clear distinction spirometrically between the two.9,20 This has not prevented these criteria being widely recommended in the assessment of more severe COPD or in the selection of patients for inclusion in treatment trials.17,21 In this study we examined the reliability of the bronchodilator response in moderate to severe COPD defined as “poorly reversible” disease by one set of criteria and have related it to clinically relevant outcomes. Our data suggest that the current definitions of bronchodilator reversibility have significant limitations in established COPD and may be potentially misleading.
As in the EUROSCOP trial,22 we selected patients with a <10% change in predicted FEV1 after an inhaled β agonist. The distribution of bronchodilator responses using this criterion was censored but returned towards normal once the second bronchodilator drug was added. In these patients we could not identify a separate population of more responsive patients however the data were expressed.
Using a second drug, whether ipratropium or salbutamol, increased the mean FEV1 and changed the number of patients classified as reversible. The group mean change in FEV1 after each drug was reproducible between visits despite the significant fall in pre-bronchodilator FEV1 which was probably related to both the withdrawal of inhaled corticosteroids and regression to the mean.23 The post-bronchodilator FEV1 values were highly correlated between visits, supporting the use of this measurement as the principal outcome in longitudinal studies of the evolution of the disease.
Neither the American nor European definitions were acceptably reproducible. Over half the patients initially classified as reversible by the ATS/GOLD definition would be reclassified had they attended on another occasion. Likewise, 38% of those classified by the European criteria changed their apparent responder status with time, despite all being irreversible to salbutamol alone at the first visit.
A further problem with the ATS and GOLD definitions, but not with those based on an absolute or percentage predicted change, is their dependence on the baseline FEV1 even when an initial absolute value of 200 ml is considered a threshold for this measurement (fig 4C). This may suggest that a substantial degree of reversibility is present even when the absolute increase in FEV1 is similar to that seen in less severe disease. The absolute changes in FEV1 we saw were similar to that in much milder disease in the Lung Health Study.18
Our data were uninfluenced by differences in sex, current smoking status, atopic status, or the prior use of inhaled corticosteroids. Neither smoking status nor atopy were over-represented in the patients who showed the most “consistent” positive responses, suggesting that improvement in lung function in COPD does not correspond to either an asthmatic or ex-smoking phenotype. Patients treated previously with inhaled corticosteroids did not differ in their bronchodilator responses from those not so treated. The most likely explanation for the between day variation in classification is the effect of small fluctuations in bronchomotor tone as shown by the inverse relationship between pre-bronchodilator FEV1 and the chance of a change in responder classification. Similar fluctuations in airway calibre have been noted in other COPD populations and have been related to the degree of cholinergic tone in the airway smooth muscle.6,24
Our model of the rate of decline in FEV1 controlled for the post-bronchodilator FEV1 value obtained during the run-in period. We found no evidence for a relationship between the change in FEV1 after bronchodilators, however expressed, and the rate of decline in lung function. We confined our analysis to the placebo treated patients to exclude any confounding effects of the inhaled corticosteroids. Our data contrast with those obtained from a more mixed population where only partial analysis of the FEV1 decline was available.7 It emphasises the difficulty of using measures like a bronchodilator “response” in patients with more severe and structurally determined airflow limitation. Our results are in keeping with a long term Danish population study where COPD mortality was related to both pre-bronchodilator FEV1 and the change in FEV1 at study entry, but the latter variable was no longer significant when the relationship was expressed in terms of the post-bronchodilator value.25 The failure of the response to predict future changes in health status or exacerbation frequency is not surprising given the limitations of this measurement.
We could not, for logistic reasons, include a group receiving placebo inhalations but felt that the reproducibility of the FEV1 which this assesses has been reported sufficiently frequently to make this unnecessary.10,13 The doses of the bronchodilator drugs may not have been maximal26,27 or optimally timed, but these minor differences are unlikely to have systematically affected our results. This study specifically addressed the usefulness of classifying patients who are believed to have COPD on their response to one dose of one bronchodilator, a common clinical situation. The conclusion that this is a continuously distributed response susceptible to the number of drugs used and day of testing suggests that, even in this group of patients, identifying responder status in this way is of little practical value. We cannot address whether this would be true for those with a more substantial bronchodilator response, but the variability in the tail of our response distribution suggests that it may also be true in these cases.
Our data are not surprising given the day to day variation in bronchomotor tone and the arbitrary nature of the definitions adopted. Unfortunately, many clinicians still rely on these responses to decide whether patients have COPD and what treatment they should receive, while regulators in Europe and North America take very different views about the inclusion of reversibility data in clinical treatment trials. A major purpose of this study has been to alert them and the regulatory authorities to the significant limitation of any classification currently in use. This variability in classification helps to explain the unreliability of bronchodilator responsiveness as a predictor of improvement after treatment.28,29 If bronchodilator response data are to be presented in COPD, then the absolute change in FEV1 should be reported without making prior assumptions about its diagnostic significance.
Acknowledgments
This study would not have been possible without the sustained efforts of a large number of people who are listed in detail in the appendix to reference 18. Particular mention is due to Dr John Poundsford for his help in the early stages of data evaluation and to Ms Lisa Willits for her significant contribution to the statistical analysis of these data.
REFERENCES
Footnotes
-
This study was supported by a research grant from GlaxoSmithKline plc.
Linked Articles
- Airwaves