Article Text

Abstract
Background: The levels of exhaled and nasal nitric oxide (eNO and nNO) in groups of patients with inflammatory lung diseases are well documented but the diagnostic use of these measurements in an individual is unknown.
Methods: The levels of nNO and eNO were compared in 31 children with primary ciliary dyskinesia (PCD), 21 with non-CF bronchiectasis (Bx), 17 with cystic fibrosis (CF), 35 with asthma (A), and 53 healthy controls (C) using a chemiluminescence NO analyser. A diagnostic receiver-operator characteristic (ROC) curve for PCD using NO was constructed.
Results: The median (range) levels of nNO in parts per billion (ppb) in PCD, Bx, CF, and C were 60.3 (3.3–920), 533.6 (80–2053), 491.3 (31–1140), and 716 (398–1437), respectively; nNO levels were significantly lower in PCD than in all other groups (p<0.05). The median (range) levels of eNO in ppb in PCD, Bx, CF, A, and C were 2.0 (0.2–5.2), 5.4 (1.0–22.1), 2.6 (0.8–12.9), 10.7 (1.6–46.7), and 4.85 (2.5–18.3), respectively. The difference in eNO levels in PCD reached significance (p<0.05) when compared with those in Bx, A and C but not when compared with CF. Using the ROC curve, nNO of 250 ppb showed a sensitivity of 97% and a specificity of 90% for the diagnosis of PCD.
Conclusions: eNO and nNO cannot be used diagnostically to distinguish between most respiratory diseases. However, nNO in particular is a quick and useful diagnostic marker which may be used to screen patients with a clinical suspicion of PCD.
- exhaled nitric oxide
- airway inflammation
- primary ciliary dyskinesia
- children
Statistics from Altmetric.com
Nitric oxide (NO) is synthesised from the amino acid l-arginine by three forms of the enzyme NO synthase (NOS), two of which are constitutive (cNOS) and are found in endothelial cells (eNOS) and neuronal cells (nNOS) and one of which is inducible (iNOS).1,2 NO can be measured in orally exhaled air or sampled directly from the nasal cavity. iNOS is induced by proinflammatory cytokines2,3 such as interleukin 1β and tumour necrosis factor α. Epithelial cells also express iNOS after exposure to oxidants via the activation of the transcription factor nuclear factor kappa B (NF-κB) which is critical for transcription of the iNOS gene.2 It has been suggested that eNO may be a non-invasive marker of at least some types of airway inflammation, and some studies4,5 have found high levels of eNO in untreated asthma which fall when anti-inflammatory treatment is initiated. Despite the intense airway inflammation in cystic fibrosis (CF), eNO levels are lower than in normal subjects6 so eNO clearly cannot be considered to reflect all types of airway inflammation. Children with primary ciliary dyskinesia (PCD) have been shown to have very low levels of eNO and nNO7,8 despite commonly having purulent airway secretions, a paradox which is as yet unexplained.
Despite the intense research interest in NO, it is unclear whether it has a role either in the diagnosis of airway diseases or monitoring anti-inflammatory treatment. Although it is relatively easy to show differences in eNO and nNO between groups of children with different diseases, the diagnostic usefulness (if any) of these measurements in individual children has never been demonstrated. The aim of this study was therefore to record eNO and nNO levels in a series of children with different inflammatory airway diseases and to compare them with normal values to evaluate whether they are useful measurements in the differential diagnosis for an individual child in the clinic. Subsidiary aims were to try to determine why eNO and nNO levels are so low in PCD, and to shed some light on the physiological importance of NO in the airway.
METHODS
Subjects
All patients were regularly attending paediatric respiratory clinics at the Royal Brompton Hospital. The entry criteria were that all subjects had a definitive diagnosis on standard criteria, were above 6 years of age in order to be able to undertake the manoeuvre for NO analysis,4,7 and were able to perform spirometric tests.
Five groups were studied:
PCD group: 31 children in whom PCD was diagnosed by nasal brushing with estimation of ciliary beat frequency (CBF) and electron microscopy.9
Non-CF bronchiectasis group: 21 patients with bronchiectasis were diagnosed by high resolution computed tomographic (CT) scanning. All had a negative sweat test and normal ciliary beat frequency, excluding CF and PCD respectively. pH studies were performed where it was considered appropriate to exclude gastro-oesophageal reflux. Two patients were known to have hypogammaglobulinaemia and were in a programme of replacement therapy. Despite intensive investigation, no underlying cause was found in the other patients.
Cystic fibrosis group: 17 patients with known CF diagnosed by either or both of a positive sweat test or a genotype showing two known CF mutations.10
Asthma group: 35 children with asthma previously diagnosed on the basis of two or more of the following: cough, physician diagnosed wheeze and dyspnoea with evidence of bronchial hyperreactivity shown by peak flow variability, acute response to bronchodilator or exercise induced bronchoconstriction.11
Healthy group: 53 healthy children without a history of chronic or recent acute respiratory disease who were either children of staff or recruited from siblings of children attending the asthma or a general clinic at either the Hammersmith or Royal Brompton Hospitals, London.
Measurements
The use of inhaled and/or oral steroids, antibiotics, and immunoglobulin therapy was noted. A clinical examination was performed before testing.
Spirometry
Spirometric tests were performed using a portable spirometer (Compact Vitalograph) calibrated before each set of measurements with a 1 litre syringe. Three technically acceptable manoeuvres were performed and the manoeuvre with the largest forced expiratory volume in one second (FEV1) was recorded.
Nitric oxide measurement
NO was measured using a chemiluminescence analyser (LR 2000 series, Logan Research, Rochester, UK) according to the method recommended by the ERS Task Force Report.12 This equipment was sensitive to NO from 1 to 5000 ppb and gave continuous online recordings with a resolution of about 0.3 ppb with a response time of 0.4 seconds. In addition to NO, the analyser also measured carbon dioxide (CO2), resolution 0.1% CO2, response time 200 ms, with exhalation pressure and volume displayed in real time. The analyser was calibrated weekly using certified NO mixtures (90–500 ppb) in nitrogen (BOC Special Gases, Guildford, UK). Ambient air NO levels were also recorded. All tests were performed with ambient NO levels of <100 ppb.
Exhaled lower airway sampling (eNO)
This was attempted in all children. After maximal inspiration, subjects exhaled for as long as possible (slow vital capacity manoeuvre) into a wide bore tube. A fine bore Teflon tube connected directly to the analyser continuously sampled the exhaled air adjacent to the mouthpiece at 0.25 l/min. In all these manoeuvres subjects wore a nose clip and kept the flow during expiration within a constant range by the use of auditory and visual guides (lights, the flapping ears of a plastic dog and a musical sound), which was activated when exhalation was within the required range of expiratory flow (200–280 ml/s). The pressure generated during the manoeuvre (5–20 cm H2O) was sufficient to exclude nasal NO contamination by raising the soft palate to isolate the nasopharynx. The trace was observed until the end tidal CO2 pressure reached a plateau—that is, less than a 5% change for at least 10 seconds and the NO concentration at the end of exhalation was recorded as this plateau value. The test was repeated five times and the mean value was calculated. A result was only excluded if it was not possible to determine a plateau value because expiration time or control of expiratory flow was inadequate.
Nasal sampling
A Teflon tube was inserted just inside one nostril while the contralateral nostril was left open. Air was sampled continuously at 250 ml/min during a breath hold and was maintained as long as possible. NO concentrations were recorded when the values reached a plateau. Nasal CO2 was also monitored to ensure that there was no contamination by alveolar gas. This test was repeated three times in each nostril and the mean value of all six measurements was calculated.
Ethics
The Royal Brompton Hospital ethics committee gave approval for the study. Written informed consent was obtained from all parents of children taking part in the study and consent was also obtained from the children themselves.
Statistical analysis
Statistical analysis was performed using Minitab Software. Comparison of NO levels between groups was performed using non-parametric tests after examination of the data using the Kolmogorov-Smirnov normality test. The Kruskal-Wallis test was used to assess whether differences exist between the median NO values in the groups. Similarly, the test was used to see if differences existed between the mean FEV1 values in the groups. A p value of <0.05 was considered significant. Positive and negative predictive values of nNO as a diagnostic screening test were calculated. Correlations between NO levels and FEV1 were made using the Spearman's rank test. The receiver operator characteristic (ROC) curve using NO levels for the diagnosis of PCD was calculated using SSPS version 9.0.
RESULTS
Patient details are shown in table 1. nNO measurements were obtained in all but the asthma group. eNO measurements were obtained in all groups.
Characteristics of study patients
Nasal NO (nNO) levels
The results are shown in fig 1. The median (range) nNO levels in parts per billion (ppb) in the PCD, Bx, CF, and control groups were 60.3 (3.3–920), 533.6 (80–2053), 491.3 (31–1140), and 716 (398–1437), respectively. The median upper airway NO levels were significantly lower in the PCD group than in all the other groups (p<0.05). More specifically, only one patient with PCD had an nNO value greater than 250 ppb. The remaining patients with PCD had nNO levels <250 ppb and 25/31 (80%) had nNO levels of <100 ppb. However, there was some overlap; three CF and three Bx patients also had nNO levels of <250 ppb. One of the patients with CF had an nNO level of <100 ppb. The remaining CF and Bx patients all had nNO levels of >250 ppb.

Box plots showing median and interquartile ranges of nasal nitric oxide (NO) levels in children with primary ciliary dyskinesia (PCD), non-cystic fibrosis bronchiectasis (Bx), cystic fibrosis (CF), and controls (C). Levels were not available in the asthma group. *Outliers.
If an NO level of <250 ppb is taken as diagnostic for PCD, this has a positive predictive value of 0.83 (30/36). The negative predictive value was 0.97 (43/44). The receiver-operator characteristic (ROC) curve using nNO as a diagnostic tool in PCD is shown in fig 2. Using this ROC curve, an nNO level of 100 ppb will have a sensitivity of 75% and a specificity of 96%; an nNO level of 250 ppb will have a sensitivity of 97% and a specificity of 90%.

Receiver-operator characteristic (ROC) curve showing nasal nitric oxide (NO) levels (ppb) as a diagnostic test for primary ciliary dyskinesia. Selected cut off points are marked.
There was no correlation between FEV1 or any other spirometric value and nNO, either for the individual groups or for the study population as a whole.
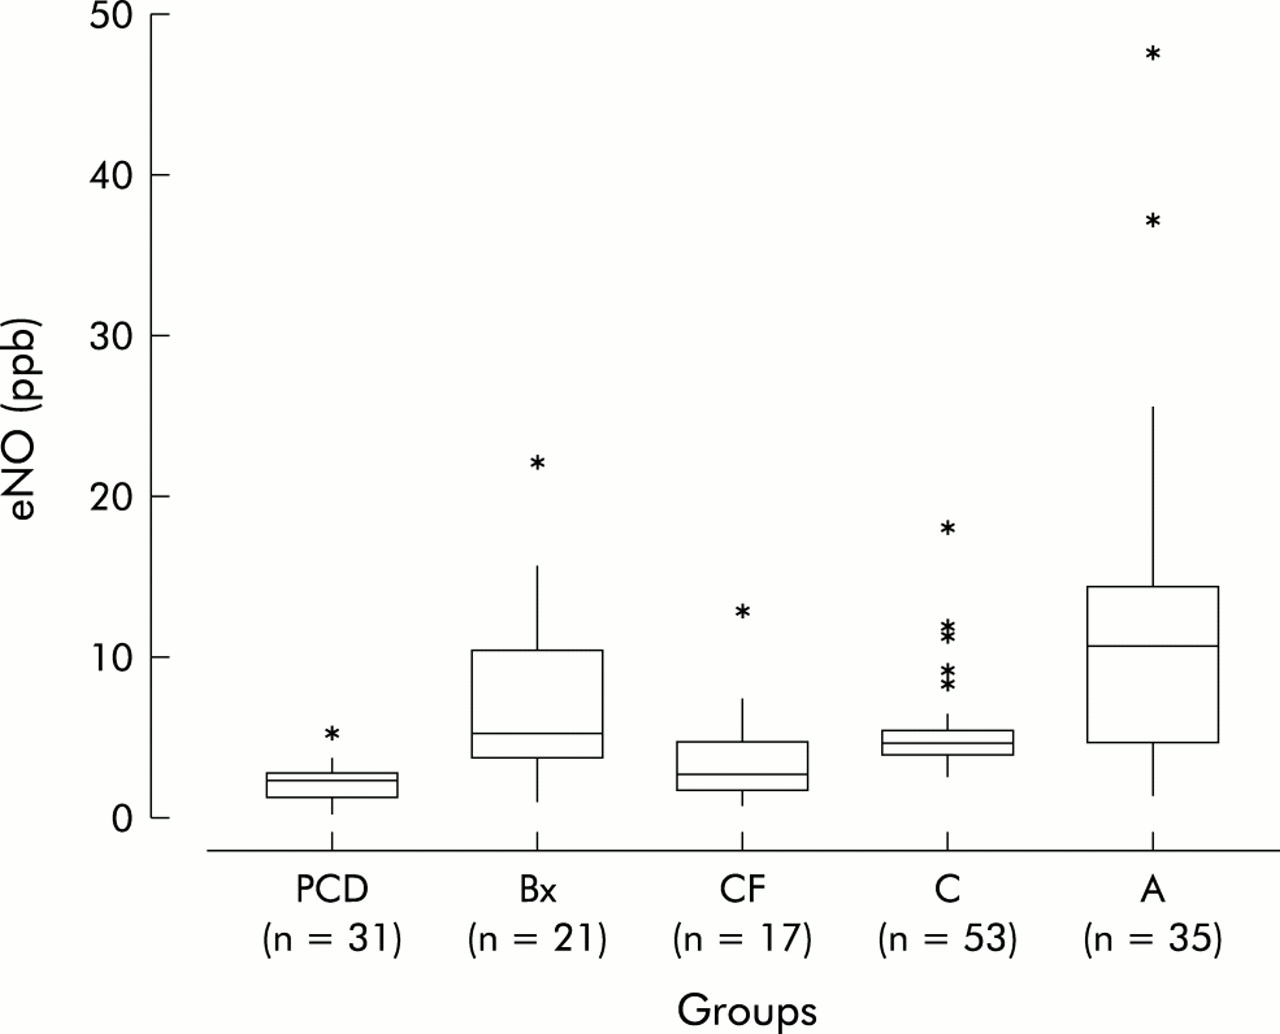
Exhaled nitric oxide (eNO) levels
The results are shown in fig 3. The median (range) eNO levels (ppb) in children with PCD, Bx, CF, asthma, and control subjects were 2.0 (0.2–5.2), 5.4 (1.0–22.1), 2.6 (0.8–12.9), 10.7 (1.6–46.7), and 4.85 (2.5–18.3), respectively. The median eNO levels were significantly lower (p<0.0001) in the PCD group than in the Bx, A, and C groups. There was no difference between PCD and CF. There was no significant difference in eNO levels between 20 children with PCD treated with steroids (median eNO = 2.6 ppb (range 0.2–4.9)) and 11 children who were not treated with inhaled steroids (median eNO =1.5 ppb (range 0.8–2.8)). Similarly, in children with Bx the use of inhaled steroids did not significantly alter the eNO levels (inhaled steroids, n=10, eNO = 6.7 ppb (range 1.0–22.4); those not on inhaled steroids, n=11, eNO = 4.7 ppb (range 1.9–22.1)). No significant difference in eNO levels was found in children with asthma between those on inhaled steroids (n=25, median eNO = 11.6 ppb (range 1.7–46.7)) and steroid naïve children (n=10, median eNO = 8.35 ppb (range 2.8–25.2)). There was no difference in eNO levels between children with CF and normal subjects, nor between children with Bx and normal subjects. eNO levels of >25.0 ppb were only seen in children with a diagnosis of asthma. The positive and negative predictive values using this value as diagnostic of asthma were 100% and 80%, respectively.
Box plots showing median and interquartile ranges of exhaled nitric oxide (eNO) levels in children with primary ciliary dyskinesia (PCD), non-cystic fibrosis bronchiectasis (Bx), cystic fibrosis (CF), controls (C), and asthmatics (A). *Outliers.
There was no correlation (p=0.74) between eNO levels and FEV1. The FEV1 of the PCD group was significantly higher (p<0.05) than the CF group, significantly lower (p<0.05) than the group with asthma, and was no different from the Bx group (table 1).
DISCUSSION
The results of this study have confirmed that the levels of both nNO and eNO are very low in children with PCD, and suggest that nNO levels of >250 ppb exclude this diagnosis with 97% certainty. Children with CF and Bx as well as those with PCD may also have levels of nNO <250 ppb, so the diagnosis of PCD should always be confirmed by a nasal brushing.9 In adults diffuse panbronchiolitis is associated with low nNO levels; we were not able to find any such cases in children attending our clinic, so are unable to comment on this observation.13 eNO is less diagnostically useful, although it should be noted that no patient with PCD had a value of >6.0 ppb. Only children with asthma had eNO levels above 25.0 ppb. There was no significant difference in eNO levels between asthmatic subjects taking inhaled steroids and steroid naïve subjects. However, in the former subgroup we did not distinguish between those with severe or uncontrolled asthma on high dose inhaled steroids and those with mild asthma taking low dose inhaled steroids. A recent study showed that there was no relationship between eNO levels, symptoms, and different treatments for asthma.14 We report for the first time that children with Bx do not have significantly increased eNO levels, irrespective of treatment with inhaled steroids, unlike reports in adults.15 Finally, we found no correlation between airway obstruction as measured by FEV1 and eNO, either for the study group as a whole or within individual patient categories.
The readings were made using strictly standardised conditions in order to ensure accurate and reproducible measurements. We checked that the nasal samples were not contaminated by expired gas from the lower airway by observing that there was no CO2 signal. For the expired gas measurements, a resistor in the expiratory circuit prevented nasal contamination of the expirate by preventing backflow from the nasopharynx.16 Standardisation of the respiratory flow rate with auditory and visual signals minimised flow dependent variability of the measurements.17 However, as flow decreases, eNO levels increase and flows of less than 100 ml/s are felt to amplify differences between health and disease. It could be that using lower flows in this study would have helped to distinguish between the groups. Ambient NO levels had no effect on the recorded NO levels, as previously reported.17 We therefore believe that our measurements represent uncontaminated nasal and lower airway samples, and the differences between PCD and the other groups are not related to methodology.
There are no similar studies of NO levels in different disease groups in children. All our patients had been previously diagnosed; new patients and diagnoses would have been ideal. The atopic status of most of our subjects was not determined, although none of the healthy controls was atopic. This could potentially have influenced the results as higher levels of eNO have been reported in atopic individuals.18 Also, we were not able to measure NO levels in children less than 5 years of age as they are unable to perform the procedure with the equipment available. As with previous studies,7,8 we found very low levels of nNO in children with PCD and lower levels of nNO in patients with CF.6 However, unlike adult studies,15 we found that NO levels were independent of steroid therapy in children with Bx. This could not be accounted for by different doses of inhaled steroids as both our paediatric group and the adult group were taking a similar dose range of inhaled steroids. It is possible that the adult group was compliant with this treatment but that the children were not, although this seems unlikely. Our results are compatible with the lack of any effect on eNO of inhaled steroids in CF. We did not measure NO metabolites in any of the groups; some studies have shown that they are retained in the airways of children with CF.19
A subsidiary aim of the study was to try to determine why eNO and nNO levels are lower in PCD than in children with other diseases. The very low nNO and eNO levels appear paradoxical in an inflammatory disease such as PCD. One possible explanation is simply that diffusion of NO into the airways is prevented by obstruction of the paranasal sinuses secondary to infections (nNO) and airway mucus (eNO). However, this is unlikely for several reasons. Firstly, sinusitis, lower airway inflammation, and excess mucus are virtually universal in CF and, indeed, the lower airway disease in particular is much more severe than in PCD, but eNO and nNO levels were higher in the group with CF. Secondly, there was no correlation between FEV1, a measure of disease severity, and levels of eNO. While accepting that FEV1 is only a surrogate for the extent of any inflammation and excess mucus, the complete absence of any correlation militates against the barrier hypothesis. Furthermore, visual inspection of the data does not suggest that the study was underpowered or that larger numbers would have resulted in a significant correlation being detected.
A second superficially attractive hypothesis might be that there is close linkage between the gene for PCD and the gene for iNOS, with co-inheritance of defects in both. However, there are at least 200 proteins in the cilium and multiple candidate genes located on many different chromosomes, so this suggestion is far fetched.
Since lung disease in PCD is considerably milder than in CF, as shown by differences in lung function in our patients, the hypothesis that NO is an essential molecule for host defence is also unlikely.
A more intriguing and appealing hypothesis stems from the observation of low NO production from myocytes in patients with Duchenne's muscular dystrophy. It has been suggested that mutations in the dystrophin gene result in uncoupling of NOS from the contractile apparatus, with loss of function by some mechanism yet to be determined. Cilia, like myocytes, also contain mechanochemical ATPases and it may be that loss of ciliary function results in reduced NOS output by a similar mechanism.20 Certainly NOS is found close to the ciliary basal apparatus in epithelial cells.20
In conclusion, we have shown that eNO cannot be used to distinguish between individual children with most chronic respiratory diseases. We found very high levels (>25 ppb) only in a small number of children with asthma. Although these measurements could be helpful in the diagnosis of asthma, they are not sufficiently accurate in individuals to exclude conventional diagnostic testing. We also confirm that nNO levels of less than 250 ppb are strongly suggestive of PCD, and an eNO level of more than 6 ppb excludes the diagnosis. Measurements of eNO and nNO levels are valuable adjuncts to diagnosis, in particular in excluding the diagnosis of PCD. However, confirmation of the diagnosis of PCD will always require further testing. Finally, all these data were obtained in children; they should not be extrapolated into the adult population.