Article Text

Abstract
Background: Patients with advanced cystic fibrosis can benefit from non-invasive positive pressure ventilation (NPPV) for the treatment of acute decompensation as well as for the management of chronic respiratory failure. This study was undertaken to compare the physiological effects of non-invasive proportional assist ventilation (PAV) and pressure support ventilation (PSV) on ventilatory pattern, transcutaneous blood gas tensions, and diaphragmatic effort in stable patients with cystic fibrosis and chronic CO2 retention.
Methods: In 12 patients two periods of spontaneous breathing were followed randomly by PSV (12 (3) cm H2O) and PAV (flow assist 4.9 (1.3) cm H2O/l.s, volume assist 18.9 (5.1) cm H2O/l) set for the patient's comfort and administered for 40 minutes with 2 cm H2O continuous positive airway pressure. Ventilatory pattern, transcutaneous blood gas tensions, and surface diaphragmatic electromyography were measured in the last 10 minutes of each application.
Results: On average, both PSV and PAV improved ventilation (+30%), tidal volume (+30%), and transcutaneous CO2 (−7%) while reducing diaphragmatic activity (−30% with PSV, −20% with PAV). Mean inspiratory airway pressure was lower during PAV than during PSV (9.7 (1.9) and 12.9 (2.7) cm H2O, respectively; p<0.05). The mean coefficient of variation of tidal volume was about 20% (range 11–39%) during spontaneous breathing and did not change with either PAV or PSV.
Conclusions: These results show that short term administration of nasal PAV and PSV to patients with stable cystic fibrosis with chronic respiratory insufficiency is well tolerated, improves ventilation and blood gas tensions, and unloads the diaphragm.
- CVF, chronic ventilatory failure
- Edi, electromyograph of the diaphragm
- f, respiratory frequency
- IC, inspiratory capacity
- NPPV, non-invasive positive pressure ventilation
- Pao, pressure at airway opening
- PAV, proportional assist ventilation
- PSV, pressure support ventilation
- Sao2, oxygen saturation
- Tcco2, transcutaneous CO2 pressure
- Tco2, transcutaneous O2 pressure
- Te, expiratory time
- Ti, inspiratory time
- Ttot, total cycle duration
- V`e, minute ventilation
- Vt
- tidal volume
- non-invasive positive pressure ventilation
- chronic respiratory failure
- respiratory muscles
- cystic fibrosis
Statistics from Altmetric.com
- CVF, chronic ventilatory failure
- Edi, electromyograph of the diaphragm
- f, respiratory frequency
- IC, inspiratory capacity
- NPPV, non-invasive positive pressure ventilation
- Pao, pressure at airway opening
- PAV, proportional assist ventilation
- PSV, pressure support ventilation
- Sao2, oxygen saturation
- Tcco2, transcutaneous CO2 pressure
- Tco2, transcutaneous O2 pressure
- Te, expiratory time
- Ti, inspiratory time
- Ttot, total cycle duration
- V`e, minute ventilation
- Vt
- tidal volume
- non-invasive positive pressure ventilation
- chronic respiratory failure
- respiratory muscles
- cystic fibrosis
Patients with advanced cystic fibrosis (CF) can benefit from non-invasive positive pressure ventilation (NPPV) in the treatment of acute decompensation as well as in the management of chronic respiratory failure.1–6 This intervention was initially proposed as a preliminary procedure while waiting for transplantation.1 In some studies NPPV has been delivered in the assist/control mode whereas other authors have used pressure support ventilation (PSV). In recent years a new mode of partial ventilatory support—proportional assist ventilation (PAV)—has been developed with the aim of improving the interaction between the patient and the ventilator.
PAV is a patient guided mode of synchronised partial assistance in which the ventilator pressure output is proportional to the instantaneous effort of the patient. In this mode there is therefore automatic synchrony between the patient's effort and the ventilator cycle. With PAV the level of pressure delivered to the patient increases and decreases according to the demand of the patient, so responsibility for the level and pattern of ventilatory assistance depends entirely upon the patient. A few studies have shown that PAV can produce physiological benefits in patients with acute7,8 and chronic respiratory failure.9,10 However, PAV has never been used in patients with CF.
In view of the theoretical advantages of PAV, we have studied the acute physiological effects of PAV in patients with severe CF and chronic ventilatory failure (CVF).11 Furthermore, because few physiological data are available in patients during NPPV, we have compared the effect of PAV with PSV.
METHODS
The study was approved by the institution ethical committee (Azienda Ospedaliera di Verona, Italy) and was conducted according to the declaration of Helsinki. Informed consent was obtained from the patients before enrolment into the study.
Patients
Twelve patients (eight men) with CVF due to CF were recruited into the study. CVF is defined as a consistent increase in the arterial partial pressure of carbon dioxide (Paco2) above 6 kPa (45 mm Hg) during spontaneous breathing of room air.11 The patients were all in a stable clinical condition when they were recruited into the study, as assessed by stable blood gas tensions and pH, and had been free from exacerbations during the preceding 2 weeks. The characteristics of the patients are shown in table 1.
Mean (SD) demographic, anthropometric, and functional characteristics of study patients (n=12)
Measurements
Lung volumes and arterial blood gas tensions were measured from 1 day to 1 week and from 1–2 days before the study according to standard procedures.12 Transcutaneous CO2 and O2 tensions were measured using TCM3 (Radiometer; Copenhagen, Denmark).
Flow (V') and volume (V) by numerical integration were measured by means of a heated pneumotachograph (3700 Series, Hans Rudolph Inc, Kansas City, MO, USA) connected to a pressure transducer (Sefam MV+, INSERM, Nancy, France) inserted between the nasal mask and the “plateau valve” of the NPPV circuit.13 Pressure at the airway opening (Pao) was measured with a differential pressure transducer (Sefam MV+) connected to one port of the nasal mask. Surface electromyography of the diaphragm (Edi) was measured with an isolated amplifier (Physio-Amp, Francesco Marazza, Monza, Italy). All signals were digitised at a sampling frequency of 1000 Hz and analysed using the software package windaq and advanced codas (DATAQ Instruments, Ohio, USA).
Data analysis
Breathing pattern and airway pressure
Tidal volume (vt), respiratory frequency (f), minute ventilation (V'e), and inspiratory capacity (IC) were computed from the volume signal. Total cycle duration (Ttot), inspiratory time (Ti), expiratory time (Te), and Ti/Ttot were calculated from the flow signal as mean values from 10 minute continuous recordings of flow and volume. The variability in Vt was analysed by calculating the coefficient of variation as the ratio of standard deviation over the mean vt value. Pao was measured as the peak value (Pao,peak) as well as the pressure time integral over Ti (Pao,ti) and Ttot (Pao,Ttot), and the resulting area was divided by the duration of Ti and Ttot, respectively.
Diaphragmatic electromyography
The diaphragmatic electromyogram (Edi) was recorded and filtered as previously described.10 From the filtered Edi signal the total duration of the Edi activity (Ti,Edi) was computed as well as the time between the onset of one burst of activity and that of the next Edi burst (Ttot,Edi) to compute the Edi duty cycle (Ti,Edi/Ttot,Edi).14 The Edi was digitally rectified and processed with the moving mean using a time window of 0.1 seconds. From the moving mean Edi we also measured the peak amplitude in arbitrary units (Edi,peak) expressed as a percentage of the value recorded during spontaneous breathing. The integral of the rectified Edi signal over Ti,Edi was measured and this value was multiplied by the respiratory frequency to obtain the electric power used by the diaphragm over 1 minute (Edi,int).
Setting of ventilator
Non-invasive ventilation was delivered through a commercial nasal mask (Respironics, Murrysville, PA, USA) by means of a Vision ventilator (Respironics) set at a continuous positive airway pressure (CPAP) of 2 cm H2O. PSV was set initially at 8 cm H2O in all patients and the pressure was then increased progressively in steps of 1 cm H2O until the patient felt uncomfortable with the level of assistance. Throughout the procedure the last level of PSV at which the patient felt comfortable was used.
PAV is delivered by the ventilator according to the equation of motion generating a pressure in relation to the spontaneous effort of the patient (Pmus): where E and R are the elastance and resistance, respectively.
A portion of the total mechanical workload (that is, the elastance and resistance) is taken over according to the level of assistance which has been decided by the caregiver and can specifically unload the resistive burden (flow assist, FA) and the elastic burden (volume assist, VA). Hence equation 1 becomes:

To set PAV we followed the procedure described in our previous study.10 Briefly, we started with VA and FA set at the minimum value of 2 cm H2O/l and 1 cm H2O/l.s, respectively, and progressively increased the level of assistance until the patient felt uncomfortable. We then applied the last level of VA and FA at which the patient felt comfortable.
Experimental procedure
The patients were studied in the afternoon in a semirecumbent position. Transcutaneous electrodes were applied to the anterior surface of the forearm and the surface electromyographic electrodes were then put in place. A nasal mask was applied and connected to the pneumotachograph.
The experimental procedure consisted of two periods of NPPV and two periods of spontaneous breathing, each period lasting about 40 minutes. After the first period of spontaneous breathing either PAV or PSV was applied in a random order. The patient then returned to spontaneous breathing before the application of the second ventilatory mode. During spontaneous breathing the patient breathed through the nasal mask and the pneumotachograph having removed the ventilator tubing. The last 10 minutes of each step were recorded and analysed and the mean values were used for the subsequent statistical analysis. To assess possible changes in the end expiratory lung volume the inspiratory capacity at the end of each step was measured immediately after collecting the signals. The intensity of breathlessness was rated using a dyspnoea visual analogue scale (VAS) during spontaneous breathing and at the end of each period of mechanical ventilation.15
Statistical analysis
The results are expressed as mean (SD) values. Differences between treatments and within treatments were evaluated by analysis of variance (ANOVA) for repeated measures (Bonferroni correction). Differences between paired groups of data were evaluated using a post hoc paired t test and applied as requested by ANOVA interaction. A p value of <0.05 was considered significant.
RESULTS
All the patients tolerated both PSV and PAV throughout the procedure. Changes in breathing pattern, transcutaneous blood gas tensions, and differences between PSV and PAV are shown in table 2. No significant difference was observed between the two spontaneous breathing control conditions. PAV and PSV were compared with the immediately preceding period of spontaneous breathing. With both PSV and PAV minute ventilation (+30%) and tidal volume (+30%) were significantly increased while respiratory frequency did not change. Inspiratory capacity remained stable throughout the procedure. Tcco2 decreased with both PSV and PAV while Tco2 did not change. Pulse oximetry slightly increased with PSV. No significant difference was found between PAV and PSV (table 2).
Breathing pattern and transcutaneous blood gas tensions with spontaneous breathing, PSV and PAV
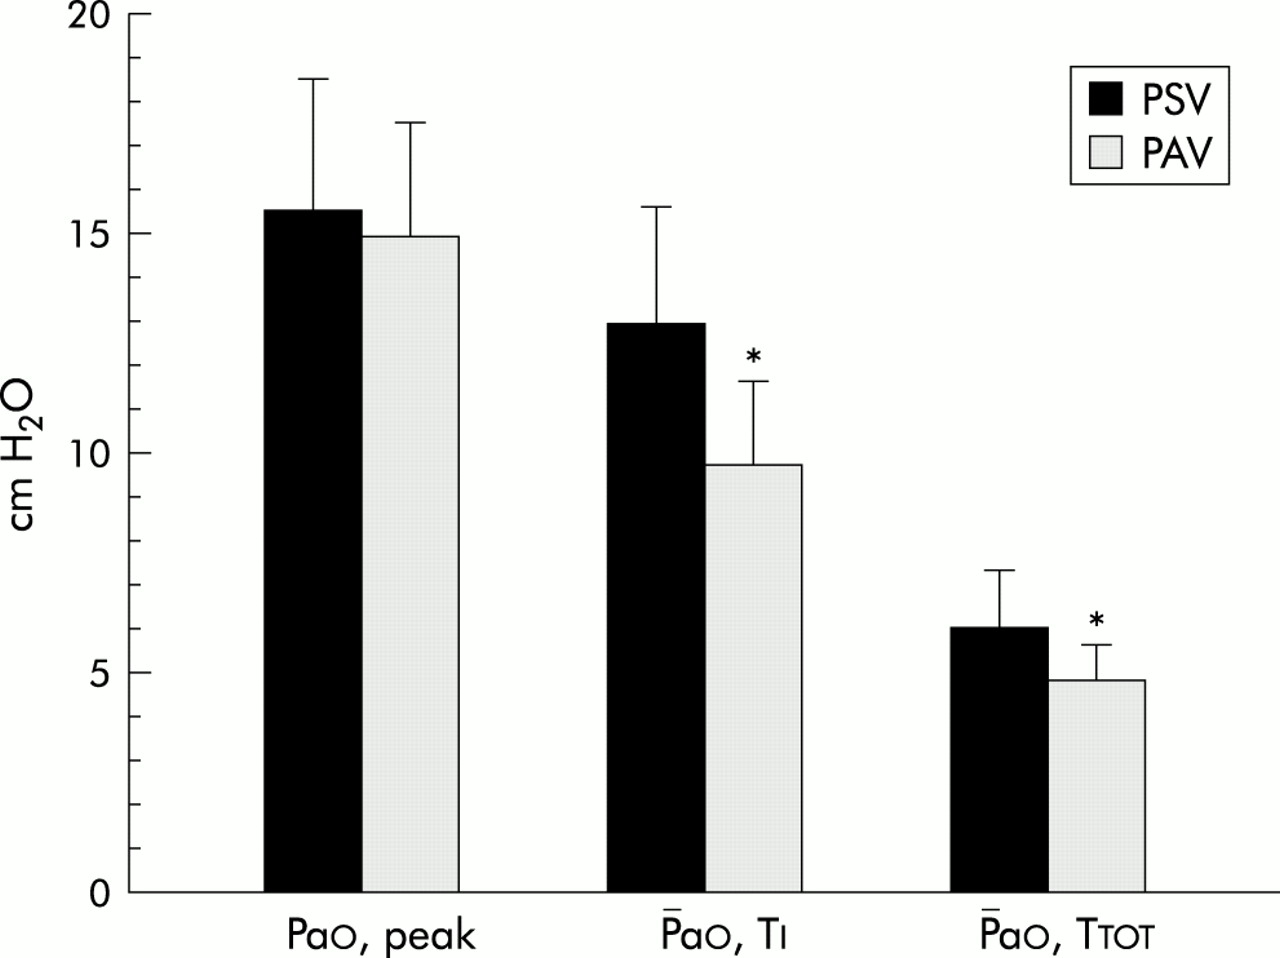
Both Edi,peak and Edi,int were significantly reduced by PSV (−32 (14)% and −44 (21)%) and by PAV (−20 (17)% and −34 (25)%). As shown in fig 1, Pao,peak was similar during PSV and PAV whereas Pao,Ti and Pao,Ttot were significantly lower during PAV.

Mean values and standard deviations of peak airway pressure (Pao,peak), mean airway pressure over inspiratory time (Pao,Ti), and over total cycle duration (Pao,Ttot) during pressure support ventilation (PSV) and proportional assist ventilation (PAV). *p<0.05 versus PSV.
To assess the patient-ventilator interaction we measured the respiratory frequency and the inspiratory time computed on the flow and on the Edi records. The ventilatory and diaphragmatic frequencies were essentially the same in all patients under all conditions. During spontaneous breathing Ti,Edi was consistently longer than Ti,vent, whereas during PAV the two were equal. The same pattern was observed during PSV with the exception of four patients in whom Ti,vent was slightly longer than Ti,Edi. In view of the normal distribution of vt values we used the coefficient of variation to assess vt variability which averaged 20% (range 11–39%) during spontaneous breathing with no significant change during PSV or PAV.
Finally, the effect of PSV and PAV on the individual relationship between the patient's single inspiratory effort (Edi,peak) and vt were examined. As shown in fig 2, this relationship changed in different ways with unsupported and assisted breathing. As shown in fig 2A, both PSV and PAV caused an upward displacement of the Edi,peak/vt relationship suggesting an increase in vt without a substantial reduction in Edi. In contrast, the patient illustrated in fig 2B exhibited a leftward shift of the Edi,peak/vt relationship indicating that a smaller inspiratory effort was associated with a minimal change in vt. In the patient illustrated in fig 2C a smaller Edi was associated with a larger vt. Finally, the patient illustrated in fig 2D exhibited a different behaviour with PSV and PAV; tidal volume was increased by PSV whereas PAV reduced Edi. Three patients exhibited the pattern seen in fig 2A, two had the pattern in fig 2B, four showed the pattern in fig 2C, and three had different behaviour with PSV and PAV (as shown for one patient in fig 2D). We failed to find any correlation between physiological variables and the four patterns shown in fig 2.

Relationship between tidal volumes (Vt) and peak diaphragmatic electromyography (Edi,peak) for four subjects during spontaneous breathing (SB, filled circles) and non-invasive ventilation (NPPV, open circles) during pressure support ventilation (PSV, left panels) and proportional assist ventilation (PAV, right panels). Symbols represent measurements of a single breath from the 10 minutes of registration. The lines are computed from regression analysis.
At the end of each step the dyspnoea VAS score was measured. During spontaneous breathing the mean score was 17 (5) cm which was reduced slightly, but not significantly, to 15 (5) cm at the end of both PSV and PAV. Three patients reported that they felt better with PAV than with PSV, whereas four other patients reported the opposite effect. Five patients had no preference.
DISCUSSION
The results of this study show that short term non-invasive application of PAV and PSV in patients with CVF due to advanced CF can improve the patients' pathophysiological condition compared with spontaneous breathing. Both PAV and PSV resulted in a higher V`e and Vt, lower Tcco2, and a smaller inspiratory effort. The patients accepted both modes of mechanical ventilation and claimed that they felt better with ventilatory assistance than with spontaneous unsupported breathing as shown by a reduction in the dyspnoea score. The lack of statistical significance was perhaps due to the short ventilation time. However, there was no systematic preference for one mode over the other. A significant subjective improvement in patients with CF receiving NPPV has been reported previously.6 This reduction in symptoms, which may help the general well being of the patients, may explain why NPPV is well tolerated even in the long term.
NPPV reduces the progressive deterioration of gas exchange and provides support during exacerbations while the patients are waiting for lung transplantation.1,5,6 PSV improved Vt, Sao2 (pulse oximetry) and reduced Tcco2.4 In patients with severe CF who have significant gas exchange abnormalities during sleep but are normocapnic in the daytime, nocturnal (one night) nasal PSV was able to prevent oxygen induced hypercapnia.3 The short term benefits were confirmed in a longer study2 in which home NPPV improved physiological variables and quality of life up to 18 months after initiation of the treatment. Hodson and colleagues emphasised the role of NPPV in patients with CF, defining it as “a potential bridge to transplantation”.1 NPPV has also been proposed in several centres as a first line intervention in patients with CF who require ventilatory support before transplantation.16
Our study provides the first physiological assessment of PAV in patients with CF, as well as the first physiological comparison between PAV and PSV administered non-invasively in patients with CVF. The two modes of ventilatory assistance had similar results. However, the physiological benefits of PAV occurred at a lower mean airway pressure than PSV (fig 1). This may be of clinical interest in view of the results obtained by Diaz and colleagues17 who showed that PSV (mean 12 cm H2O) caused a significant fall in cardiac output (mean of −1 l/min) which they attributed to the effect of airway pressure on venous return, and by Haworth and colleagues18 who reported three cases of barotrauma in adult patients with CF dependent on NPPV. The authors commented that this risk was not different from the general population of patients with CF. Clearly, it is important to use the lowest possible airway pressure during NPPV to prevent both the risk of barotrauma and the fall in cardiac output. The latter may be relevant in patients whose respiratory muscles are contracting under a significant workload.19 It is interesting to note that the improvement in Vt and the reduction in the diaphragmatic effort observed with PAV in patients with CF is similar to that obtained by PAV in patients with COPD.10
In agreement with other studies, our data show that, on average, NPPV increases ventilation and unloads the respiratory muscles. However, when individual patients were analysed (fig 2) we found that the mean changes may not reflect individual behaviour. Four different patterns were observed when ventilatory assistance was offered. At the two extremes the increase in Vt (fig 2A) and the reduction in the inspiratory effort (fig 2B) were not associated. They both occurred in some patients (fig 2C) and in a few the reaction was different for different ventilatory modes (fig 2D). In some patients Vt was increased, in others the respiratory muscles were unloaded, while in some there was a combination of the two. We did not find any criteria to predict the individual response to the ventilatory assistance and we do not know whether this reflects differences in the central control of breathing, particularly PAV, a ventilatory mode which is driven by the patient. Comparison between modes of ventilatory assistance always presents problems and there is no perfect solution.20 In this study we decided to set both modes at a level of comfort determined by the patients because their cooperation is crucial for the success of NPPV and because it is the usual setting for clinical purposes. As far as we are aware, PAV and PSV have only been compared to date in intubated patients and this is the first comparison of the two modes of ventilation during NPPV.15,21–23
In conclusion, the results of this study show that short term application of NPPV in patients with CF with chronic hypercapnia, both with PSV and PAV set at a level of comfort determined by the patient, has a positive physiological effect on minute ventilation, blood gas tensions, and the amount of diaphragmatic effort. However, PAV gave similar results to PSV at a lower mean inspiratory pressure.
Acknowledgments
Dr A Serra is a fellow of the Italian Ministry of University and Scientific Research. We thank Dr Fiona Scandellari for language and editorial assistance. The work has been supported by grants from Respironics Inc, Murrysville, PA, USA and from Fondazione Ricerca Fibrosi Cistica.