Article Text

Abstract
BACKGROUND Airway inflammation, with recruitment of neutrophils to the airway lumen, results in purulent secretions and a variety of potential adverse consequences for patients with chronic bronchitis and bronchiectasis. We hypothesised that gradations of sputum colour would correlate directly with the myeloperoxidase content of sputum and with various other indicators of the activity and consequences of bronchial diseases.
METHODS To test this hypothesis, we quantified sputum colour by reference to a sensitive nine point colour chart and correlated this assessment with indices of a number of inflammatory mediators in sputum.
RESULTS The results indicate that standardised visual measurements of sputum colour correlated strongly with myeloperoxidase, interleukin 8, leucocyte elastase (both activity and total quantity), sputum volume, protein leak, and secretory leucocyte proteinase inhibitor (p<0.001 for all). In addition, there was a strong direct correlation between leucocyte elastase and both myeloperoxidase (p<0.003) and sputum volume (p<0.001), but a strong negative correlation with secretory leucocyte proteinase inhibitor (p<0.001).
CONCLUSIONS These results indicate that sputum colour graded visually relates to the activity of the underlying markers of bronchial inflammation. The results of this simple visual analysis of sputum provides guidance concerning underlying inflammation and its damaging potential. It also provides a useful scientific tool for improving the monitoring of chronic airways diseases and response to treatment.
- chronic obstructive pulmonary disease
- inflammation
- neutrophils
- proteinases
- sputum
Statistics from Altmetric.com
Brisk and continual recruitment of neutrophils into the airway lumen, with resultant purulent sputum, is a hallmark of active bronchial disease.1 It plays a key role in the initiation, persistence, and progression of airways disease in patients with chronic bronchitis as well as those with bronchiectasis. Monitoring the recruitment of neutrophils into the airways may provide an important indicator of the activity of chronic airways disease, and could also provide information about the effectiveness of intervention therapy and/or the need for new treatment. However, neither patients nor practitioners and scientists have had effective tools for monitoring and communicating the purulence of respiratory secretions.
A number of adverse consequences of neutrophil recruitment and the resulting airway inflammation have been identified. Leucocyte elastase, when released from neutrophils, has been suggested as a major mediator of bronchial disease by causing damage to epithelial tissue,2 goblet cell hyperplasia,3 and mucus hypersecretion.4 Neutrophil derived elastase may also reduce the effectiveness of lung defences, including immunoglobulins,5 opsonophagocytosis,6mucociliary clearance,7 and proteinase inhibitors such as secretory leucocyte proteinase inhibitor.8 Finally, it is possible that activated neutrophils may perpetuate and amplify local inflammatory responses, either directly through their own release of leukotriene B49 and interleukin 8,10 or indirectly through induction of release of these same chemoattractants from bronchial epithelial cells11 and macrophages.12 In support of these in vitro observations, clinical studies have clearly shown that an increase in sputum purulence is associated with severity of disease and acute exacerbations, whereas a decrease in sputum purulence is associated with an improved state of health.1
We considered the possibility that a standardised scale of sputum purulence might correlate with the severity and/or activity of bronchial disease. To test this possibility we used a reference colour chart that takes advantage of the green colour of myeloperoxidase (MPO) contained within the azurophil granules of the airway neutrophils. This concept is consistent with numerous previous studies1 ,13which have correlated changes in sputum colour with changes in the activity of airways disease.
We therefore assessed secretions from patients with chronic bronchitis and bronchiectasis and graded sputum colour. The resulting classification scheme was used to compare with a range of markers of neutrophilic inflammation including the measurements of sputum MPO (the source of the green colour). This study reports the relationship between these biochemical markers and sputum colour.
Methods
PATIENTS
Fourteen patients with varicose or cystic bronchiectasis, confirmed by high resolution computed tomography, and seven patients with smoking related persistent cough and sputum production without bronchiectasis were studied. All were clinically stable at the time of the study, as indicated by lack of self-reported change in symptoms over the preceding 2 months, and none reported a change in airway symptoms during the study.
STUDY PROTOCOL
Venous blood was obtained at monthly intervals for four consecutive months and the serum fraction was separated and frozen at –70°C until analysed. On each study day, sputum was collected over a 4 hour period from rising in the morning. At study visits 2–4, each subject also collected all expectorated sputum over the 24 hours of the day before the visit, and this was weighed for determination of the mass of sputum produced per day.
The colour of all sputum samples was matched to the nearest colour by comparison with a nine point colour chart (BronkoTest, Heredilab Inc, Salt Lake City, UT, USA) and assigned an integral value between 0 (water clear) and 8 (corresponding to the deepest green colour observed in patients with cystic fibrosis). The samples were also graded subjectively as mucoid, mucopurulent, or purulent as described previously.14
In order to assess the interobserver variability, 26 sputum samples were assessed independently by two laboratory technicians. In addition, one observer graded the colour of 25 samples 3 hours apart, labelled differently to ensure no recognition. Finally, to assess patient's ability to grade colour, 10 patients submitted 38 sputum samples and their self-assessment of the colour was compared with that assessed independently by one of us (AH).
Assessment of sputum colour was made by the same person throughout the study and was completed before any sample analyses in order to eliminate any minor interobserver variability.
After grading the samples the sputum sol phase was separated by ultracentrifugation at 50 000g for 90 minutes at 4°C, then stored at –70°C until analysed.
BIOCHEMICAL ASSAYS
Myeloperoxidase (MPO)
MPO activity was measured by a chromogenic substrate assay as described previously,15 which has been shown to reflect the number of neutrophils in samples of lung secretions.16
Leucocyte elastase
Leucocyte elastase was purified from an empyema or from purulent sputum. Its purity and identity were confirmed by SDS polyacrylamide gel electrophoresis and Western blot immunoassay, and the activity was determined by active site titration.17 ,18 Total leucocyte elastase was measured by specific ELISA, as described previously.19 Elastase activity was assessed with the synthetic substrate methoxysuccinyl-Ala-Ala-Pro-Val-paranitroanilide (MSAPN) and with 3H-labelled particulate elastin, as described previously.20 ,21 The lower limit of detection for leucocyte elastase activity with these assays is 0.5 nM. Samples recording a value below this were reported as zero for statistical purposes.
Cathepsin B
Cathepsin B was measured in the sputum sol phase using the method described by Buttle et al.22
Chemoattractants
Interleukin 8 (IL-8) was measured by ELISA using a commercially available kit (R&D Systems Europe Ltd, Abingdon, UK) and leukotriene B4 (LTB4) was also measured by ELISA using a commercially available kit (Amersham International plc, Buckinghamshire, UK). The assay characteristics have been described previously.14
PROTEINASE INHIBITORS
Alpha1-antitrypsin
Sputum α1-antitrypsin was measured by conventional sandwich ELISA using sheep polyclonal antihuman α1-antitrypsin and antihuman α1-antitrypsin peroxidase conjugate (The Binding Site Ltd, Birmingham, UK). The results were compared with a plasma α1-antitrypsin standard by interpolation (intra-assay coefficient of variation <9%). Serum α1-antitrypsin was measured by radial immunodiffusion using a commercially available kit (The Binding Site). The intra-assay coefficient of variation was less than 5% throughout the working range of the assay. Sputum/serum ratios were obtained as an indicator of protein leakage into the airway.
Secretory leucocyte proteinase inhibitor (SLPI)
SLPI was measured by ELISA using a commercially available kit (R&D Systems Ltd) as described previously.14
DATA ANALYSIS
Differences between the patients with chronic bronchitis and bronchiectasis and between cytokines for the various sputum colour values were assessed with the Wilcoxon rank sum test for paired and non-paired data (two tailed), as appropriate. The relationship between inflammatory markers and the sputum classification was determined by Spearman rank correlation using the mean data from all samples collected for each patient. Variance of the results for each colour classification is expressed as standard error (SE).
Results
PATIENTS
Of the 14 patients with bronchiectasis, five were men and the mean age was 56.5 years. Ten had significant airflow obstruction with a mean forced expiratory volume in one second (FEV1)—measured as the best of three blows using a bellows spirometer—of 60.8 (SE 0.17)% of predicted values produced by the European Community for Steel and Coal,23 and a ratio of FEV1 to vital capacity (VC) of 56.4 (4.2)%. For the seven patients with chronic bronchitis and no bronchiectasis the mean age was 69.3 years and six were men. All had significant airflow obstruction (mean FEV1 40.4 (11.7)% predicted) and an FEV1/VC ratio of 33.6 (6.3)%.
SPUTUM COLOUR ASSESSMENT
Sputum colour was easily graded and assessment between individuals was generally consistent with no more than one point difference. Furthermore, an individual was also able to assess colour consistently within one colour point. These data are summarised in fig 1. Patients were able to assess colour in a similar way to the research staff (r=0.76; p<0.0001).

(A) Interobserver and (B) intraobserver assessment of colour. The colour assigned to individual samples is shown for two observers independently and a single observer on two occasions (see text). No sample value varied by more than one colour point.
SPUTUM COLOUR AND RELATIONSHIP TO INFLAMMATORY CELL CONTENT
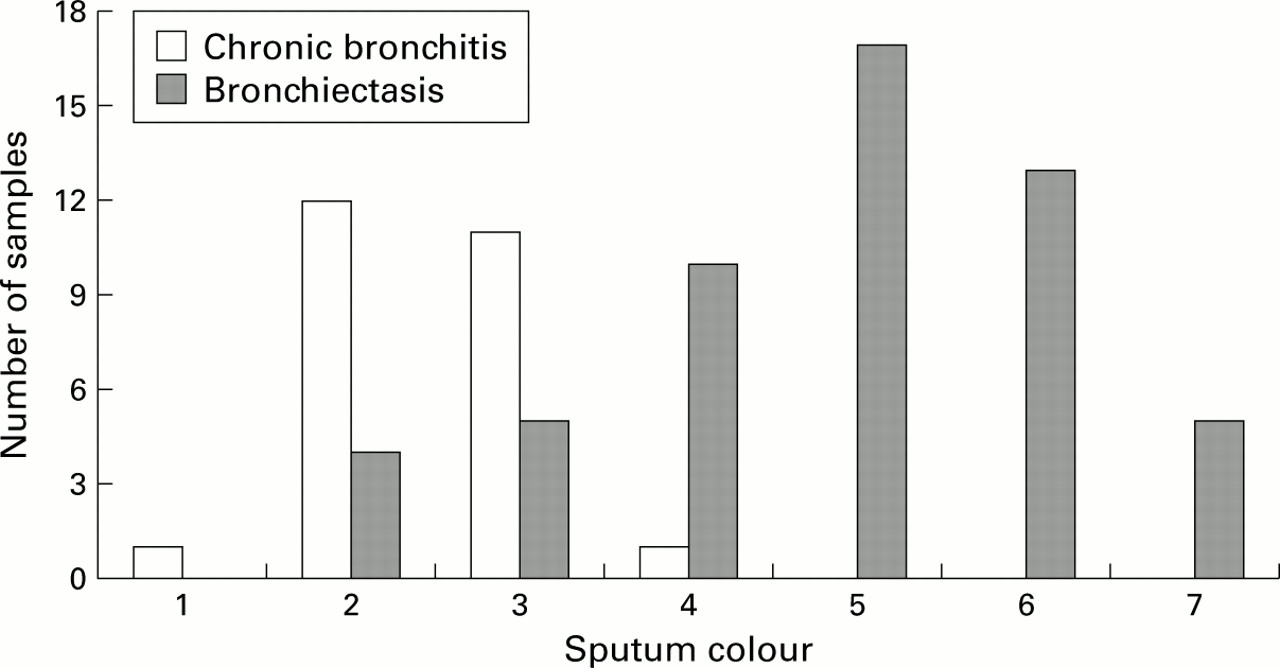
Gradations of sputum colour were easily recognised and all specimens were classified by comparison with the reference colour chart. The spread of individual values assigned is shown in fig 2. None of the samples was classified as either 0 or 8. For 19 of the patients the colour classification remained stable with no more than a one point change in score between the samples. For the remaining two patients, who showed no apparent change in clinical status during the study, the assigned scores were 2, 2 and 4 in one and 5, 7, 5 and 5 in the other.

Objective measurements of sputum colour. The bars represent the colour number of sputum samples from patients with chronic bronchitis or bronchiectasis that were classified to each colour value by visual comparison with a nine point colour chart. Note the wide spread of sputum colour values in these clinically stable patients. Although 13/25 (52%) of the samples from patients with chronic bronchitis alone had no observable yellow-green colour (values <3), the remainder had definite colour (values ⩾3). As a group, the patients with bronchiectasis were much more likely to have purulent sputum (46/50 (92%) with colour values ⩾3).
As a group, sputum samples from patients with bronchiectasis had a higher numerical classification of sputum colour than patients with chronic bronchitis (4.8 (0.2) and 2.3 (0.1), respectively; p<0.0001). When the sputum was assessed subjectively as mucoid, mucopurulent, or purulent,16 mucoid samples consistently had colour values of 1 (n=1) or 2 (n=16), mucopurulent samples had values of 3 (n=16), 4 (n=11), or 5 (n=17), while purulent samples had values of 6 (n=13) or 7 (n=5).
Figure 3 shows MPO, a quantitative measure of the presence of neutrophils and monocytes, as a function of the sputum colour. MPO was virtually absent from samples graded 1 or 2 but increased as the sputum colour value changed from 2 to 6. There was an increase in MPO concentration in samples with each change in sputum colour value in the range between values 3 and 6, although there was no further change between samples graded 6 or 7. Overall, the correlation between the mean colour and MPO concentrations for the 21 patients was highly significant (r=0.882; p<0.0001).

Myeloperoxidase (MPO) content related to sputum colour values. Data are mean results from sputum samples assigned each colour number. Error bars represent SE. MPO was virtually absent from samples graded 1 or 2, but increased with sputum colour from a mean (SE) of 1.0 (0.5) for colour value 3 to 49.1 (13.1) for colour value 6.
RELATIONSHIP BETWEEN SPUTUM COLOUR AND LEUCOCYTE ELASTASE CONTENT AND ACTIVITY
The mean total concentration of leucocyte elastase, determined by ELISA for each of the 21 patients, was clearly related to sputum colour (r=0.871; p<0.000). Leucocyte elastase concentrations were measurable but were extremely low in samples with colour values <3. However, mean immunoreactive leucocyte elastase concentrations increased as the sputum colour increased from 3 to 7. Figure 4 shows that immunoreactive leucocyte elastase concentrations in individual samples were closely correlated with the number of inflammatory cells in the sputum samples, as measured by the MPO concentration (r=0.78; p<0.0001). This relationship was mentioned when the mean results for each of the 21 patients were compared (r=0.94; p<0.0001).

Correlation between immunoreactive leucocyte elastase and myeloperoxidase (MPO). MPO provides a quantitative measure of inflammatory cells in the samples. Each data point represents an individual sputum sample. Note the wide range of both MPO and leucocyte elastase.
Of the 79 samples collected, 57 (72%) had leucocyte elastase activity detectable by MSAPN; the remaining samples were classified as zero. Samples with a colour value of 3 or less had minimal or no elastase activity, whereas samples with a colour value of 4 or above showed increasing activity with increasing colour to 4.14 (1.0) μM for samples graded 7 (fig 5). The overall relationship between the mean elastase activity and sputum colour for the 21 patients was highly significant (r=0.89; p<0.0001).
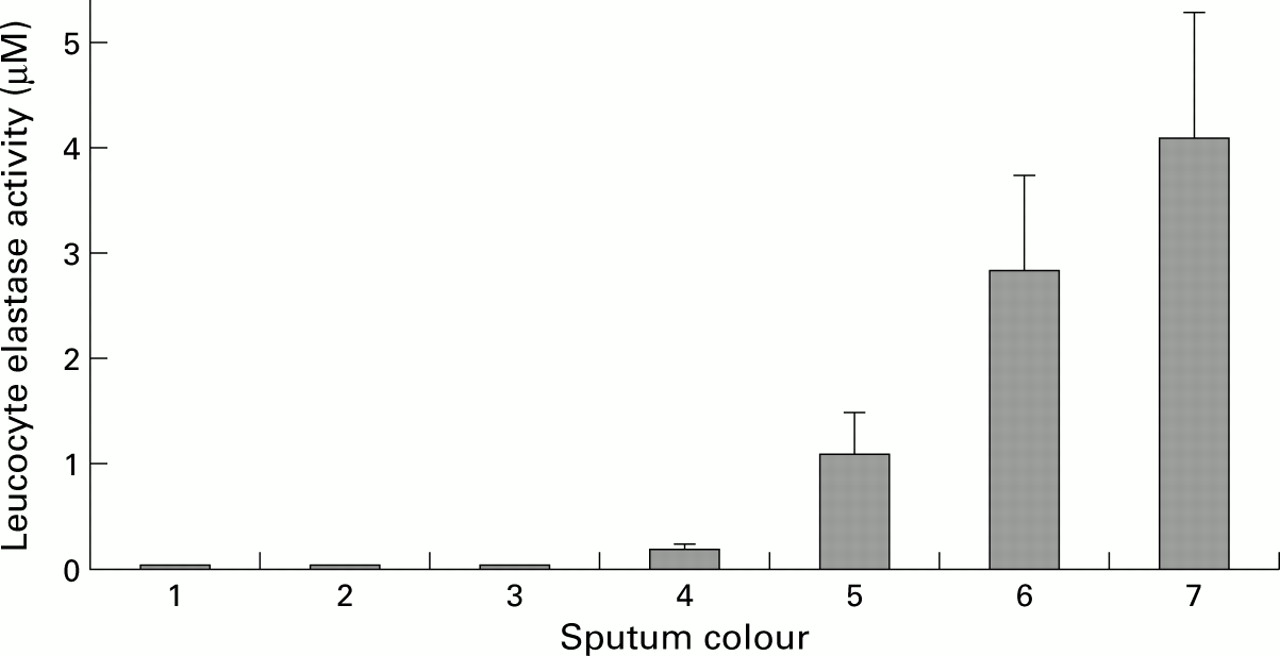
Catalytic activity of leucocyte elastase related to sputum colour. Data are mean results from individual sputum samples. Error bars represent SE. Samples with colour values 1, 2, and 3 were nearly devoid of catalytic activity. Thereafter, catalytic activity increased with each change in sputum colour value (p<0.001 for each comparison). Elastase activity increased from 0.006 to 4.14 (1.0) μM between colour values 3 and 7.
CATHEPSIN B ACTIVITY
Cathepsin B activity was virtually absent in samples graded 3 or less, but this enzymatic activity increased with increasing sputum colour from values of 4 to 7 (not shown). Cathepsin B activity correlated well with the mean sputum colour values for the 21 patients (r=0.89; p<0.0001).
CHEMOATTRACTANTS
Both IL-8 and LTB4 were detectable in all samples studied. The mean IL-8 concentration in samples graded 2 was 5.23 (0.69) nmol, and in samples graded 3 it was slightly, but not significantly, higher (6.37 (1.1) nmol). However, in samples graded 4 there was a significant increase in mean IL-8 concentrations to 16.79 (3.36) nmol (p<0.001). The mean IL-8 concentrations for the 21 patients increased with increasing colour, showing a strong positive correlation (r=0.81; p<0.0001). The concentration of IL-8 was also correlated with MPO (r=0.68; p<0.0001) and immunoreactive leucocyte elastase (r=0.67; p<0.001).
The relationship between LTB4 concentrations and sputum colour was less clear. The mean concentrations in samples graded 2 or 3 were 10.75 (2.67) nmol and 14.69 (4.67) nmol, respectively. In sputum samples graded 4 the concentration increased to 29.66 (4.32) nmol (p<0.001), but there was no further incremental rise with sputum colour values above 4. The overall correlation between mean LTB4 concentration and colour value or MPO for the 21 patients failed to reach statistical significance.
PROTEINASE INHIBITORS
Alpha1-antitrypsin and SLPI were detectable in all samples studied. Concentrations of α1-antitrypsin were relatively low in samples graded 1–4. However, for samples above these values the sputum α1-antitrypsin concentration rose progressively and the mean values for the 21 patients showed an overall positive relationship with colour (r=0.79; p<0.0001).
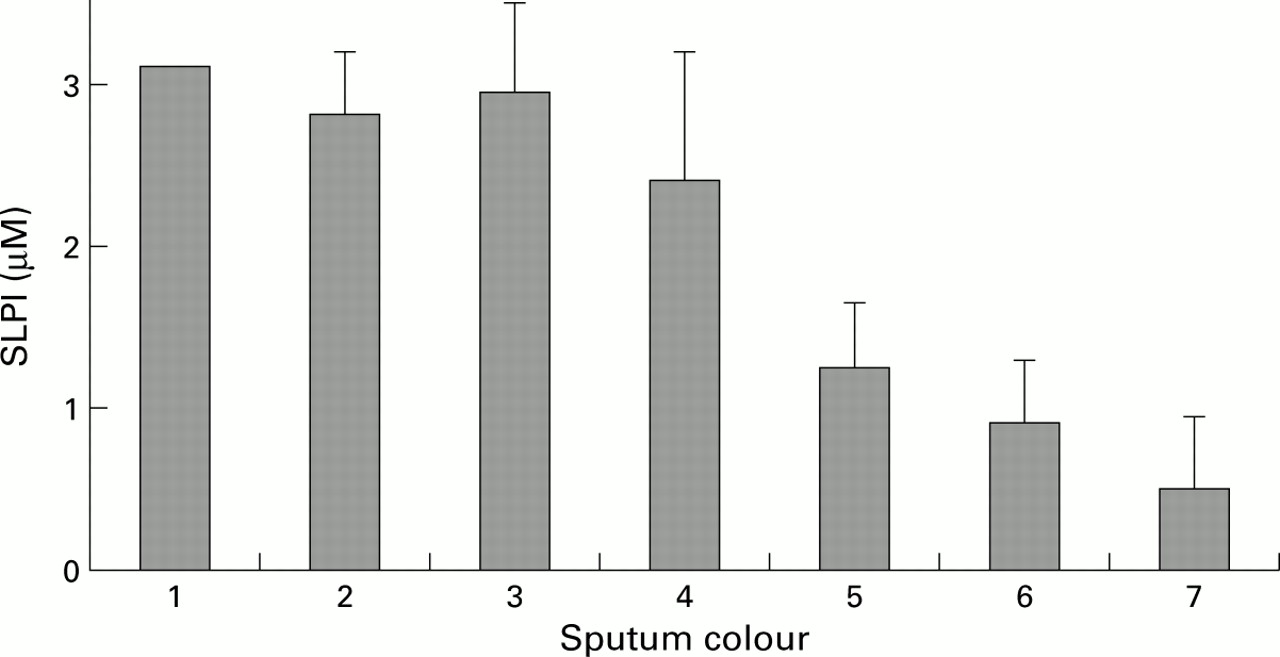
For SLPI, in contrast, the relationship with sputum colour was negative (r=–0.613; p<0.003). Figure 6 shows that, for colour values above 3, the SLPI concentration fell progressively. There was also a strong inverse correlation between the mean SLPI and immunoreactive leucocyte elastase concentrations for the 21 patients (r=–0.63; p<0.002).
Immunoreactive secretory leucocyte proteinase inhibitor (SLPI) concentration related to sputum colour. Data are mean (SE) results from individual sputum samples assigned each of the sputum colour values. A progressive decrease was seen in SLPI with increasing purulence over the range of colour values 3 to 7.
Finally, the sputum/serum ratio of α1-antitrypsin showed a positive correlation with sputum colour value. The mean value obtained for samples graded 2 was 1.30 (0.21) × 10–2. This ratio showed little change up to sputum samples graded as 5, when the ratio was 2.62 (0.31) (p<0.001). The mean sputum/serum α1-antitrypsin ratio for each of the 21 patients correlated both with sputum colour (r=0.72; p<0.0001) and with immunoreactive leucocyte elastase activity (r=0.75, p<0.0001).
EXPECTORATED SPUTUM VOLUME
The mean 24 hour volume of sputum expectorated by the 21 patients (as assessed by sputum weight) was significantly correlated with sputum colour (r=0.38; p<0.05) and leucocyte elastase activity (r=0.41; p<0.04).
The mean results for each of the patient groups for each clinic visit are shown in table 1. The significance of differences between the groups is shown.
Mean (SE) concentration of indivdual cytokines or mediators in the two patient groups at each outpatient visit
Discussion
We have shown that it is possible to develop and apply an easily used objective tool for quantifying airway inflammation scientifically by matching the expectorated sputum with a nine point colour chart. This concept is possible because the green heme-containing protein, MPO, is contained within azurophil granules of neutrophils and proinflammatory monocytes,24 ,25 giving these cells a distinctive deep green colour. Thus, sputum that is devoid of significant numbers of inflammatory cells is clear or white, whereas sputum that contains large numbers of inflammatory cells is green, and sputum containing more modest numbers of inflammatory cells is pale green (usually perceived as “yellow”).
Our study patients were chosen primarily because they had established airways disease and daily sputum production. We studied patients with established bronchiectasis, as well as those with smoking related chronic bronchitis, in order to include a wide spectrum of severity of neutrophilic airway inflammation. As expected, airway inflammation as measured by these neutrophil products and cytokines was more severe in the patients with bronchiectasis (table 1) where the colour was usually 4–7. Indeed, all but one of the sputum samples having a colour value in this range were from patients with documented bronchiectasis. This observation is consistent with the study by Smithet al,26 who found that chronic purulent sputum production was usually a feature of bronchiectasis as shown by high resolution computed tomographic scanning. In their study, 15 of 27 patients with bronchiectasis, but only two of 13 patients without bronchiectasis, continually produced purulent sputum.
The chart proved easy to use by laboratory staff and showed that the sputum colour rarely changed in stable patients with varying degrees of airway inflammation. The colour values discriminated between differences in airway inflammation across the scale. The perceived colour of the sputum samples in these subjects, as graded by the objective chart, correlated strongly with MPO content of the samples and validates the concept that sputum colour is a good measure of its MPO content and hence of MPO bearing inflammatory cells.
In the clinically stable patients studied, sputum colour also correlated well with IL-8 concentrations. These data strongly suggest that the sustained high levels of IL-8 within the airways perpetuate or are associated with several other features related to inflammation. The source(s) of the IL-8 were not established by our study, but both the inflammatory cells themselves10 and airway epithelial cells27 could contribute. In this regard, it is noteworthy that a previous study of cystic fibrosis11 suggested that IL-8 production in the airways was primarily related to the activity of leucocyte elastase, and correlation between these two proteins demonstrated here would support that concept. The poor correlation of airway inflammation with LTB4, however, suggests that this chemoattractant is less clearly related to markers of airway inflammation (at least in patients with chronic bronchitis and bronchiectasis). However, recent data indicate that LTB4 contributes to the chemotactic activity of similar samples to those assessed here,28 and clarification of the relative roles of these two chemoattractants in sustaining chronic airway inflammation awaits specific intervention therapies with agents such as antagonists of IL-8 and LTB4.
With regard to the pathogenesis and progression of airways disease, our data are of interest because the sputum colour correlated well with the concentrations of biologically important effector molecules in the sputum sol phase. These include: (1) a direct correlation with the total quantity and catalytic activity of leucocyte elastase; (2) a direct correlation with cathepsin B; and (3) an inverse correlation with SLPI. Sputum colour also correlated well with expectorated sputum volume.
The elastase data are of particular interest because this enzyme has the potential to injure airway epithelium,2 injure lung connective tissue and alveolar septa resulting in pulmonary emphysema,29-31 promote goblet cell hyperplasia and mucus hypersecretion,3 ,4 and impair lung defences.5-8 The changes in leucocyte elastase activity with increasing sputum colour were dramatic. For example, the mean concentrations of catalytically active leucocyte elastase were 800-fold higher in sputum with a colour value of 7 than in those with a value of 3.
Cathepsin B, when released into the airway as a pro-enzyme, may be activated by leucocyte elastase22 and thereafter play a part in epithelial damage and bronchial disease.32 The relationship with sputum colour suggests that damage caused by this enzyme could be additive to that caused by elastase.
The observed decrease in SLPI concentrations with increasing sputum colour is probably the result of an effect of leucocyte elastase on its release from epithelial cells.8 The effect is to reduce an important inhibitor of leucocyte elastase in the airway lumen32-35 and may hence facilitate the activity of this enzyme.
The observed increase in sputum volume with increasing colour is a prominent airway symptom and may result from the effects of leucocyte elastase on airway cells.3 ,4 Again, the positive correlation between the two measurements observed here would support this concept. Finally, as might be expected from measurements of the above effector molecules, airway injury—as assessed by the sputum/serum ratio of α1-antitrypsin (a measure of protein leak across the endothelial and epithelial barriers)—was also strongly related to objective measures of sputum colour.
Because of its probable pivotal role in the initiation, perpetuation, and progression of airways disease, the catalytic activity of leucocyte elastase in our samples merits further discussion. Elastase activity was usually undetectable in samples with a colour value of 3 (corresponding to minimally observable yellow colour) or less, but thereafter increased markedly with increasing colour. Catalytic activity was detectable in these samples even when the concentration of immunoreactive leucocyte elastase was far exceeded by that of the elastase inhibitors measured (α1-antitrypsin and SLPI). This apparent discrepancy is unlikely to relate to inaccuracies in our assay since they are all validated and reproducible for study of respiratory secretions. The results would thus indicate that the function of these inhibitors is impaired by complexing with other enzymes,36 cleavage to inactive forms,37 or possibly by inactivation by oxidants38 or bacterial products.39
The results of the present study are in agreement with previously published work, although we know of no prior effort to establish and validate standardised visual measures of sputum purulence with inflammatory mediators and markers in the airway. Previous studies of sputum purulence (classified by a three point subjective description of the sputum) have shown that it relates to the quality of life and the presence of persistent airway infection in bronchiectasis.1 ,16 ,40 Moreover, changes in sputum colour have been shown to be an important identifier of acute exacerbations of chronic obstructive pulmonary disease,41and a marker of individuals who may benefit from antibiotic therapy.13
There has been a general understanding among patients and practitioners that the purulence and volume of expectorated sputum are important indicators of changes in airway disease activity and of the need for intervention.13 The present study indicates that these two variables are linked, and that objective quantification of a single variable (colour) over a wide range accurately reflects the intensity of underlying airway inflammation, at least in clinically stable patients, and can be used as a surrogate marker of several inflammatory processes.
Patients with chronic airways disease and clinical scientists are in need of a tool that will provide them with objective information about the activity of airway disease and a method for communicating changes. A colour chart for quantifying sputum purulence may fill this need. In addition, objective assessment of sputum colour has the potential to identify clinically stable patients who are likely to have bronchiectasis. For home monitoring of chronic obstructive airways disease, such a tool could serve a similar purpose to peak flow monitoring in asthma. Further studies exploring the practical usefulness of home use of a sputum colour chart have been undertaken.41 The current study confirms the relationship of colour to airway cytokines and mediators and could also be used to determine the effectiveness and need for specific mediator and antagonist therapy.
Acknowledgments
The authors thank Melody Campbell and Drs Caroline Owen and Carol Llewellyn-Jones for their critical review of the manuscript.
References
Footnotes
Funding: Supported in part by Zeneca Pharmaceuticals, Wilmington, DE, USA.