Article Text

Abstract
BACKGROUND Symptoms of disease reported by patients reflect the effects of the disease process within the individual and the person's physical and mental ability to tolerate or otherwise cope with the limitations on their functioning. This study examines the relationship between asthma symptoms, disease severity, and psychological status in patients being managed in routine primary healthcare settings.
METHODS One hundred and fourteen subjects from four GP practices, two inner city and two suburban, were studied. Symptoms were assessed by means of the Asthma Quality of Life questionnaire (AQLQ) and a locally devised Q score, and psychological status with the Hospital Anxiety and Depression (HAD) scale. Spirometric values and details of current asthma treatment (BTS asthma guidelines treatment step) were recorded as markers of asthma severity.
RESULTS Symptoms as measured by AQLQ correlated with peak expiratory flow (r S = 0.40) and with BTS guidelines treatment step (r S = 0.25). Similarly, the Q score correlated with peak expiratory flow (r S = 0.44) and with BTS guidelines treatment step (r S = 0.42). Similar levels of correlation of forced expiratory volume in one second (FEV1) with symptoms were reported. HAD anxiety and depression scores also correlated to a similar extent with these two symptom scores, but there was hardly any correlation with lung function. Logistic regression analysis showed that HAD scores help to explain symptom scores over and above the effects of lung function and BTS guidelines treatment step. Symptoms, depression, and anxiety were higher for inner city patients while little difference was observed in objective measures of asthma.
CONCLUSIONS Asthma guidelines suggest that changing levels of symptoms should be used to monitor the effectiveness of treatment. These data suggest that reported symptoms may be misleading and unreliable because they may reflect non-asthma factors that cannot be expected to respond to changes in asthma treatment.
- asthma
- morbidity
- depression
Statistics from Altmetric.com
Asthma remains one of the most frequently reported chronic respiratory disorders, although if managed effectively most patients can be helped to function normally. The guidelines for the management of asthma1 indicate that the prime aim is to restore optimal lung function and to abolish or minimise symptoms, while using the minimum medication. This implies objective measurement of lung function (usually peak expiratory flow (PEF)) and the need to record symptoms as reported by the patient.
It is well documented that psychological and respiratory symptoms can be interrelated. Healthy subjects are more likely to report respiratory symptoms (cough, phlegm, wheeze and dyspnoea) if they have an abnormal psychological status (anxiety, depression, anger or cognitive disturbances).2 Subjects from the European Commission's respiratory health survey also demonstrated the association between respiratory symptoms and psychological status, although asthma patients were no more anxious or depressed than any other subject with respiratory symptoms.3 The same relationship was observed between psychological status and morbidity in patients with severe asthma (BTS guidelines treatment steps 4 and 5).4 Bosley and colleagues noted the need to account for such associations when constructing plans for the management of patients with asthma.5 We chose to use the BTS guidelines treatment step as an objective marker of asthma severity based on prescribed medication as opposed to the more subjective classification of mild/moderate/severe asthma.
Many studies of asthma are performed in secondary care as part of specific study protocols with tight inclusion and exclusion criteria. Both the attendance at a secondary care institution and the inclusion/exclusion criteria mean that such patients are not typical of the general population. We wished to study a group of asthma patients as close to their homes as possible with as little intrusion as possible and thus to determine how the routine management of these patients in differing primary healthcare settings related to asthma symptom levels (cough, wheeze, night waking, and dyspnoea) and anxiety or depression. The morbidity and mortality of many diseases can be linked to poverty and social deprivation, and poor socioeconomic status may contribute to the aetiology and subsequent management of asthma. We therefore recruited our subjects from two differing primary healthcare settings—inner city and suburban.
Methods
SUBJECT SELECTION AND RECRUITMENT
GP practices were asked to supply a computerised list of all patients on their asthma register (age range 16–60). Every eighth patient on the asthma register who had received asthma treatment in the previous 6 months was selected for telephone contact. Before telephoning we used practice records to exclude those with bronchiectasis or other pulmonary or cardiac disease, substance abusers, and patients with mental illness. If the selected person was ruled out or if, on telephoning, he/she reported a smoking history of more than 20 pack years, refused to take part, or was unavailable, the next on the list was contacted. We hoped to recruit 40 subjects from each of four GP practices.
After obtaining informed consent, 114 patients were recruited to the study which had local ethical committee approval. Almost half of the cohort contacted and invited to participate declined, were ineligible because of their smoking habit, or were unable to attend due to work (shift workers, working away from home, unable to attend GP practice in working hours) or family commitments (children or carers). All patients were studied at a time when they were clinically stable.
ASSESSMENT TOOLS
Patients were assessed at their own GP practice or, if unable to attend at a convenient time, were seen in their own homes. Assessment tools were used in a random order but all at the same sitting. These consisted of the Juniper Asthma Quality of Life questionnaire (AQLQ)6 and the locally devised Q score7 as measures of health status in asthma, and the Hospital Anxiety and Depression (HAD) scale8 to assess psychological status. The HAD scale is a 14 point self-assessment scale used for screening for clinically significant anxiety or depression and is a reflection of the patients' feelings at that particular intervention. It consists of seven questions relating to anxiety and seven to depression. Participating subjects are asked to underline their option response for each question. The scores can be totalled to give a depression score and an anxiety score (range 0–21). A value on the HAD score of 7 or less was taken as normal, 8–10 as indicating possible abnormality, and values of 11 or more as being abnormal.8
The Q score is a short patient focused morbidity index consisting of four questions (table 1). Subjects are asked to reflect upon the questions in relation to the past week and have to circle one of the three options. With the Q score a low total score indicates greater control of asthma symptoms. The reverse occurs in the AQLQ scoring system. A low AQLQ score would indicate more symptoms of asthma and thus poorer control. However, it should be noted that the Q score reflects symptoms in the past week while the AQLQ has a 2 week reflective period.
Q score questions
Forced expiratory volume in one second (FEV1), forced vital capacity (FVC), and peak expiratory flow (PEF) were recorded using a Micro Medical portable spirometer. The best values from three acceptable attempts were recorded and compared with the European standard reference set.9
Demographic details, smoking habits, and recent and continuing prescriptions for asthma medication were recorded from the patient and confirmed by the GP records and computerised prescribing records of the practice. If a discrepancy occurred, data recorded were taken from computerised records. The drugs prescribed currently were used to classify patients into one of the five treatment steps in the asthma guidelines.
DATA ANALYSIS
Data were analysed using SPSS version 10. Spearman rank order correlation coefficients were computed to examine the relationship between anxiety, depression, and symptom score (AQLQ and Q score), spirometric values, and treatment step. Differences between the inner city and suburban subgroups were explored by unpaired Mann-Whitney tests or by Fisher's exact test. Statistical significance was set at the 5% level. Binary logistic regression analyses were performed to determine the influence of HAD scores on symptoms reported after controlling for lung function and BTS treatment levels (1, 2, 3, 4–5, as a marker of perceived severity) as independent predictors. Symptom scores were converted into binary dependent variables. The Q score was split into scores of ⩽4 and >4. The AQLQ symptom score was split according to the overall median score of 4.9.
Results
Baseline data from the 114 patients are summarised in table2 according to whether they lived in socially deprived inner city areas (two practices, n=74) or in more affluent city suburbs (two practices, n=40). Thirty subjects were recruited from 229 patients on the asthma register aged 16–60 in practice 1, 45 were recruited from 285 patients in practice 2, 20 were recruited from 203 in practice 3, and 19 were recruited from 189 in practice 4. Practices 1 and 2 were in inner city areas. Patients from the two areas were of similar age, sex, and had similar lung function, but those living in the inner city were significantly more depressed (median 5.0v 3.0, Mann-Whitney test, p<0.001) and more anxious (9.0 v 6.0, p<0.001). Overall, 34 (30%) patients had anxiety scores of 11 or more, suggestive of a clinical anxiety state; for inner city patients this rate was 40% (29/74) while for suburban patients it was 13% (5/40). Overall, 11 patients (10%) had scores suggesting depression; 15% (11/74) for inner city patients and 0% (0/40) for suburban patients.
Baseline data by area of residence
There was a trend towards more symptoms in the inner city patients (table 2; AQLQ total score p=0.006, AQLQ symptom score p=0.02, Q score p=0.18, Mann-Whitney test). Overall, for both the AQLQ symptom and total scores the median was 4.9 along the scale, indicating a moderate degree of symptoms relating to asthma. Twenty one of 74 inner city patients (28%) had a total AQLQ score of <4 compared with five of 40 suburban patients (13%). Similarly, 26 of 74 inner city patients (35%) and five of 40 suburban patients (13%) had AQLQ symptom scores of <4. Overall, the median value for the Q score was 2.0, with scores of <4 indicating good control of asthma symptoms. Twenty eight of 74 inner city patients (38%) and eight of 40 suburban patients (20%) scored ⩾4. Treatment levels were similar in the two areas (p=0.85, Mann-Whitney). About 30% (34/114) of the cohort were receiving treatment using higher doses of inhaled corticosteroids and/or other treatments (at BTS guidelines treatment steps 3–5). A further 52% (59/114) were on low dose inhaled steroids (BTS guidelines treatment step 2) and 18% (21/114) were receiving inhaled bronchodilators only. More inner city subjects continued to smoke (p=0.002, Fisher's exact test).
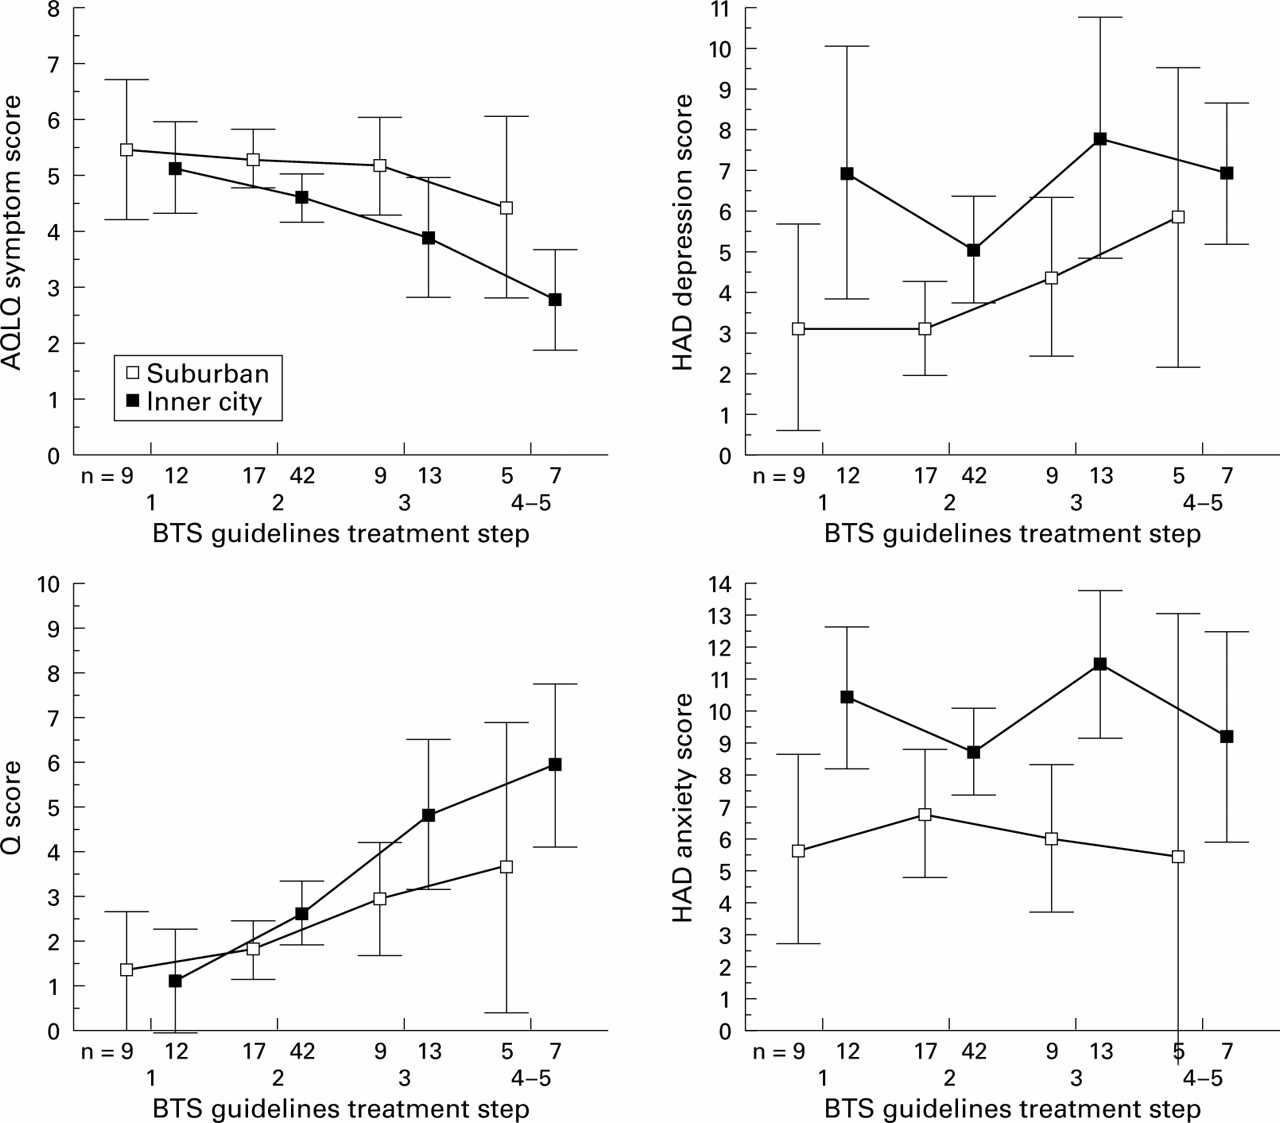
Symptoms, depression, and anxiety were higher for inner city patients after making allowance for the treatment step (fig 1).

Symptoms and depression by treatment step and area of residence. The figures show mean scores and 95% confidence intervals for the means.
Lung function, as measured by PEF, correlated positively with the AQLQ symptom score (r S = 0.40, p<0.001) and negatively with the Q score (r S = –0.44, p<0.001). Similarly, FEV1 correlated positively with the AQLQ symptom score (r S = 0.35, p<0.001) and negatively with the Q score (r S= –0.42, p<0.001). BTS guidelines treatment step also correlated with the AQLQ symptom score (r S = 0.248, p = 0.001) and with the Q score (r S = –0.415, p<0.001). Worse lung function and higher levels of treatment were thus associated with more symptoms.
HAD depression scores correlated with the AQLQ symptom score (r S = –0.43, p<0.001) and Q score (r S = 0.37, p<0.001) but more weakly with levels of PEF (r S = –0.16, p = 0.10) and FEV1 (r S = –0.14, p = 0.14). To a lesser extent, HAD anxiety scores correlated with the AQLQ symptom score (r S = –0.35, p<0.001) and Q score (r S = 0.24, p = 0.01) but not with PEF levels (r S = –0.10, p = 0.33) or FEV1 (r S = –0.01, p = 0.92).
Binary logistic regression analysis was done to determine the influence of HAD scores on symptoms reported, after controlling for lung function and treatment levels (proxy for severity) as independent predictors. Symptoms were measured by the Q score (⩽4 or >4) and by the AQLQ (⩽ median of 4.9, > median). In essence, whichever method of measuring symptoms was used, after controlling for lung function and severity both anxiety and depression added significantly to the predictiveness of the model. Table 3 shows summary statistics to illustrate the association between HAD depression and symptoms after adjustment for PEF and asthma severity. Similar trends were seen for FEV1 in place of PEF and for anxiety in place of depression (data not shown).
Summary statistics for symptoms (Q score and AQLQ) by PEF, BTS guidelines treatment step, and HAD depression
Discussion
Any survey of this type is highly dependent on the population selected for study. We wished to study patients with symptomatic asthma but we also wanted them to be representative of a primary care real life situation. Thus, although we insisted that they had been receiving treatment in the preceding 6 months—that is, they were symptomatic—we did not set any reversibility or other objective criteria. We accepted the GP diagnosis of asthma unless there was clear evidence in the notes that they had other lung or cardiac conditions. We did try to limit the inclusion of chronic obstructive pulmonary disease (COPD) by setting the upper age limit for inclusion into the study at 60 years and by excluding all subjects with a history of more than 20 pack years of smoking. This population should therefore be a relatively pure asthma group and typical of the asthma problem as perceived by primary care. Those who declined to attend included a younger group of whom more were working. They might be expected to have fewer symptoms and less anxiety and depression. Our findings may not extrapolate to them. The interrelationships between symptoms, lung function, and depression within our group are nonetheless important for the assessment of asthma among those who are more likely to be seeking attention from the GP.
The relationship of both worsening symptoms and lowered lung function with increasing treatment step provides some validity to our population and is in keeping with other work.10 ,11 Although we only studied patients when they were clinically stable, the significant morbidity, especially among those on higher levels of treatment, is in line with the data reported by Horn and colleagues in patients attending a hospital clinic.11 Our patients had a mean FEV1 of just under 75% predicted, which suggests either a level of chronic irreversible change or a degree of chronic acceptance of symptoms resulting in the patient “choosing” not to take all treatments regularly. We have no measure as to whether treatments were or were not being taken appropriately but, while poor compliance is well recognised,12 Connolly et al have shown that the best lung function obtainable is lower at each increased treatment step, suggesting that these patients may have some permanent damage.
Lung function, whether measured by FEV1 or PEF, correlated with increasing symptoms of asthma but the relationships were relatively weak which suggests that factors other than lung function may play a part in determining a patient's symptoms. The variability of lung function rather than the absolute level of function is a possible additional factor and we did attempt to record PEF charts on all subjects before collecting baseline data. However, the number of returned charts that contained reliable data were too few to permit reliable conclusions and the data have not been reported. PEF was therefore recorded at baseline along with spirometric parameters.
We used two methods of recording symptoms. The AQLQ outcome measure is known to reflect morbidity of asthma in a reliable fashion and to be susceptible to change,13 but with 32 questions it is too time consuming for routine consultations in a busy general practice. The Q score was developed by local GPs, nurses, and physicians as a four question tool that used questions about symptoms in the past week which would normally be asked in every consultation and which therefore required no extra time from clinician or patient. The reliability of the Q score was assessed by test-retest reliability. Following the collection of baseline data a random subset of patients was selected (every alternate patient) and sent a second copy of the Q score some 2 weeks following the initial contact. Thirty nine of 74 subjects returned their questionnaires. The Q score correlated with itself at 2 weeks at 0.611. In 10 of the 39 repeat cases (25%) the Q score was exactly the same as that first reported. In 21 cases (54%) it agreed with to within one unit and in 32 (82%) it agreed to within two units. The AQLQ score runs from 1 to 7 and correlation was 0.67 with 67% (26/39) agreement to within one unit and 92% to within two units. Allowing for the variable nature of asthma, the Q score would appear to be almost as reliable as the AQLQ score. Its simplicity means that it would not be expected to be as sensitive a tool as the AQLQ, but it is reassuring to note that it does correlate with the AQLQ and shows the same relationship to lung function. Our Q score is very similar to the three question score that emerged from a Royal College of Physicians project,7 with the addition of a question about recent inhaler usage. Although there is no doubt that the more detailed AQLQ will be more reliable in individual patients, it is reassuring that in a cohort such as this the simpler measure yields a similar result and thus may be of value in assessing the outcome of a practice's care.
The BTS asthma guidelines suggest that at steps 1–3 the aim should be minimal or no symptoms and minimal or no need for rescue bronchodilators with normal activity levels. At steps 4 and 5 the aim is to achieve least possible symptoms while balancing for least possible adverse effects. Many studies have emphasised the undertreatment of asthma as a contributing factor in asthma deaths14 ,15 and, following such studies, it has been argued that some asthma patients are poor perceivers of symptoms and thus at greater risk. The argument is that poor perception of symptoms leads to a failure to recognise the need for treatment and thus undertreatment and an increased risk of death.16 The East Anglian confidential deaths study showed that many asthma deaths are associated with psychosocial problems (including depression) in the patient or relatives. Whether poor perception and low symptom reporting or depression and high symptom reporting (as in our data) are more important cannot be answered from our study. However, it is clear that the link between asthma severity, function of the airways, and a patient's psyche is probably more complex than traditional teaching would have us believe.
In our cohort of asthma patients depression, as measured by the HAD scale, was the best predictor of symptom levels. There is a weaker association between high anxiety and more symptoms. This has important implications if reported symptoms are to be used as indicators of disease control.
Our study was observational and cross-sectional and thus cannot sort out whether the observed association is causal or not. In a Canadian study2 which observed a similar association it was postulated that depression or anxiety might cause asthma. This seems an improbable mechanism for what is usually thought to be an immunological disease. However, asthmatic patients have been shown to have increased levels of psychological symptoms17 and there are links between an anxiety state and an increased resting respiration rate in relation to hyperventilation states.18
Janson et al 3 performed a similar study but did not find an association between anxiety and depression and respiratory health. The study also used the HAD scale but included far fewer patients with clinical levels of anxiety or depression (6% and 1%, respectively, compared with 30% and 9% in our study). The higher levels of both psychological problems in the present study may be reflected by inner city problems of deprivation19 and, indeed, depression levels were highest in the more socially deprived practices in the inner city. The relationship between depression and treatment step and overall symptom levels was present in both subgroups.
Our random selection of subjects from primary care included mostly mild to moderate asthmatics and should be typical of the population being seen regularly in most GP practices in the UK. If our findings are correct, the implication is that a proportion of patients with mild depression in primary care may be being overtreated because drugs are being increased in response to reported symptoms that are not caused by asthma alone. Such patients would presumably therefore not gain benefit from the increased prescription and this may be another factor leading to poor compliance. In a study that looked at patients recruited to a clinical trial who were asked to reduce their prophylactic medication progressively until symptom breakthrough occurred, nearly three quarters were able to reduce their doses effectively which suggests that many patients were being overtreated.20
Our findings suggest that the relationship between respiratory symptoms and the state of an individual's asthma is complex and involves many non-asthma related factors. There has been a move towards more objective monitoring of asthma using serial PEF but, in many patients, such data are not available at the consultation and the doctor makes a treatment recommendation based on symptoms alone. Our data show that the increased reporting of asthma symptoms in our inner city patients might be due to the stresses and strains of the life style rather than a true increase in asthma morbidity. This makes it even harder for the physician to assess asthma based on symptoms alone.
This relationship between psychological manifestation and respiratory symptoms is certainly an interesting point to consider in the current debate on the management of asthma. Much information available to patients with asthma—for example, National Asthma Campaign information is freely available. While asthma remains high in the interest of the media, is this reflected in an increased awareness by patients of their symptoms and thus in an increase in their associated psychological status, or in our current study are we simply seeing patients on a higher treatment step of the BTS guidelines (steps 3–5) who are depressed because of long term illness?4
Quality of life measurements are increasingly being accepted as a useful tool for monitoring asthma symptoms and any change in specific symptoms over time.21 ,22 Indeed, patients with chronic asthma spend their life time coping with the symptoms of their disease and a reduction in these symptoms may lead to a perceived improvement in physical, emotional, and social areas of daily life.23Symptom reduction may therefore be more important than monitoring spirometric parameters, and many patients freely admit that they do not regularly monitor their PEF. We would not wish to deflect physicians from trying to reduce symptoms but would suggest that, if the symptoms of some patients are not the result of asthma, the answer may not lie in stepping up asthma medication but in considering other possible causes.