Article Text

Abstract
BACKGROUND The aim of this study was to determine the relationship of the power and recovery stroke of respiratory cilia using digital high speed video imaging. Beat frequency measurements made using digital high speed video were also compared with those obtained using the photomultiplier and modified photodiode techniques.
METHOD Ciliated epithelium was obtained by brushing the inferior nasal turbinate of 20 healthy subjects. Ciliated edges were observed by microscopy and the deviation of cilia during their recovery stroke relative to the path travelled during their power stroke was measured. Beat frequency measurements made by digital high speed video analysis were compared with those obtained using the photomultiplier and modified photodiode.
RESULTS Cilia were found to beat with a forward power stroke and a backward recovery stroke within the same plane. The mean angular deviation of the cilia during the recovery stroke from the plane of the forward power stroke was only 3.6°(95% CI 3.1 to 4.1). There was a significant difference in beat frequency measurement between the digital high speed video (13.2 Hz (95% CI 11.8 to 14.6)) and both photomultiplier (12.0 Hz (95% CI 10.8 to 13.1), p = 0.01) and photodiode (11.2 Hz (95% CI 9.9 to 12.5), p<0.001) techniques. The Bland-Altman limits of agreement for the digital high speed video were –2.75 to 5.15 Hz with the photomultiplier and –2.30 to 6.06 Hz with the photodiode.
CONCLUSION Respiratory cilia beat forwards and backwards within the same plane without a classical sideways recovery sweep. Digital high speed video imaging allows both ciliary beat frequency and beat pattern to be evaluated.
- cilia
- ciliary beat frequency
- methods
Statistics from Altmetric.com
Respiratory cilia beat in a coordinated manner with a specific frequency and pattern, clearing mucus and debris from the airways. Surprisingly, since the initial cinematographic studies of ciliary movement by Gray1 there is still no consensus of opinion as to the precise pattern of ciliary beating.1-4 It is generally thought that respiratory cilia have a forward power stroke and a recovery stroke during which the cilium sweeps backwards and to the side.4 As the cilium sweeps sideways and backwards in a clockwise direction it is thought to stimulate adjacent cilia to beat, propagating the ciliary metachronal wave.4 As a result of metachronal coordination cilia join their propulsive efforts to create a continuous movement of mucus.
In primary ciliary dyskinesia cilia are either stationary or beat in a slow or dyskinetic fashion. Impaired mucociliary clearance in these patients is associated with recurrent chest infections, which may lead to bronchiectasis and sinusitis. The diagnosis of primary ciliary dyskinesia is made on the basis of a supportive clinical history and an abnormal ciliary beat frequency accompanied in most cases by specific abnormalities of the ciliary axoneme on electron microscopy.5 ,6 Buchdahl and colleagues have suggested, however, that a significant number of children with primary ciliary dyskinesia have slowly moving cilia but no obvious abnormality on ultrastructural analysis.7
Although many methods have been devised to estimate ciliary beat frequency,8 high speed imaging by cinematography is regarded by many as the optimal method to analyse ciliary function.9-11 Images recorded at 500 per second and played back at a slower speed allow the frequency and the precise beat pattern of individual cilia to be determined. Because of the difficulties in image processing, expense, and lack of real time analysis, various other methods have been developed. Two popular methods—the photomultiplier12-15 and photodiode techniques16 ,17—estimate beat frequency indirectly by detecting changes in light intensity passing through beating cilia.
The quality of digital high speed video imaging has recently improved to such an extent that it has replaced cinematography.18-20 With the advent of digital high speed imaging, the exact movement of a cilium throughout the beat cycle can be visualised and beat frequency rapidly measured.
Before analysing the beat pattern of cilia from patients with primary ciliary dyskinesia it is essential to evaluate normal human respiratory ciliary movement. The aim of this study was twofold. Firstly, to determine the relationship of the power and recovery stroke of respiratory cilia using digital high speed video imaging and, secondly, to compare ciliary beat frequency measured using digital high speed video imaging with that obtained using the photomultiplier and modified photodiode techniques.
Methods
Ciliated samples were obtained by brushing the inferior nasal turbinate of 20 healthy subjects (13 males) aged 3–38 years with a 2 mm cytology brush.14 The study received approval from the Leicestershire ethical review committee and verbal consent was obtained prior to brushing.
Nasal brushings were placed in Medium 199 (pH 7.3) which contained antibiotic solution (streptomycin 50 μg/ml, penicillin 50 μg/ml, Gibco, UK). Ciliated strips of epithelium were suspended in a chamber created by the separation of a cover slip and glass slide by two adjacent cover slips. The slide was placed on a heated stage (37°C) of a Leitz Diaplan microscope mounted on an anti-vibration table (Wentworth Laboratories Ltd, UK).
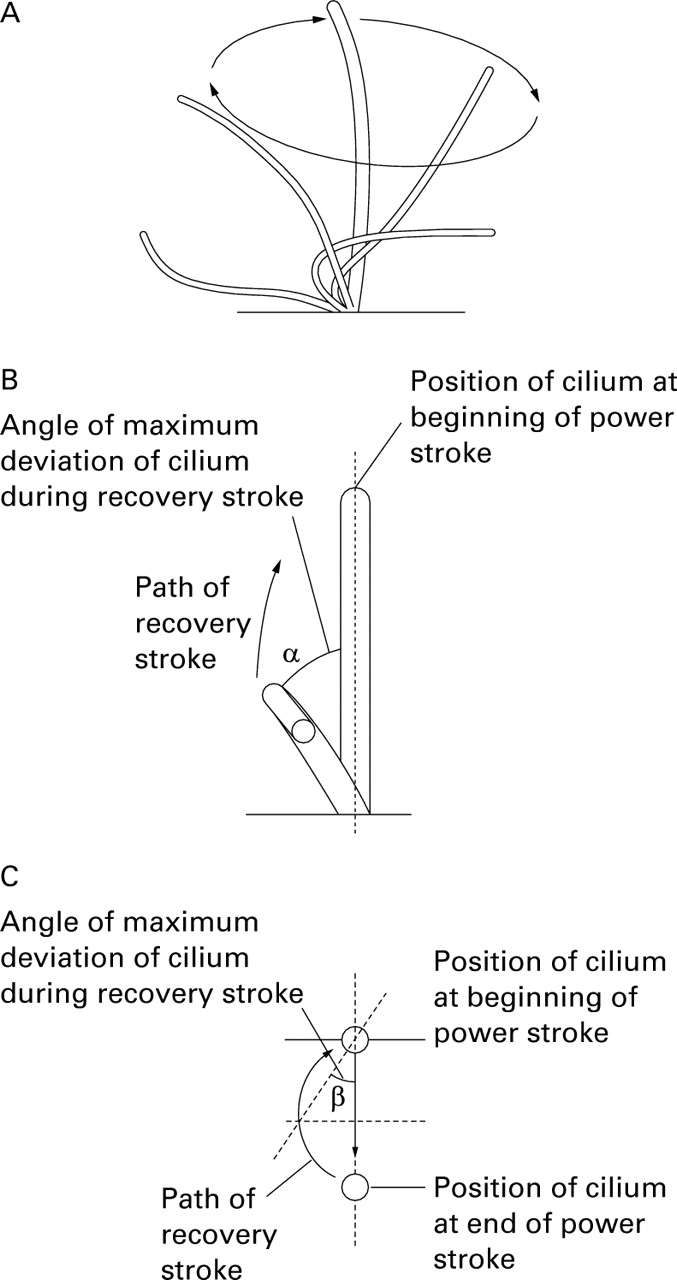
The experimental system allowed the beating cilia to be viewed in three planes: a sideways profile (fig 1A), beating directly towards the observer (fig 1B), and from directly above (fig 1C). Specimens were examined using a ×100 interference contrast lens. Only undisrupted ciliated strips of more than 50 μm in length, devoid of mucus, were studied.

Planes of view used to observe and record the ciliary beat cycle and beat frequency. The beat angle is formed by the point of maximum deviation of the cilium during the recovery stroke from the path the cilium travels during the power stroke. (A) Side profile of ciliary beat pattern. (B) Beat angle α: the cilium is viewed beating towards the observer. (C) Beat angle β: the cilium is viewed from directly above.
Beating ciliated edges were recorded using a digital high speed video camera (Kodak Ektapro Motion Analyser, Model 1012) at a rate of 400 frames per second, using a shutter speed of 1 in 2000. The camera allows video sequences to be recorded and played back at reduced frame rates or frame by frame. The precise movement of individual cilia may be observed during their beat cycle.
The path taken by a cilium during the power and recovery strokes was plotted on acetate paper overlying the high resolution monitor as follows. Viewing the cilia beating towards the observer (fig 1B), the precise position of the cilium during the forward power stroke was plotted frame by frame. As the cilium moved backward during the recovery stroke its position during this movement was again plotted frame by frame. An angle could be derived from a line drawn through the plane of the power stroke and a line joining the point of maximum deviation of the cilium during the recovery stroke (fig 1B). This was defined as the beat angle α. For each cilium studied the mean angle for five complete beat cycles was measured by image analysis (Scion image, Scion Corporation, Frederick, Maryland, USA). This was repeated when viewing the ciliary beat pattern from above (fig 1C) and a beat angle β was calculated by image analysis.
Measurements of ciliary beat frequency were made from ciliated epithelial strips at least 50 μm in length viewed in sideways profile (fig 1A) using the digital high speed video, photomultiplier, and photodiode methods. The order in which measurements were made by the three different techniques varied equally to help to exclude any confounding effect of the order of measurement.
HIGH SPEED VIDEO METHOD
Ciliary beat frequency (CBF) may be determined directly by timing a given number of individual ciliary beat cycles. Groups of beating cilia were identified and the number of frames required to complete 10 cycles recorded. This was converted to ciliary beat frequency by a simple calculation (CBF= 400/(number frames for 10 beats) × 10). Ten measurements of beat frequency were made along each ciliated strip.
PHOTOMULTIPLIER METHOD
Ciliary beat frequency was recorded using a microscope photometer (Leitz SS548-105). As suggested by Dalhamn,12 we adjusted the aperture allowing light to reach the photomultiplier to an area of 2.2 μm2 (see ref 14) and positioned it over an area of beating cilia. Voltage signals, generated as the moving cilia interrupted the passage of light, were displayed on an oscilloscope and relayed to a power spectrum analysis programme (ANADAT, Montreal, Canada) to determine ciliary beat frequency. Ten measurements of beat frequency were made along each ciliated strip.
PHOTODIODE METHOD
Video images of the beating respiratory cilia were relayed from a Super-VHS video camera (Panasonic F15 CCP videocamera) to a high resolution monitor. The photodiode, mounted in a pen like system, was held over the beating cilia displayed on the monitor.17Signals generated as cilia moved past the photodiode sensor were fed via an oscilloscope to a power spectrum analysis program (ANADAT, Montreal, Canada) to determine ciliary beat frequency. Ten measurements of beat frequency were made along each ciliated strip.
STATISTICS
The mean, standard deviation, and 95% confidence intervals were calculated for the α and β angles (fig 1B and C).
A one way analysis of variance was performed with respect to the method used to measure ciliary beat frequency. The mean and 95% confidence interval for each method was calculated. Paired t tests were performed to compare each method with the digital high speed video method. The Bland-Altman limits of agreement were calculated from the mean difference ± twice the standard deviation of the differences with the digital high speed video taken as the optimal method. The limits of agreement were calculated for each method separately.
Results
A classical sideways recovery sweep was not seen when cilia were viewed either beating towards the observer or from above (fig 1B and C). The power and recovery strokes were within the same plane with minimal sideways deviation. A total of 144 cilia had measurements made of beat angle α and 262 cilia for beat angle β. The corresponding mean (SD) angles were α = 5.3 (3.5)° (95% CI 4.6 to 6.0) and β = 3.6 (3.0)° (95% CI 3.1 to 4.1).
A total of 600 measurements were made for ciliary beat frequency, 200 for each method. The analysis of variance with respect to the method used showed a highly significant effect (p<0.001). Both the photomultiplier and the photodiode readings under-recorded ciliary beat frequency compared with the digital high speed video. The mean (SD) beat frequency determined using the digital high speed video was 13.2 (2.9) Hz (95% CI 11.8 to 14.6) compared with 12.0 (2.4) Hz (95% CI 10.8 to 13.1) for the photomultiplier and 11.2 (2.8) Hz (95% CI 9.9 to 12.5) for the photodiode. A paired t test showed a significant difference for the photomultiplier (mean difference 1.2 Hz, 95% CI 0.3 to 2.1; p = 0.01) and photodiode methods (mean difference 1.9 Hz, 95% CI 0.9 to 2.9 Hz; p<0.001) compared with the digital high speed video.
The Bland-Altman limits of agreement with respect to the digital high speed video (fig 2) showed widest variation for the photodiode method (–2.30 to 6.06 Hz) and closest agreement for the photomultiplier method (–2.75 to 5.15 Hz).

Bland-Altman plots of the digital high speed video (HSV) compared with (A) the photomultiplier (PM) method and (B) the photodiode (PD) method at 37°C.
Discussion
Digital high speed video imaging allowed us to obtain images at a rate of 400 per second and to make a permanent recording at a reduced frame rate. Beat pattern can be determined and beat frequency evaluated during the study or at a later stage. As mentioned in the introduction, it is generally thought that cilia deviate in a sideways direction during the recovery sweep. We have shown, however, that human respiratory cilia do not have a classical sideways recovery sweep. The respiratory cilia analysed beat forwards and backwards with a maximal deviation during their recovery sweep of less than 5°. This was confirmed by analysis of ciliary movement observed in two planes.
Primary ciliary dyskinesia may be caused by a number of different ultrastructural defects of the axoneme. Depending on the defect, cilia may be immotile or may move in a dyskinetic fashion. If electron microscopy is performed on ciliated samples where the beat frequency is below 11 Hz, most patients with primary ciliary dyskinesia will be identified.6 Studies by Rossman and colleagues, however, suggest that evaluation of beat pattern, in addition to beat frequency, may be helpful in the diagnosis of patients with primary ciliary dyskinesia.20 ,21 For example, patients with primary ciliary dyskinesia due to microtubular transposition may have beat frequencies that are within the lower normal range but an abnormal ciliary beat pattern is seen on slow motion analysis.20 ,22
This study is the first to compare directly two of the most commonly used methods of estimating ciliary beat frequency of respiratory cilia with high speed imaging. The photomultiplier and photodiode techniques recorded ciliary beat frequencies that were significantly slower than those measured using the digital high speed video method. The limits of agreement for both methods were wide, which confirms that results obtained using the different techniques cannot be used interchangeably. These results emphasise the need for normal reference ranges of ciliary beat frequency to be established for each technique if it is to be used as a diagnostic test for primary ciliary dyskinesia.
In summary, we have shown using digital high speed imaging that respiratory cilia beat with a power and recovery stroke within the same plane. The ability of digital high speed video to measure ciliary beat pattern and beat frequency should make it a powerful tool in the investigation of patients with primary ciliary dyskinesia. The next stage of our investigation will be to compare the beat pattern of our normal cilia with the ciliary beat patterns we have recorded from patients with primary ciliary dyskinesia.
Acknowledgments
The authors would like to thank the Cystic Fibrosis Trust and Masons Medical Foundation for their support. We thank Dr Caroline Dore, Hammersmith Hospital, London for statistical advice.