Article Text

Abstract
BACKGROUND An obstructive defect is usual in bronchiectasis, but the pathophysiological basis of airflow obstruction remains uncertain. High resolution computed tomographic (CT) scanning now allows quantitation of static morphological abnormalities, as well as dynamic changes shown on expiratory CT scans. The aim of this study was to determine which static and dynamic structural abnormalities on the CT scan are associated with airflow obstruction in bronchiectasis.
METHODS The inspiratory and expiratory features on the CT scan of 100 patients with bronchiectasis undergoing concurrent lung function tests were scored semi-quantitatively by three observers.
RESULTS On univariate analysis the extent and severity of bronchiectasis, the severity of bronchial wall thickening, and the extent of decreased attenuation on the expiratory CT scan correlated strongly with the severity of airflow obstruction; the closest relationship was seen between decreased forced expiratory volume in one second (FEV1) and the extent of decreased attenuation on the expiratory CT scan (R s = –0.55, p<0.00005). On multivariate analysis bronchial wall thickness and decreased attenuation were consistently the strongest independent determinants of airflow obstruction. The extent of decreased attenuation was positively associated with the severity of bronchial wall thickness, but was not independently linked to gas transfer levels. Endobronchial secretions seen on CT scanning had no functional significance; the severity of bronchial dilatation was negatively associated with airflow obstruction after adjustment for other morphological features.
CONCLUSIONS These findings indicate that airflow obstruction in bronchiectasis is primarily linked to evidence of intrinsic disease of small and medium airways on CT scanning and not to bronchiectatic abnormalities in large airways, emphysema, or retained endobronchial secretions.
- bronchiectasis
- computed tomography
- lung function
- obliterative bronchiolitis
Statistics from Altmetric.com
Airflow obstruction is the functional hallmark of bronchiectasis.1 ,2 The definition of the exact anatomical site of obstruction would provide pathogenetic insights and might allow greater therapeutic precision, as well as improving the accuracy with which the effects of intervention are monitored. To date, bronchographic and computed tomographic (CT) imaging have evaluated the abnormalities of the large airways on which the diagnosis of bronchiectasis depends.3-6 In histological studies small airways disease is prominent7-9 and limited emphysema has been observed in patients with severe disease,7 ,10 but these abnormalities are not measurable on routine radiographic examination and their clinical importance has not been studied.
The CT features of small airways disease are now well documented11-13; patchy decreased attenuation, usually present in bronchiectasis,9 ,14 denotes constrictive bronchiolitis.9 We reported that the extent of decreased attenuation on expiratory CT scans correlated with the severity of airflow obstruction in a study of 55 patients with bronchiectasis.14 However, no conclusion could be drawn on the relative importance of small airways disease as a cause of airflow obstruction in that study; other morphological abnormalities on CT scanning such as the severity of mucous plugging and changes in tracheal and bronchial calibre15 were not evaluated. The aim of the present study was to determine which inspiratory or expiratory CT features in bronchiectasis—including the extent and severity of bronchiectasis, extent of mucous plugging, severity of bronchial collapse, and extent of decreased attenuation—were most strongly associated with airflow obstruction.
Methods
PATIENTS
The study population consisted of patients with bronchiectasis undergoing CT scanning and formal lung function tests (maximum time interval one month) between November 1992 and July 1993 at the Royal Brompton Hospital, and between November 1992 and June 1994 at Green Lane Hospital. The population included 55 patients studied in a previous evaluation of decreased parenchymal attenuation on expiratory CT scanning.14 Patients with concurrent centrilobular emphysema on the CT scan ascribable to smoking (n = 8), allergic bronchopulmonary aspergillosis (n = 3), and a previous history of lobectomy or pneumonectomy (n = 9) were excluded. No patient had cystic fibrosis. The final study group consisted of 100 patients (64 at the Royal Brompton Hospital and 36 at Green Lane Hospital). There were 40 men and 60 women, and the mean (SD) age was 50.5 (29.0) years. Demographic details and smoking histories were extracted from the medical case records; subjects were classified as “ever smokers” (n = 33, inadequate information, n = 3) if they had smoked at least one cigarette per day for at least one year.
LUNG FUNCTION TESTS
The functional indices measured were forced expiratory volume in one second (FEV1), forced vital capacity (FVC), FEV1/FVC, total lung capacity (TLC), residual volume (RV), RV/TLC, carbon monoxide transfer factor (Tlco), carbon monoxide transfer coefficient (Kco), and 50% and 25% mid expiratory flow (MEF50, MEF25); these were expressed as percentages of values predicted for the patient's age, sex and height.16 Spirometric volumes were measured using a rolling seal spirometer (P K Morgan Ltd, Kent, UK). Lung volumes were measured by constant volume body plethysmography (Masterlab Equipment, E Jaeger UK Ltd, Market Harborough, UK). Indices of gas transfer were measured using a carbon monoxide single breath technique (Tlco) and adjusted for alveolar volume (Kco); gas transfer results were adjusted for haemoglobin (Model B, P K Morgan Ltd, Kent, UK and 6200 Autobox DL, Sensormedics Inc, California, USA).
CT SCANS
CT scans were obtained on an electron beam CT scanner (Imatron Inc, San Francisco, California, USA) or a Somatom DR scanner (Siemens, Iselin, New Jersey, USA). Sections of 1.5 mm or 3 mm thickness were acquired at full inspiration (10 mm intervals) and at full expiration (30 mm intervals). The breath holding technique was rehearsed with each patient before the CT examination. A high spatial resolution algorithm was used and images were photographed at appropriate window settings (level –700 HU; width 950–1500 HU).
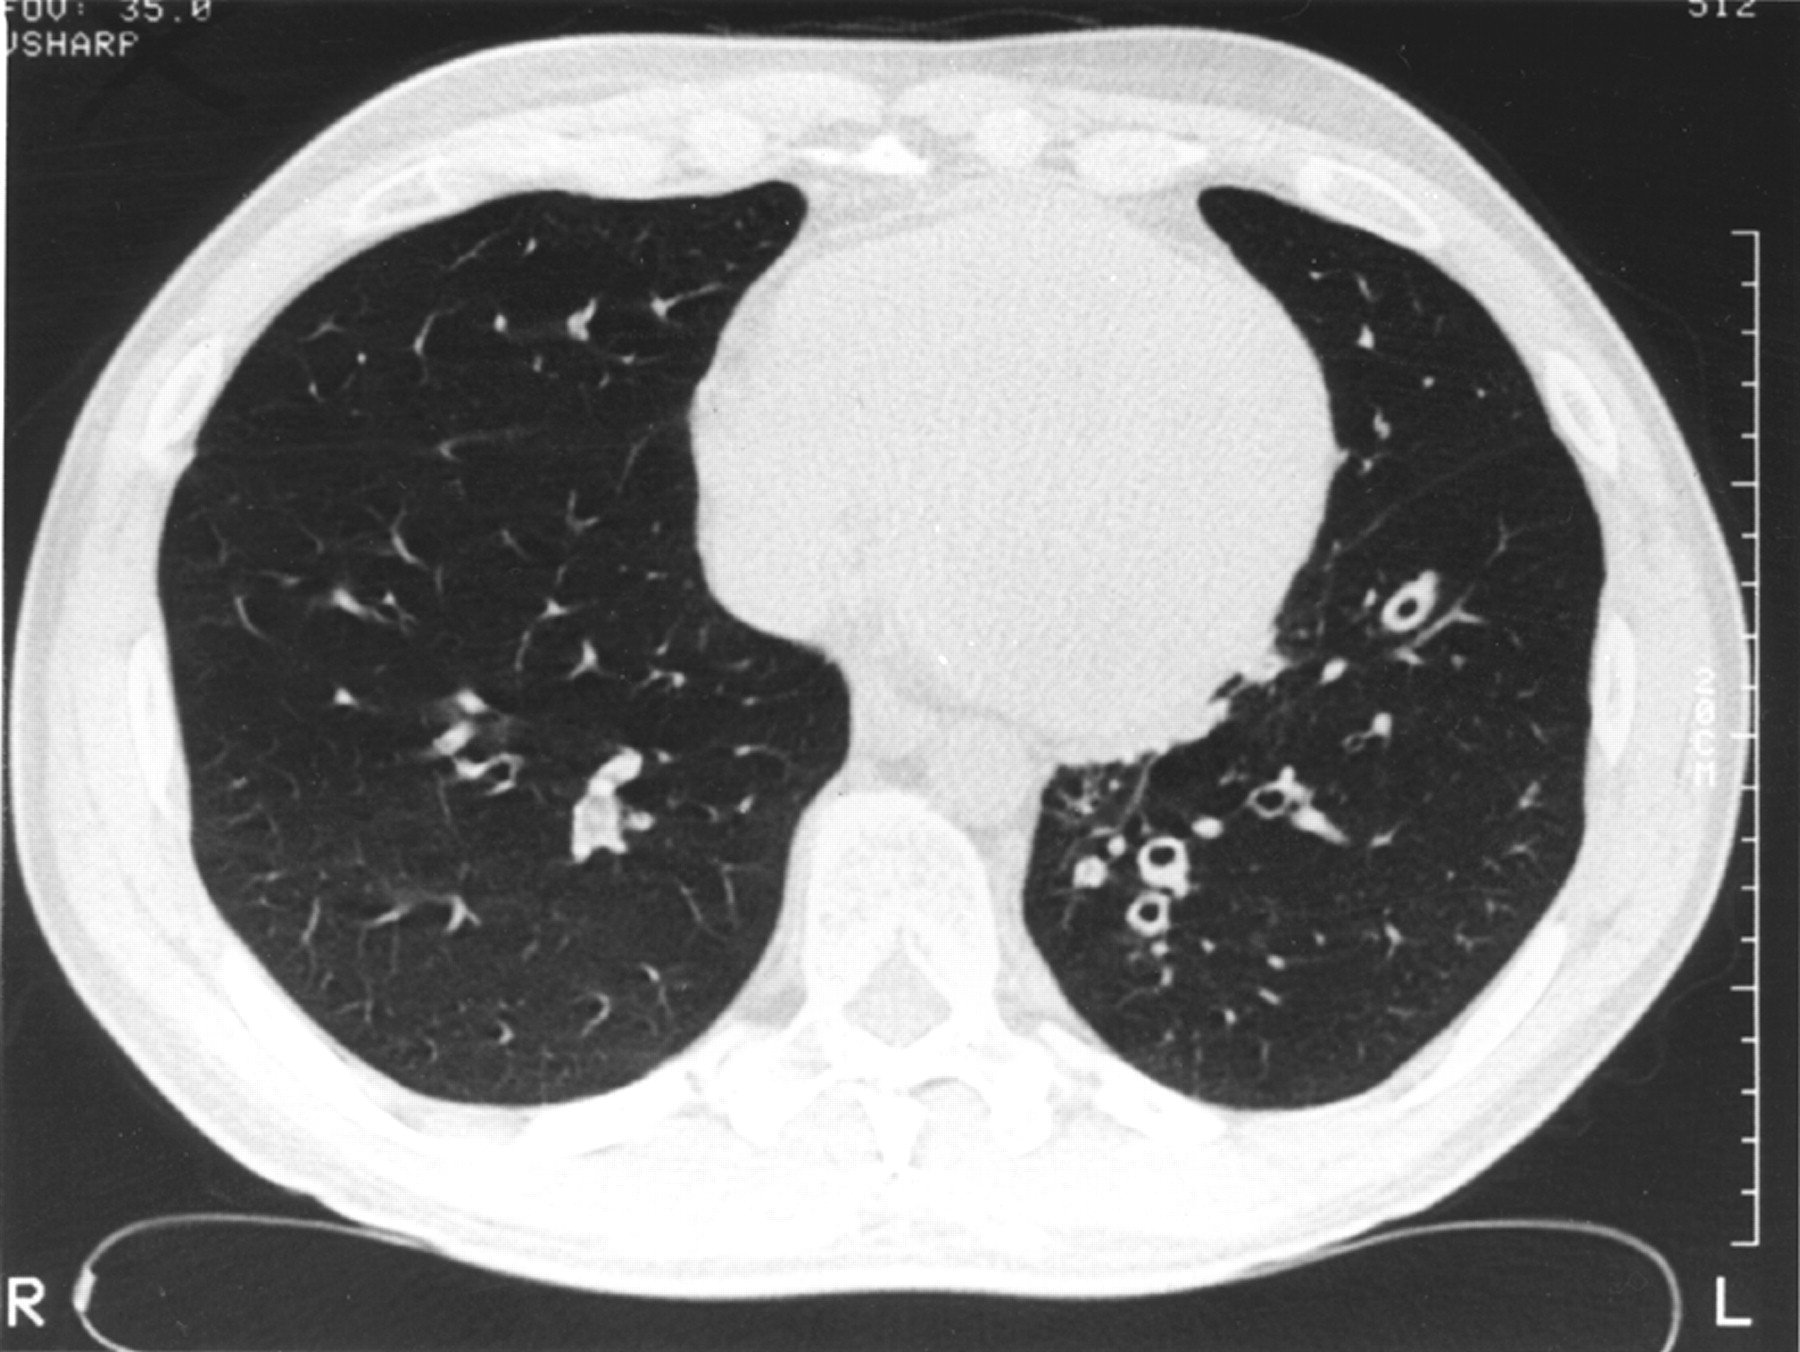
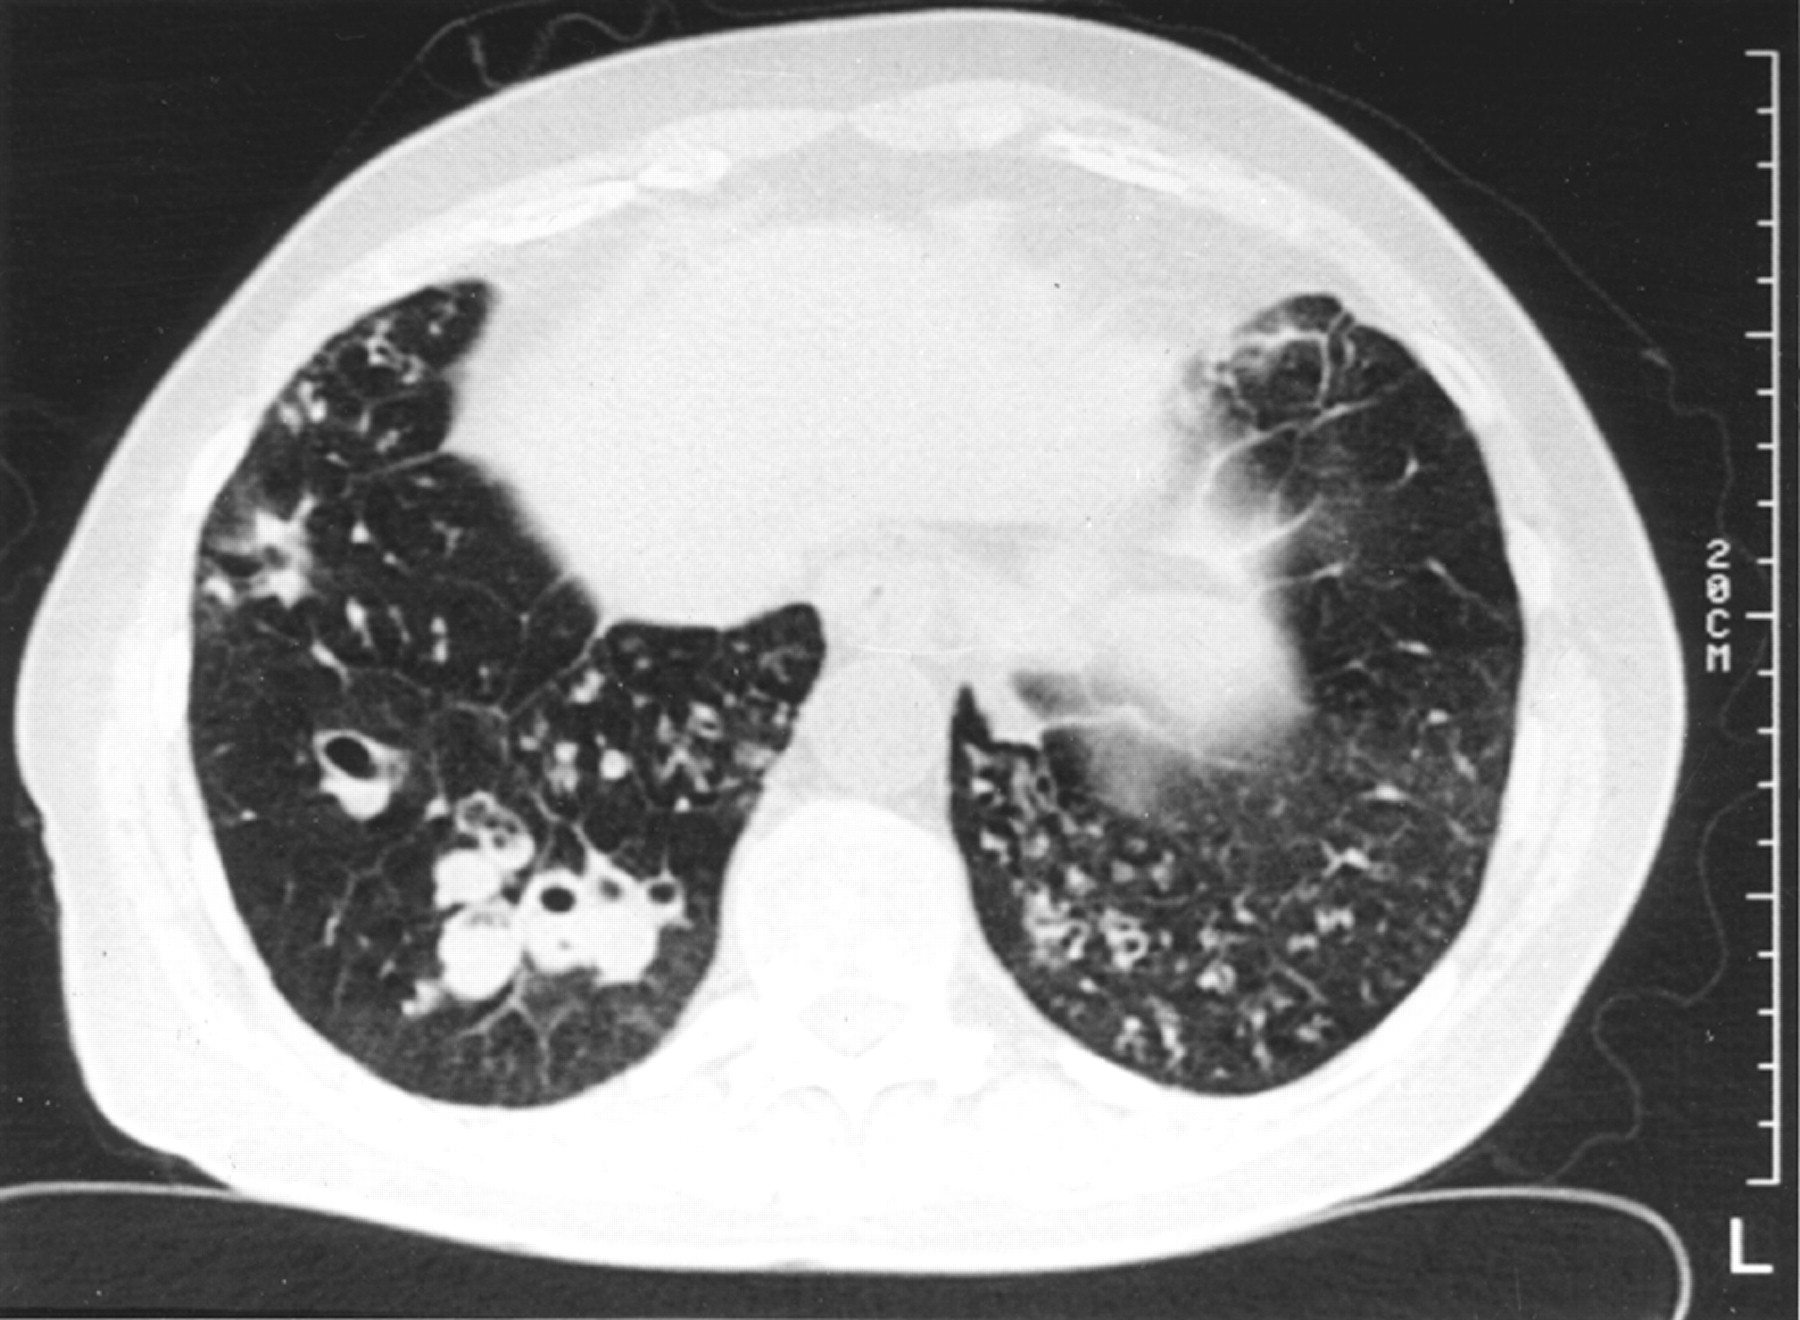
Three observers (DMH, MBR, DGM) independently scored each of six lobes (the lingula was regarded as a separate lobe) at inspiratory CT scanning, as previously described,17 using a modification of the Bhalla system.18 The presence and extent of bronchiectasis, on the basis of established CT criteria,19 ,20 was scored as follows: grade 0 = no disease; grade 1 = localised bronchiectasis affecting one or part of one bronchopulmonary segment (localised); grade 2 = bronchiectasis in more than one bronchopulmonary segment (extensive); grade 3 = generalised cystic bronchiectasis. The average severity of bronchial dilatation was quantified relative to the adjacent pulmonary arteries as follows: grade 0 = no bronchiectasis; grade 1 = 100–200% arterial diameter; grade 2 = 200–300% arterial diameter; grade 3 = >300% arterial diameter. Bronchial wall thickness (fig 1) was quantified relative to the adjacent pulmonary arteries as follows: grade 0 = none; grade 1 = <50% arterial diameter; grade 2 = 50–100% arterial diameter; grade 3 = >100% arterial diameter. The presence or absence of mucus within the large airways and (separately) within the centrilobular bronchioles was recorded (fig2).

Inspiratory CT section showing bronchiectasis in the lower lobes with obvious bronchial wall thickening (grade 2) of the dilated airways in the left lower lobe.

Inspiratory CT section showing cystic bronchiectasis in the right lower lobe with plugging of the dilated airways. In the left lower lobe there is cylindrical bronchiectasis and plugging of the small airways.
The three observers assessed expiratory CT sections for the extent of decreased attenuation of the lung parenchyma (fig 3), bronchial wall collapse, and tracheal collapse. A regional decrease in attenuation was scored as previously14: grade 0 = none; grade 1 = <50% of lobar volume; grade 2 = >50% of lobar volume. Bronchial collapse in each lobe was scored as follows: grade 0 = none; grade 1 = <30% decrease in diameter; grade 2 = 30–80% decrease in diameter; grade 3 = >80% decrease in diameter. Tracheal collapse in each patient was scored as present (a decrease of >30% of tracheal diameter) or absent.

Expiratory CT section showing the normal generalised increase in lung density (compared with inspiratory images) and patchy discrete areas of decreased attenuation.
The total lung score for each CT feature was derived by summing the lobar grades; the final scores used in analysis were obtained by summing the total lung scores of the three observers. This gave a 55 point scale (0–18 for each observer and thus 0–54 for the summed scores) for the extent of bronchiectasis, the severity of bronchial dilatation, the severity of bronchial wall thickness, and the severity of bronchial collapse on expiration, a 37 point scale for regional decrease in attenuation on the expiratory CT scan (0–12 for each observer), a 19 point scale for centrilobular or large airway plugging (0–6 for each observer), and a 4 point scale (0 or 1 for each observer) for tracheal collapse on the expiratory CT scan.
DATA ANALYSIS
Population clinical characteristics, CT scores, and pulmonary function indices are expressed as means with standard deviations or medians with ranges, depending upon distribution. Univariate correlations between functional indices and CT scores were evaluated using Spearman's rank correlation. Interobserver variation for global CT scores was quantified as the kappa coefficient of agreement for tracheal collapse and the weighted kappa coefficient of agreement for other observations (using the mean of kappa values for paired observers).21 In view of the performance of multiple analyses a p value of less than 0.01 was taken to be statistically significant.
Stepwise forward regression was used to identify the independent functional effects of CT features, with individual functional indices evaluated as the dependent variables in separate models; CT features not contributing to equation explanatory power (p>0.20) were excluded. Abnormally distributed variables (all CT scores, FVC, FEV1/FVC, RV, RV/TLC, MEF25, MEF50) were subjected to zero skewness logarithmic transformation. Where skewness could not be corrected (plugs within large airways, tracheal collapse), a categorical transformation was used (large airway plugging: grade 1 = no plugs; grade 2 = score less than median value; grade 3 = score greater than median value; tracheal collapse: grade 1 = no collapse; grade 2 = collapse seen by one or more observers). The validity of the assumptions of linear regression were confirmed using residual versus predictor plots, leverage versus residual plots, and formal testing for heteroscedasticity and omitted variables.22
Results
CT SCORES AND LUNG FUNCTION INDICES
Global CT scores summed for the three observers and expressed as median (range) values were: extent of bronchiectasis 18 (2–49); bronchial wall dilatation 14 (2–44); bronchial wall thickness 9 (0–29); centrilobular mucus plugging 1 (0–18); mucus plugging within large airways 0 (0–8); decreased attenuation on expiratory CT scan 8 (0–33); bronchial collapse on expiration 4 (0–19); tracheal collapse 0 (0–3).
Interobserver agreement for global CT scores was excellent for the severity of bronchiectasis (Kw = 0.87) and the extent of bronchiectasis (Kw = 0.82), good for centrilobular mucous plugging (Kw = 0.67), decreased attenuation on expiratory CT scan (Kw = 0.65), bronchial wall thickness (Kw = 0.61) and mucus plugging in large airways (Kw = 0.61), fair to moderate for bronchial collapse on the expiratory CT scan (Kw = 0.40), and poor for tracheal collapse on the expiratory CT scan (K = 0.23).
Mean (SD) values of normally distributed functional indices were: FEV1 73.0 (25.2)%; TLC 99.7 (15.4)%; Tlco75.4 (18.9)%; Kco 92.6 (18.2)%. Median (range) values of non-normally distributed functional indices were: FVC 87% (22–127); FEV1/FVC 88% (35–132); RV 120% (60–288); RV/TLC 119% (64–288); MEF50 42% (6–184); MEF25 39% (9–170). Airflow obstruction was the predominant finding (median FEV1/FVC 88% predicted), although a restrictive functional defect was occasionally seen.
FUNCTIONAL-MORPHOLOGICAL CORRELATIONS
As shown in table 1, there were highly significant correlations for all observers between FEV1 and the extent of bronchiectasis, the severity of bronchiectasis, the severity of bronchial wall thickening, and the extent of decreased attenuation on expiration (fig 4). Very similar relationships (p<0.005) were observed between all four CT variables and other indices of airflow obstruction (negative correlations with FEV1/FVC, MEF50, MEF25; positive correlations with RV, RV/TLC). Other inspiratory and expiratory CT features (centrilobular plugging, plugging within large airways, bronchial wall collapse, or tracheal collapse) were unrelated to FEV1 although plugging within large airways correlated with RV (R = 0.28, p<0.01), RV/TLC (R = 0.37, p<0.0005), and MEF25 (R = –0.27, p<0.01).
Univariate (Spearman) correlations between structural features on inspiratory and expiratory CT scans and percentage predicted FEV1 shown for summed scores for three observers and for individual observers.
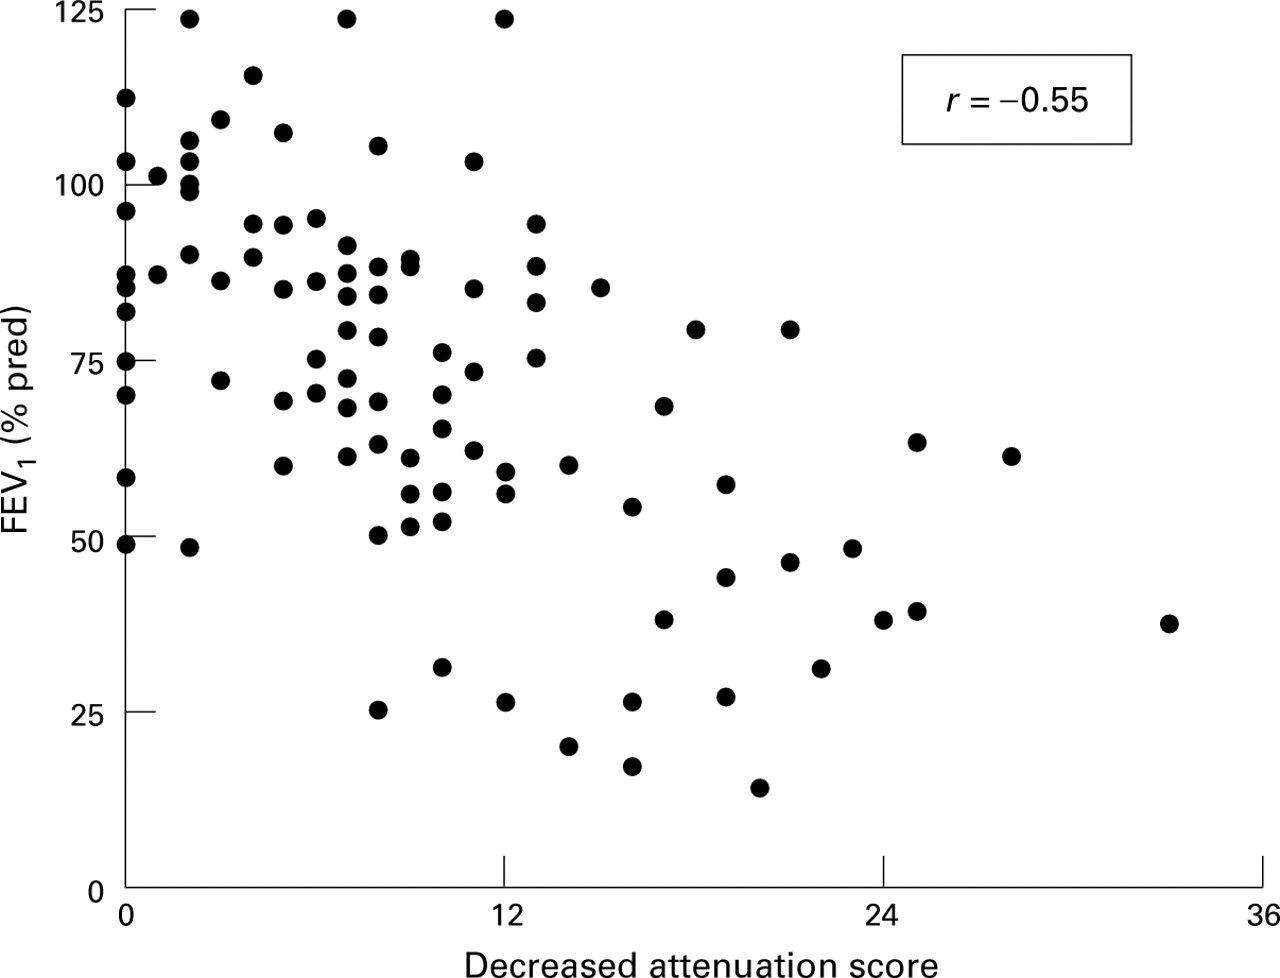
Percentage predicted forced expiratory volume in one second (FEV1) in relation to the extent of decreased attenuation on expiratory CT scan (scores summed for three observers).
The major morphological determinants of functional impairment on univariate analysis were evaluated further using multivariate analysis (table 2). Bronchial wall thickness and decreased attenuation on expiration were independently positively related to the severity of airflow obstruction (data shown for FEV1, FEV1/FVC, RV). Increasingly severe bronchial dilatation was consistently associated with less severe airflow obstruction. There were no strong relationships between these four cardinal CT features and a reduction in gas transfer. Other CT features (plugging in small and large airways, tracheal and bronchial collapse) were not independently related to the severity of airflow obstruction or reduction in gas transfer.
Independent relationships between functional indices and the major determinants of functional impairment on inspiratory and expiratory CT, generated using stepwise regression
The addition of smoking status (“ever” versus “never” smokers) as a covariate did not alter the findings in any multivariate equation. Smoking status was not independently associated with functional impairment.
EXPIRATORY CT FEATURES IN RELATION TO FINDINGS ON INSPIRATORY CT SCAN
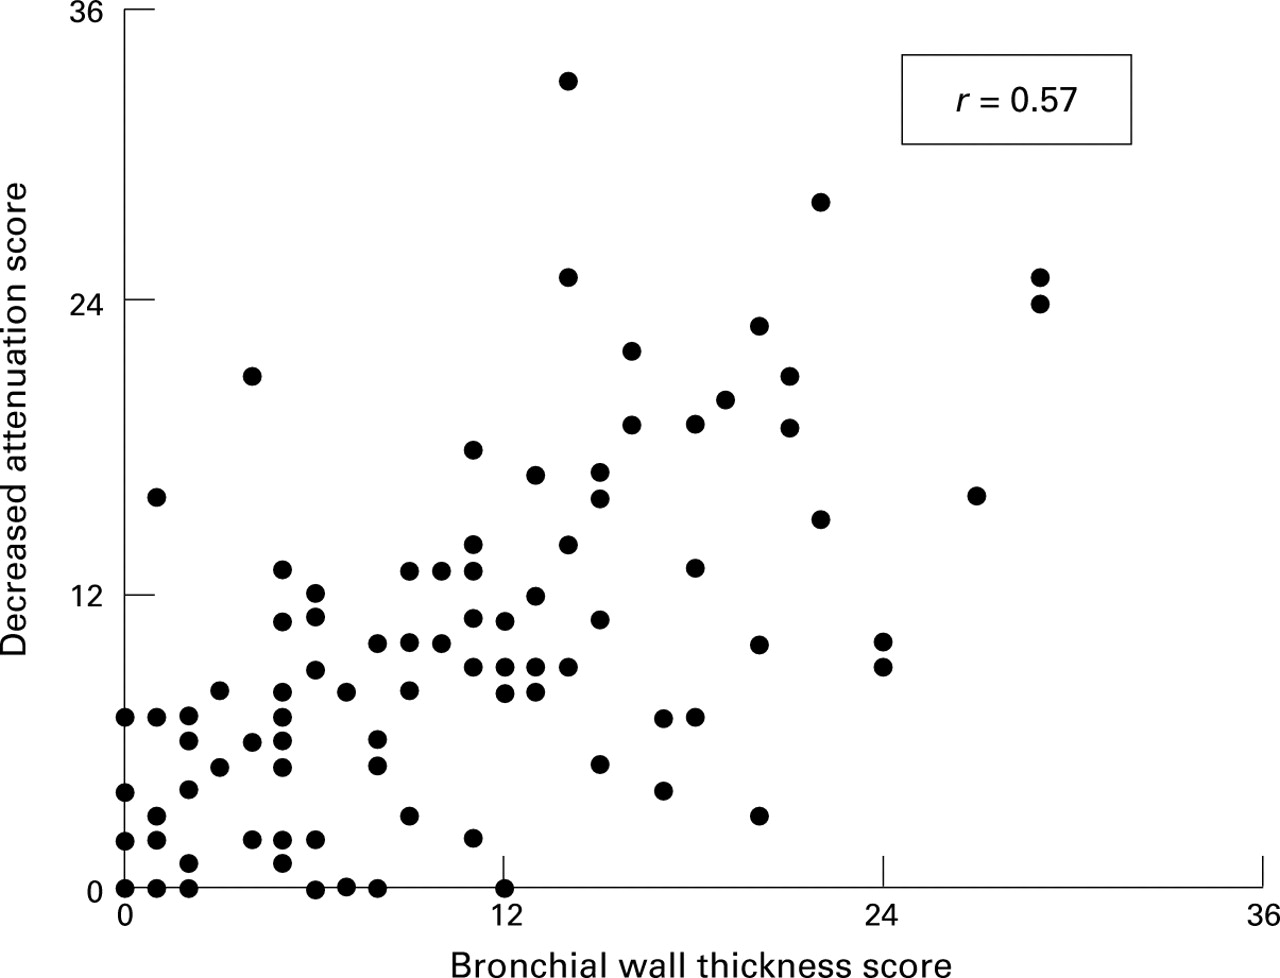
Findings on the expiratory CT scan were examined in relationship to morphological features on the inspiratory CT scan. On univariate analysis decreased attenuation was associated with increasing bronchial wall thickness (R = 0.57, p<0.00005, fig 5) and bronchial wall collapse was associated with increasing bronchial dilatation (R = 0.62, p<0.00005). These were the only relationships to remain significant (p<0.0005 for both) on multivariate analysis (examining individual expiratory CT features against combined findings on the inspiratory CT scan).

Extent of decreased attenuation on expiratory CT scan in relation to the severity of bronchial wall thickness on inspiratory CT scan.
Discussion
Before the advent of computed tomography, studies of lung function in bronchiectasis provided conflicting explanations for the paradoxical combination of bronchial dilatation and an obstructive functional defect, including obliterative bronchiolitis,14 collapse of large airways on expiration,15 the retention of endobronchial secretions,23 emphysema,24 and airway hyperresponsiveness or concurrent asthma.25 ,26 In the present study airflow obstruction was largely related to bronchial wall thickness and the extent of decreased attenuation on the expiratory CT scan. By contrast, the cardinal diagnostic CT feature of bronchiectasis was not strongly associated with airflow obstruction on multivariate analysis; increasingly severe bronchial dilatation was associated with less severe airflow obstruction after controlling for other morphological features.
Neither bronchial collapse nor mucus plugging of airways were major determinants of airflow obstruction. Collapse of large airways due to bronchial wall damage and loss of dynamic integrity has been suggested as an explanation for airflow obstruction in bronchiectasis; on cinefluorography, collapse of bronchiectatic large airways on expiration is prominent.15 However, reduced ventilation in bronchiectasis, evaluated with xenon-133 scintigraphy, is widespread and not confined to bronchiectatic lobes.27 In the present study, despite the presence of bronchial collapse of variable severity in 80 of 100 patients, no relationship with functional impairment was observed. Mucus plugging of small or large airways was similarly common (65 of 100 patients) but was only a minor determinant of airflow obstruction. Functional impairment in patients with chronic sputum production has been ascribed to retained endobronchial secretions23; however, mucus retention may result from, rather than cause, airflow obstruction (as severe small airways disease impairs the efficiency of coughing10). Our findings suggest that mucus impaction within airways is unlikely to be a primary cause of airflow obstruction in most patients with bronchiectasis.
Emphysema is found histologically in severe bronchiectasis7 ,10; emphysematous distension of alveoli is seen in obliterative bronchiolitis caused by viral infection of the lower respiratory tract in infancy.28 In a recent study Loubeyre et al interpreted the CT finding of widespread areas of decreased attenuation in bronchiectasis as indicative of emphysema.24 However, the “emphysema” seen in that study was associated with preservation of gas transfer, indicative of gas trapping due to intrinsic small airways disease rather than emphysema.29 In the present study decreased attenuation on the expiratory CT scan was not related to depression of Tlco and Kco on multivariate analysis and was ascribable to physiological evidence of small airways disease rather than emphysema. Overt bullous emphysema was an exclusion criterion and is seldom reported in bronchiectasis, except in patients with α1-antitrypsin deficiency.30 The use of the term “emphysema” for areas of decreased attenuation on CT scanning without overt bullous disease is not supported by pathological or functional evidence and is likely to lead to confusion. Areas of decreased attenuation on the CT scan in patients with asthma are not in themselves indicative of true emphysema, despite conclusions drawn in a recent study31; in asthma, areas of decreased attenuation are a consequence of regional hypoxic vasoconstriction rather than alveolar over-distension.32 A similar mechanism is likely to exist in bronchiectasis.
Decreased attenuation of the lung parenchyma on the expiratory CT scan was a major determinant of airflow obstruction in the present study. In bronchiectasis this CT phenomenon represents inflammatory or obliterative bronchiolitis (rather than emphysema).9 Our findings support the contention that obliteration of small airways, with or without associated bronchospasm, is likely to be the primary cause of the typical obstructive defect seen in bronchiectasis. Obliterative bronchiolitis is an integral histological feature in bronchiectasis7-9; bronchographic studies have demonstrated obliteration of distal small airways, especially in severe disease.3 Small airways dysfunction on lung function testing is a common finding in apparently mild bronchiectasis.33 It is believed by some investigators that obliterative bronchiolitis is a key early event in the pathogenesis of bronchiectasis in cystic fibrosis34 and after adenovirus infection35; others have argued that obliteration of peripheral bronchi and bronchioles results from the spread of chronic infection from bronchiectatic airways.3The strong association between increasing bronchial wall thickness on the inspiratory CT scan and decreased attenuation is further supportive evidence of underlying bronchiolitis. Bronchial abnormalities on the CT scan are prominent in patients with obliterative bronchiolitis,12 presumably because the lower respiratory tract is an anatomical continuum; bronchial wall thickening is likely to be a surrogate for bronchiolar wall thickening (which is not detectable on CT scanning due to spatial resolution constraints). Thus, the association between airflow obstruction and bronchial wall thickening is likely to reflect pathophysiological events in the small airways.
The possibility that asthma or airway hyperresponsiveness contributes to airflow obstruction in bronchiectasis was not investigated in the present study. Airway hyperresponsiveness is well recognised in bronchiectasis25 ,26 but the prevalence of the clinical entity of asthma is more contentious; in one study atopy and a clinical picture of asthma were no more prevalent in bronchiectatic patients than in the general population.36 It is now believed that inflammatory or obliterative bronchiolitis alone may result in an asthmatic picture without associated abnormalities of smooth muscle.37 Bronchial wall thickening on the CT scan has been documented in asthma38 and obliterative bronchiolitis12 alike; thus, the strong association between bronchial wall thickness and airflow obstruction in our patients does not discriminate between the two processes. One piece of circumstantial evidence against asthma as an explanation for decreased attenuation on the expiratory CT scan is the widespread nature of airways involvement in asthma; by contrast, decreased attenuation in bronchiectasis is related to other morphological abnormalities in bronchiectasis at a lobar level, although it is also seen in some non-bronchiectatic lobes.14
The most surprising finding in the present study was the strong independent association between increasingly severe bronchial dilatation and lesser degrees of airflow obstruction. Preservation of lung volumes is well recognised when obstructive and restrictive processes co-exist, as in the combination of emphysema and fibrosing alveolitis.39 Although a restrictive element is a feature of previous functional studies in bronchiectasis, and was apparent in some of our patients, no satisfactory explanation for this finding has been advanced. Possible mechanisms for lung restriction include atelectasis, pleural disease, or parenchymal scarring due to previous infection, particularly tuberculosis. It is possible that mild post-infective fibrosis might not be detected by CT scanning, especially if the most intense fibrotic change was peribronchial. In the largest histological study interstitial pneumonitis immediately adjacent to airways was a common finding40; peribronchial fibrosis is also regarded as a typical histological feature in bronchiectasis.10 Thus, it is possible that evolution of peribronchial inflammation to fibrotic disease might account for a restrictive functional element and also lessen gas trapping by a traction effect on partially obstructed airways.
Although observer variation for CT features was generally acceptable, imprecision in the scoring of CT features is an important consideration in the pathophysiological applications of the observed associations. Agreement between observers on the presence or absence of tracheal collapse was poor, reflecting variations in normal decreases in diameter on expiration. Thus, a decrease in diameter was variably interpreted depending on whether the sagittal or coronal diameter was considered. A similar caveat limits the confidence with which collapse of the bronchial wall can be interpreted. The moderate interobserver agreement on the severity of bronchial wall collapse reflects difficulties in scoring bronchi running parallel to the plane of the CT section; unless expiratory and inspiratory sections are exactly anatomically comparable, spurious changes in luminal diameter will result from minor differences in CT level. Decreased attenuation on expiratory CT scanning is often a subtle sign, despite the good kappa values in the present study and other CT studies of small airways disease.12 ,14 Recent developments in image processing, including minimum intensity projection images41 and histogram emphasis with wavelet theory reconstruction,42may improve the confidence with which minor differences in the attenuation of the lung parenchyma can be detected.
In conclusion, the major CT morphological determinants of airflow obstruction in bronchiectasis are bronchial wall thickness and decreased attenuation on the expiratory CT scan. The obstructive defect of bronchiectasis is not strongly associated with the collapse of large airways, retention of secretions, or overt emphysematous change on the CT scan. These findings lend belated support to the hypothesis of Reid that airflow obstruction in bronchiectasis results from obliterative bronchiolitis, with or without associated airway hyperresponsiveness.
Acknowledgments
This study was supported by a grant from the Health Research Council of New Zealand.