Article Text

Abstract
BACKGROUND Dyspnoea is a common and disabling symptom in patients with cardiopulmonary disease. Unfortunately the mechanisms that produce dyspnoea are still poorly understood. The relationship between dyspnoea and the load on the ventilatory muscles, chemical drive, and ventilatory indices was therefore assessed in patients with obstructive pulmonary disease during an incremental exercise test.
METHODS Fifty patients with a wide range of obstructive pulmonary disease (mean forced expiratory volume in one second (FEV1) 66.1 (28.8)% predicted) performed an incremental cycle ergometer test. A subdivision was made between subjects with CO2 retention (ΔPaco 2 ⩾0, n = 22) and subjects without CO2 retention (ΔPaco 2 <0, n = 28) during exercise. During the test dyspnoea (Borg score), oesophageal pressures (mechanical load on the ventilatory muscles (time tension index (TTI)), blood gas tensions, and minute ventilation were measured. Correlations for changes in mechanical and chemical factors with changes in dyspnoea score were calculated to assess relevant factors. An analysis of covariance was used to examine whether there was a relationship between dyspnoea score and each of these factors and whether this relationship was different between the subgroups with and without CO2 retention. Multiple regression analysis was used to assess the independent effect of each parameter on dyspnoea sensation. Furthermore, the amplitude of pleural pressure swing ((Pi + Pe)act) generated at maximal work load (Ptot, an indication of the load on all respiratory muscles) was calculated. Analysis of covariance was used to assess whether there was a relationship between tidal volume (Vt) and Ptot and whether this relationship was different between the groups (slopes are an expression of the length-tension inappropriateness, LTI).
RESULTS In the total group and the group without CO2 retention a significant correlation between dyspnoea and the increase in the inspiratory time tension index (TTIi) was present. In the group with CO2retention a significant correlation was seen between dyspnoea and ΔPaco 2. The factors ΔPao 2, ΔVE%MVV and Δ(Vt/Ti) showed a correlation with a p value of ⩽0.10 both in the total group and in those without CO2 retention. In an analysis of covariance the relationship between dyspnoea score and ΔPaco 2 appeared to be significantly different between the two subgroups, being more pronounced in the group with CO2 retention. No other relationships with change in dyspnoea score were found. There was no significant relationship between Vt and Ptot in the total group nor in the two subgroups, indicating some length-tension inappropriateness in both groups.
CONCLUSION In patients with distinctive pulmonary disease who are normocapnic or hypocapnic the mechanical load (ΔTTIi) and length-tension inappropriateness (LTI) on ventilatory muscles seem to be the main determinant of exertional dyspnoea. As soon as hypercapnia occurs, this seems to override all other inputs for dyspnoea.
- dyspnoea
- exercise
- hypercapnia
- respiratory muscles
Statistics from Altmetric.com
Dyspnoea is a common and disabling symptom in patients with cardiopulmonary diseases. Unfortunately the mechanisms that produce dyspnoea are poorly understood.1 When we know more about these mechanisms, treatment to diminish dyspnoea might then be improved. Previous assumptions that dyspnoea represents perception from a single receptor have gradually been replaced by the concept that dyspnoea subsumes many sensations from several receptor mechanisms.2-5 Consequently, it is important to analyse further what factors and mechanisms, and their possible interactions, play a role in the sensation of dyspnoea. Many indices may contribute to the sensation of dyspnoea during physical exercise including central ventilatory drive, hypercapnia, hypoxia, metabolic acidosis and mechanical load on the ventilatory muscles.6-9 Most previous studies have focused on the relationship between either dyspnoea and mechanical variables or dyspnoea and chemical drive, but not on both relationships nor on their interaction. Furthermore, the findings of these studies are, to some extent, controversial.10-12 In this study patients with obstructive pulmonary diseases, with and without CO2retention during exercise, were investigated. A subdivision was made to study the possible different stimuli or processes that lead to the sensation of exertional dyspnoea in different pulmonary groups. Factors that differ in these subgroups of patients might be of mechanical and/or chemical origin.
In normal subjects the arterial Paco 2 decreases in the course of a maximal incremental exercise test. This is not so in patients with abnormal respiratory mechanics. In these patients the ventilatory pump does not keep up with the metabolic needs of the body, causing Paco 2 to rise and Pao 2 to fall.13-15 As a consequence the changes in blood gas tensions may add to the sensation of dyspnoea. Furthermore, in normal subjects an increase in ventilation is mainly achieved by increasing the activity of inspiratory muscles.7 An increase in the activity of inspiratory muscles also occurs in patients but, in contrast to normal subjects, the functional residual capacity (FRC) also increases during exercise in patients with obstructive lung disease.16 Consequently, this will impose an even greater tonic load on these inspiratory muscles so a higher neural drive will be needed and, in addition, higher pressures will need to be generated for lower tidal volumes. At the same time, in subjects with airflow limitation the load on the expiratory muscles increases disproportionately when ventilation is increasing. When a disproportional increase in inspiratory and expiratory muscle loads occurs, the relationship between the length of the muscle and the tension (“load”) generated within the muscles deviates from normal and becomes “inappropriate”.7 ,17This length-tension inappropriateness and the load on the inspiratory and expiratory muscles may also be relevant factors in the sensation of dyspnoea in these patients. A parameter for the mechanical load on the ventilatory muscles is called the tension time index (TTI)18 and is measured with an oesophageal balloon. Traditionally, this parameter is calculated for the inspiratory muscle load (TTIi).18-20 To our knowledge the role of the load of expiratory muscles in the sensation of dyspnoea has not previously been evaluated.
The purpose of this study was to investigate the extent to which exertional dyspnoea (measured with the modified Borg scale21) is correlated with the chemical drive (Paco 2, Pao 2 and metabolic acidoses), the load on the ventilatory muscles (TTIi, TTIe, length-tension inappropriateness, work), and ventilatory indices (VE, Vt), or a combination of these factors. All measurements were recorded during an incremental cycle ergometer test performed by 50 patients with a wide range of obstructive pulmonary diseases. Patients were subdivided into those with carbon dioxide retention (ΔPaco 2 ⩾0) and those without (ΔPaco 2 ⩽0) during exercise. In this way the subjects with a minimal airflow limitation were separated from those with more severe airflow limitation. It is possible that qualitatively different sensations lead to the perception of dyspnoea in the two groups which might enable us to evaluate the mechanical and chemical aspects more distinctly. Figure 1 shows our hypothesis for the steps leading from central motor output to alveolar ventilation and the concomitant results in blood gas tensions are presented schematically. The various physiological parameters measured in this study are also shown.5
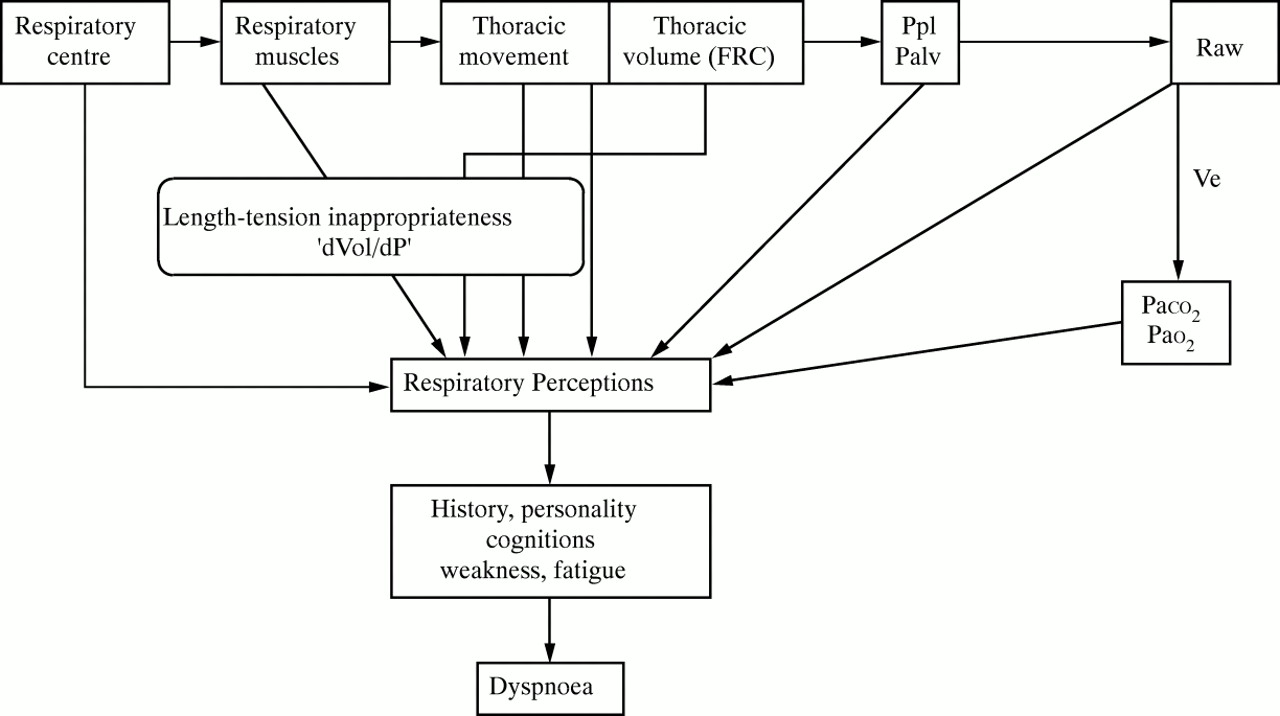
Schematic view of the stimuli which are thought to lead to the sensation of dyspnoea.
Methods
SUBJECTS
Fifty patients with obstructive pulmonary disease of a wide range of severity (chronic asthma or chronic obstructive pulmonary disease, COPD) were selected for the study. Patients performed an incremental exercise test during examination before pulmonary rehabilitation. Data from these tests were used in this study. The characteristics of the subjects are given in table 1. Patients were subdivided into two groups based on the presence or absence of CO2 retention during exercise (ΔPaco 2 ⩾0 and ΔPaco 2 ⩾0, respectively). All subjects performed an incremental cycle ergometer test, the load being increased every minute by 10% of estimated maximal work (Wmax).22The patients were strongly encouraged to perform maximally during the test. Ventilatory indices were measured with a mixing chamber ergospirometer (Oxycon IV, Mijnhardt, Bunnik, The Netherlands) which was calibrated before every experiment with two gas mixtures and a three litre calibration syringe. Maximal voluntary ventilation (MVV) was estimated by multiplying FEV1 by 37.5.
Mean (SD) characteristics of patients and p value of differences between the two groups
BLOOD GAS TENSIONS
Blood was sampled from an indwelling catheter in the brachial artery before the start of the ergometer test and then every three minutes at maximal exercise and three minutes after maximal exercise. In this way Pao 2, Paco 2and base excess (BE) were measured.
REPRODUCIBILITY OF CO2 RETENTION
All subjects who performed a second incremental cycle ergometer test within one year were included in a small reproducibility study in which it was again assessed whether or not patients had CO2retention at maximal work load. The percentage agreement between the two tests was calculated using 2 × 2 tables, the sum of the concordant observations being divided by the total pairs of observations (concordant pairs plus discordant pairs) and multiplied by 100%.
DYSPNOEA AND LEG EFFORT
Perceived dyspnoea and leg effort were measured separately using the modified Borg scale.21 The perceived sensation was matched with a number from 0 to 10 on a logarithmic scale; descriptive expressions were anchored to specific numbers.
To measure perceived dyspnoea (dyspnoea score) the subjects were asked the following question: “How difficult is it to breathe at this moment, do you get enough air?” According to Elliottet al these descriptors are spontaneously chosen by a large proportion of patients with COPD (65%).23
To measure the perceived leg effort (leg score) the subjects were asked the following question: “How difficult is it to move your legs at this moment?”
MECHANICAL LOAD ON THE VENTILATORY MUSCLES
An oesophageal balloon was inserted through the nose with the tip 40 cm from the nares. Oesophageal pressures were recorded continuously during the test (fig 2), though the paper speed was only increased during rest and was maximal for calculation of TTI. From these recordings the mechanical load on the ventilatory muscles at rest and during maximal exercise was assessed in several ways.

Recording of oesophageal pressures during an incremental exercise test in a patient with COPD. Poes scale, calibration +1 and –1 kPa.
Firstly, by calculating the time tension index (TTI).18The oesophageal Pimax and Pemax were assessed by maximal Valsalva and Müller manoeuvres from residual volume (RV) and total lung capacity (TLC), respectively, before the start of the test. In this way the TTI could be calculated at rest and during maximal exercise by the following equation:
TTI = (Piact/Pimax) × (Ti /Ttot)
where Piact (Peact) = actual pleural pressure during tidal breathing, Pimax (Pemax) = maximal inspiratory or expiratory pressure, Ti (Te) = time of inspiration or expiration, and Ttot = total time of the respiratory cycle. TTI was calculated both for the inspiratory and expiratory pressures (TTIi and TTIe). An increase in this parameter is proportional to the increase in the mechanical load on the respiratory muscles.
Secondly, the total pleural pressure swing generated at rest and Wmax (Pi + Pe) was calculated for one tidal breath (Ptot). This factor gives an indication of the forces generated by the inspiratory and expiratory muscles during one tidal breath at rest and Wmax. Furthermore, this total pressure swing was also calculated relative to the maximal amplitude that was achieved when adding Pimax and Pemax. Ptot was divided by Pimax + Pemax and expressed as a percentage (Ptot%).
Ptot = (Piact + Peact)
Ptot% = (Piact + Peact)/(Pimax + Pemax)
Furthermore, an indication of the work delivered by the ventilatory muscles at rest and Wmax was achieved by multiplying the total amplitude/pressure swing (Ptot) at Wmax with the tidal volume both at rest and Wmax (Ptot × Vt).
Finally, to get an indication of the velocity of the contraction, tidal volume was divided by the time in which this volume is inspirated (Vt /Ti). Dividing the generated inspiratory pressure by the time in which it is generated gives an indication of the respiratory drive (Pi /Ti ).
LENGTH-TENSION INAPPROPRIATENESS
The actual volume displacement per unit of pressure generated was analysed by analysis of covariance. In this analysis ΔVtwas the dependent variable and ΔPtot the independent variable. Another variable was included to fit the two groups and an interaction term between this group variable and Ptot was also included, resulting in the following model:
ΔVt = β0 × intercept + β1× group + β2 × ΔPtot + β3 × group × ΔPtot.
A significant interaction term (β3) would imply a different relationship in one group compared with the other. A smaller slope (β2) means more length-tension inappropriateness. This parameter is similar to the “neuroventilatory coupling” that was proposed by O’Donnell24 or the “length-tension inappropriateness” by Campbell.17 This possible length-tension inappropriateness is also a mechanical factor that can lead to the sensation of dyspnoea.
STATISTICAL METHODS
All parameters were measured at the start of the test and at maximal exercise. Changes (Δ) were calculated by subtracting the resting values from those at Wmax. Pearson correlations were calculated between changes in the dyspnoea score and ΔTTIi, ΔTTIe, ΔPao 2, ΔPaco 2, ΔBE, ΔVt, ΔVE, ΔVE%MVV, ΔPtot, ΔPtot%, ΔWork, Δ(Vt /Ti), and Δ(Pi/Ti). Parameters that correlated (p ⩽0.10, “relevant factors”) with a change in dyspnoea were further analysed by means analysis of covariance (SAS statistical package) to assess whether this relationship was different between the two subgroups using the following model:
Change in dyspnoea score = β0 × intercept + β1 × group + β2 × Δrelevant factor + β3 × group × Δrelevant factor.
A significant interaction term (β3) implies that the regression slope coefficient differs between the groups.
Multiple linear regression was used, both for the total group and the two subgroups independently, with change in dyspnoea score as the dependent variable and the assessed relevant factors as independent variables. The backward elimination procedure was used to assess which variables should be included in the model.
All variables were tested for normal distribution. The level of significance was set at p ⩽0.05.
Results
EXERCISE TEST
All 50 patients completed the incremental exercise test. Changes in blood gas values and ventilatory indices during the test are shown in table 2. Twenty eight patients had no CO2 retention during the test and 22 did have CO2 retention. In the group without CO2 retention a VE (%MVV) of 73.9% was reached, whereas the patients with CO2 retention had a VE of 89.6% MVV, indicating that this last group almost reached the limit of their ventilation.
Mean (SD) changes (Δ) between maximum work load and at rest for the two groups with and without CO2 retention independently. p values (t test) are given for the differences between the two groups
REPRODUCIBILITY
Of the 50 patients included in the study, 35 performed a second test and 28 of them were within one year of the first. During the first test 14 patients had no CO2 retention and 14 had CO2 retention, and during the second test the numbers were 12 and 16, respectively (table 3). In total there were 24 concordant pairs out of a total of 28, giving a percentage of agreement of 85.7%.
Subjects with and without CO2 retention during the first and the second test.
CORRELATIONS AND ANALYSIS OF COVARIANCE
Before performing the statistical analyses we confirmed that the changes in the measured parameters were all normally distributed.
The correlation coefficients between the parameters for all 50 subjects and for the two subgroups independently are shown in table 4. There was a significant correlation between the change in dyspnoea score and the change in inspiratory TTI for the total group and for the group of subjects with no CO2 retention during the ergometer test (ΔPaco 2 ⩽0). A significant correlation was found between change in dyspnoea score and ΔPaco 2 for the group with CO2retention. Furthermore, in the total group the relation between change in dyspnoea score, change in VE (%MVV), and the change Vt/Ti (indication for the velocity of contraction) had a p value between 0.05 and 0.10. The relation between change in dyspnoea score and change in Pao2 had a p value between 0.05 and 0.10 in the group without CO2 retention, so changes in inspiratory TTI, Paco 2, VE%MVV, Vt/Ti and Pao 2 were included in the analysis of covariance independently. A significant interaction term was found in the relationship between change in Paco 2 and dyspnoea score (p = 0.04), indicating different relationships in the subgroups with and without CO2 retention. Linear regression demonstrated that the dyspnoea score was significantly related to Paco 2 only in the group with CO2retention.
Correlations between changes in dyspnoea score and changes in other indices for the total group and for the two subgroups independently
There was no significant relationship between change in dyspnoea score and change in inspiratory TTI, VE%MVV, Vt/Ti and Pao 2 for both the total group and the two subgroups.
MULTIPLE REGRESSION
To determine the independent effects of each relevant factor a multiple regression with backward entering of the relevant variables was performed, with change in dyspnoea score as the dependent variable. The independent variables were the factors with a p value of ⩽0.10 in the correlation analysis with the dyspnoea score: ΔTTIi, ΔVE%MVV, ΔPao 2, ΔPaco 2 and Vt/Ti. Furthermore, we assumed that in different subgroups different factors may lead to the sensation of dyspnoea so the analysis was also performed for both subgroups independently.
No significant regression models were found for all groups, except for the univariate model in the group with CO2 retention, Borg dyspnoea with ΔPaco 2. In this group Paco 2 is therefore an independent contributor to the dyspnoea sensation.
LENGTH-TENSION INAPPROPRIATENESS
Figure 3 shows the relation between the factors ΔPtot and ΔVt for the two subgroups. There is a tendency towards a smaller slope in the group with CO2 retention which indicates more length-tension inappropriateness in this group than in the group with no CO2 retention. However, the analysis of covariance showed no significant relation between ΔVt and ΔPtot in the total group (β2), nor in the two subgroups (β3, table 5). When no length-tension inappropriateness is present a relationship between ΔVt and ΔPtot is expected, so we assume that in all these patients some length-tension inappropriateness is present but the magnitude of it is larger in the group with CO2 retention.

Graphical expression of ΔPtot against ΔVt for both subgroups of patients. The slopes of each line are an indication of length-tension inappropriateness. According to the analysis of covariance, no relation was found between Ptot and Vt, nor was there a significant difference in one group compared with the other. This might indicate that length-tension inappropriateness is present in both groups, but there is a tendency towards a lesser magnitude in the group without CO2retention.
Relation between change in tidal volume (Vt) and change in pressure swing (Ptot) by analysis of covariance for the total group
Discussion
The aim of this study was to asses whether perception of dyspnoea during exercise was related to the chemical drive, the load on the inspiratory or expiratory muscles, or a combination or interaction of these parameters. We therefore investigated a group of patients with a wide range of severity of obstructive pulmonary disease. A subdivision was made between patients with or without CO2 retention during exercise in order to distinguish between the effects of mechanical ventilatory loads and mechanical loads accompanied by a “chemical load” on the sensation of exertional dyspnoea, and to assess whether the sensations that lead to dyspnoea were qualitatively different in the two subgroups.
The results have shown that, in the total group and the group without CO2 retention, a significant correlation existed between the Borg score for dyspnoea and the increase in time tension index for the inspiratory muscles. In the CO2 retention group a significant correlation was seen between the Borg score for dyspnoea and ΔPaco 2. Analysis of covariance showed that a significant relationship only existed in the group with CO2 retention—that is, between the change in Paco 2 and change in dyspnoea score. This was also confirmed by the multiple regression analysis. Moreover, there was no relationship between ΔPtot and ΔVt in the total group nor in either subgroup, which may indicate the presence of length-tension inappropriateness. The slope of this relationship tended to be smaller in the group with CO2 retention which means that the magnitude of this inappropriateness is larger in the group with CO2 retention than in those without.
It is questionable whether the two subgroups are, indeed, different from a pulmonary point of view, with different dyspnogenic mechanisms. CO2 retention can be seen as an indication of ventilatory limitation.13-15 The group with CO2 retention might therefore be considered as a group of subjects with ventilatory limitation, although it is debatable whether CO2 retention is the same as ventilatory limitation. The question is whether subjects are really limited by the increase in Paco 2 (a consequence of ventilatory limitation) or whether they would not go further because they simply did not want to. Looking at the ventilatory data at rest it can be seen that the CO2 retention group had a ventilation of 25%MVV whereas the group without CO2 retention had a ventilation of 13%. During exercise ventilation increased to 89.6% in the CO2retention group and to 73.9% in the group without CO2retention. This indicates that the CO2 retention group reached almost maximal ventilation, which is hard to continue for a long time, so it seems that ventilatory limitation is indeed nearly reached. Furthermore, the increase in Paco 2 (a consequence of ventilatory insufficiency) was the only factor that was significantly related to the change in dyspnoea score, which is one of the most important limiting factors in exercise in these patients. We therefore consider that the increase in Paco 2was a true limiting factor and, as such, these subjects had a ventilatory limitation. In this ventilatory limited group the mechanisms that produce dyspnoea might indeed be qualitatively different from those in the group without CO2 retention.
It is noteworthy that there is no correlation between dyspnoea and ventilation related indices. Other studies have shown highly significant correlations within subjects for these indices.10 ,25-27 It must be emphasised that, in this study, analysis has been done on differences between resting values and values at Wmax within the subgroups which might explain the absence of clear correlations. Furthermore, the measured oesophageal pressures are a better representation of the ventilatory effort than the actual ventilation since they were less modified by the mechanics of the respiratory system, although we are aware that oesophageal pressures are only a surrogate of the real inspiratory and expiratory activity. Nevertheless, the results of this study confirm the multifactorial aspect of the model of dyspnoea, with different stimuli contributing differently in various situations.2 ,3 ,8 ,28In normocapnic exercise in patients with obstructive pulmonary disease the sensation of dyspnoea seems to be mainly determined by the mechanical load on both groups of respiratory muscles and the ensuing length-tension inappropriateness. However, when patients become hypercapnic this chemical stimulus seems to override the perception of mechanical load and the hypercapnia becomes the main determinant of the sensation of dyspnoea.
The fact that muscular effort and other mechanical indices contribute to the sensation of dyspnoea has been found by several other studies, both in normal subjects and in patients.10 ,16 ,29 ,30 In contrast, some other studies found no relationship between mechanical load on the ventilatory muscles and the sensation of dyspnoea.11 The role of chemical sensation is more controversial. The additional dyspnogenic effect of Paco 2 found in this study was also seen by Chonan et al 12 who hypothesised that an additional effect caused by afferent chemoreceptor inputs accentuates the difficulty in breathing. He confirmed this hypothesis by inducing hypercapnia in healthy subjects during exercise. In patients with ventilatory limitation who develop hypercapnia during exercise this phenomenon should also be present. Our results confirm this theory. In contrast, Kobayashiet al 31 found that hypercapnia had no additional dyspnogenic effect during a hypercapnic ventilatory response which was also seen by Clague et al. 32 Interestingly, Kobayashiet al also found a dyspnogenic effect of hypoxia during a hypoxic ventilatory response which occurred during moderate hypoxia (desaturation to 80%). Peripheral chemoreceptors normally respond to hypoxia only at very low levels of Pao 2; the relationship between afferent impulse activity and Pao 2 is hyperbolic. We therefore assumed that only increases in Paco 2 act as dyspnogenic stimuli from chemical origin during exercise, which is confirmed in our study. Gandevia et al 6 studied the isolated effect of Paco 2 which turned out to be a potent stimulus for dyspnoea. Although these findings appear to be inconsistent, we may at least conclude that the chemical drive does, indeed, play a part in the perception of dyspnoea. The precise mechanisms underlying the individual stimuli and the interactions between them need to be investigated further.
Furthermore, our results have shown that in the two subgroups with airflow limitation of different severity the perceived dyspnoea at Wmax is almost equal. This agrees with the findings of Killianet al 33 who found that the average subject stops exercise when either dyspnoea or leg effort reaches an intensity of approximately 7, regardless of whether they are normal subjects or patients with airflow limitation. Patients in both subgroups of our study stopped exercise when the dyspnoea intensity reached a Borg score of about 6, although the sensory inputs turned out to be quite different in the two groups. This dyspnoea score apparently does not discriminate between the type of stimulus responsible for the sensation of dyspnoea, which might be a consequence of what question was asked before selecting a number on the Borg scale. Some studies have shown that dyspnoea can be evoked by other sensations and that subjects are able to distinguish these.23 ,34 ,35Other studies have shown that, despite the fact that subjects can distinguish sensory sensations, they scored the same intensity on scales with different definitions of dyspnoea, based on qualitatively different inputs.26 ,36 Madoret al concluded that patients were unable to distinguish respiratory effort from respiratory discomfort when forced to make rapid decisions during incremental exercise, which suggests that the two different scales used were measuring a common element. Because most subjects name their experienced sensations “breathlessness” or “dyspnoea” despite the fact that different stimuli might have led to this perception of dyspnoea, we chose to ask for the effort of breathing, indicating breathlessness. We hoped that the assessed correlations between the different sensations and dyspnoea would give more insight into which stimuli give the general sensation of breathlessness.
As shown in fig 1, there are many inputs that may contribute to the sensation of dyspnoea. In this study we measured most of these inputs or indicators for them. One factor that we did not measure was the magnitude of hyperinflation which is also thought to be an important stimulus for the dyspnoea sensation.16 Nevertheless, we think that we measured enough mechanical and chemical parameters to get a good indication of these two groups of stimuli. In this study it seems that the load on the ventilatory muscles is one of the important factors that correlated with the sensation of dyspnoea in the group without CO2 retention, whereas in the group with CO2 retention an increase in Paco 2seems to be the most important stimulus. The therapeutic consequence of this concept of dyspnoea may be that improving the strength of respiratory muscles by respiratory muscle training will lead to lower values for TTIi, TTIe, Ptot, and Paco 2 during exercise, and subsequently to lower dyspnoea. When we know more about the effects of these single triggers it might be possible to say more about the multifactorial aspect of dyspnoea. Studying the effects of individual (isolated) stimuli is important, but might lead to paradoxical findings. Clague et al found no relation between the isolated CO2 stimuli and dyspnoea sensation, whereas in our study and that of Chonanet al an additional dyspnogenic effect of CO2 on top of mechanical stimuli was found. Both the role of isolated stimuli and of their interactions must therefore be studied further to achieve a better understanding of the mechanisms that produce dyspnoea. When we know more about this aspect of dyspnoea we may be able to determine what treatment is needed. For instance, training of isolated muscle groups might produce less CO2than training more groups of muscles. Furthermore, training with negative work loads leads to a lesser production of CO2also. Finally, inspiratory muscle training might result in better ventilation during exercise which may result in better exhalation of CO2.