Article Text

Abstract
BACKGROUND Measurement of nitric oxide (NO) in exhaled air shows promise as a non-invasive method of detecting lung inflammation. However, variable concentrations of NO are measured in environmental air. The aim of this study was to verify a possible relationship between exhaled NO and atmospheric NO values during high atmospheric NO days.
METHOD Exhaled air from 78 healthy non-smokers of mean age 35.3 years was examined for the presence of NO using a chemiluminescence NO analyser and NO levels were expressed as part per billion (ppb). The exhaled air from all the subjects was collected into a single bag and into two sequential bags. Before each test atmospheric NO was measured.
RESULTS The mean (SE) concentration of exhaled NO collected into the single bag was 17.1 (0.6) ppb while the mean values of exhaled NO in bags 1 and 2 were 16.7 (1.3) ppb and 13.8 (1.2) ppb, respectively. The atmospheric NO concentrations registered before each test varied from 0.4 to 71 ppb. There was a significant correlation between exhaled NO in the single bag and atmospheric NO (r = 0.38, p = 0.001). The atmospheric NO concentration also correlated with exhaled NO both in bag 1 (r = 0.44, p = 0.0001) and in bag 2 (r = 0.42, p = 0.0001). These correlations disappeared with atmospheric NO concentrations lower than 35 ppb.
CONCLUSIONS These results indicate a relationship between atmospheric NO and NO levels measured in exhaled air, therefore exhaled NO should not be measured on very high atmospheric NO days.
- nitric oxide
- atmospheric nitric oxide
- exhaled nitric oxide
Statistics from Altmetric.com
Nitric oxide (NO) is a reactive free radical gas detectable in the exhaled air of human subjects.1 NO is produced by many cells within the respiratory tract and endogenous NO may play an important signalling role in the physiological control of airway function and in the pathophysiological control of airway diseases.2
Exhaled NO (eNO) has been found to be high in patients with asthma,3 bronchiectasis,4 and upper respiratory tract inflammation,5 and to be low in smokers6 and hypertensive subjects.7 NO measurement in exhaled air has thus been proposed as a simple and non-invasive method of studying airway diseases.8 ,9Environmental air is contaminated with various amounts of NO and atmospheric NO (aNO) can change over different days, depending on atmospheric pressure and traffic conditions.10 The aim of this study was to verify a possible relationship between eNO and aNO values during high aNO days in a group of healthy non-smokers.
Methods
SUBJECTS
A total of 78 healthy non-smoker volunteers (52 men) of mean age 35.3 years (range 26–47) were recruited into the study. None of the subjects complained of respiratory symptoms in the three months preceding the study and all were non-atopic as defined by a negative personal and family history for atopy and negative skin prick tests for common allergens. Spirometric measurements showed a mean forced expiratory volume in one second of 102 (3)% predicted. All subjects gave written informed consent for participation in the protocol as approved by the local ethics committee.
EQUIPMENT
The levels of eNO and aNO were measured using a chemiluminescence NO analyser (Model 42S; Thermo Environmental Instruments Inc, Franklin, Massachusetts, USA). The analyser measures photons resulting from oxidisation of NO by ozone, using a photomultiplier. The sampling flow rate was 0.7 l/min with a response time of 10 s (the analyser takes three measurements to reach the highest stable NO value). The instrument was calibrated before use over the range of 0–100 ppb with dilutions of a known NO source by using a multigas precision flow calibrator (Dynamic Gas Calibration System, Model 146, Environmental Instruments Division, USA). Before each test aNO was measured and prior to all NO measurements NO-free air (SAPIO, Milan, Italy) was passed through the analyser for NO zeroing.
The soft palate normally rises during the forced expiratory manoeuvre11 ,12; in agreement with the paper by Silkoff,13 mouth pressure during the expiration was standardised to 20 mm Hg in order to raise the soft palate, avoiding nasal NO leakage on mouth expiration.
Preliminary experiments showed that eNO values were related in a negative manner to the expiratory flow rates (fig 1). We chose an expiratory flow rate of 5.8 l/min for the present study.
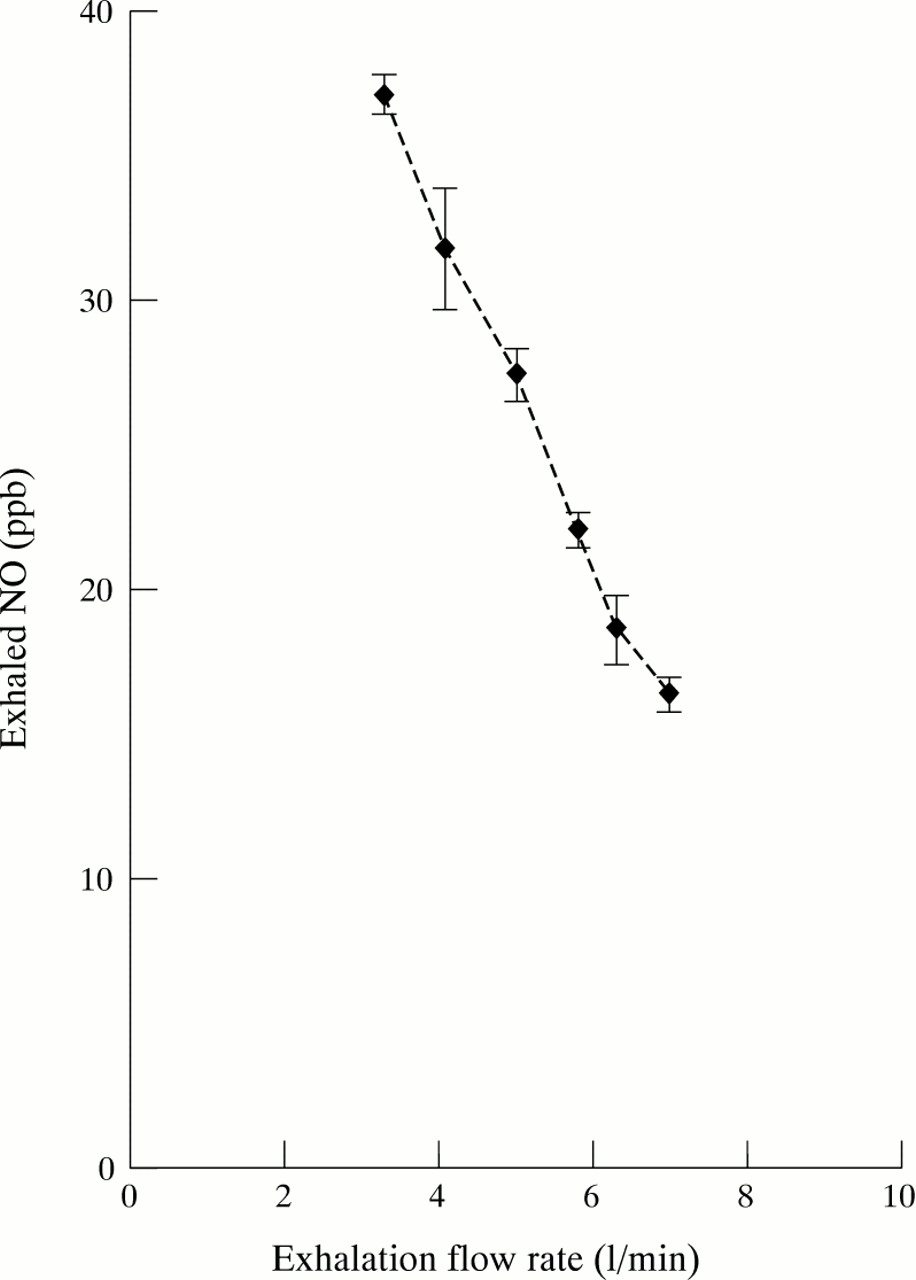
Relationship between mean (SE) expiratory flow rates and exhaled NO values calculated in five healthy subjects.
A Teflon column, 20 × 60 mm, packed with 6 g of silica gel (particle size 1.7–4 mm; E. Merck, D-6100 Darmstadt, Germany) was used in order to prevent condensation of vapour on the walls of the bags.
PROCEDURE
The study was performed from January to March 1997 in Parma and during this time the mean daily aNO concentrations varied as shown in fig 2. The levels of eNO were measured in mixed expired air from all subjects according to the procedure of Massaro et al 14. While seated and wearing noseclips, individuals were instructed to inspire room air to total lung capacity via the mouth and to exhale to residual volume; the duration of this manoeuvre was at least 20 s. Subjects were asked to exhale through a mouthpiece and mixed exhaled air (about 2 litres) was collected into a 10 litre single bag made of polyvinylfluoride film (Tedlar Samples Bags, SKC Inc, Philadelphia, USA) which had previously been shown to be a stable storage vessel for NO.14 ,15 In the same subjects mixed exhaled air was collected, using a three way stopcock, into two sequential bags in order to obtain samples of air from the dead space and the proximal (bag 1) and distal (bag 2) airways. The stopcock was turned at 10 s intervals without disturbing exhalation. About one litre of air was collected in both bags 1 and 2. Each test was performed in the afternoon (from 16.00 to 18.00 hours). Subjects performed three exhalations for the single bag and for bags 1 and 2, and the final eNO values were the means of the three exhalations for the single bag and bags 1 and 2.

Daily mean concentrations of atmospheric NO in Parma from January to March 1997. Data given by Azienda Regionale Prevenzione e Ambiente (ARPA) Parma, Italy.
This protocol was repeated three times from January to March 1997. A total of 702 mean eNO values were analysed, of which 654 (218 values of eNO each for the single bag and bags 1 and 2) were used for the study as they were considered satisfactory eNO measurements with regard to the constancy of expiratory flow. We also analysed the mean eNO measurements excluding those performed when the aNO was higher than 35 ppb. Samples packed in bags were covered with black cloth until analysis.
DATA ANALYSIS
Group data were expressed as mean (SE) and range. Coefficient of variation was used to measure the intraday and interday variability of eNO measurements. Comparisons between data were made using the Mann-Whitney U test. Correlations between eNO and aNO concentrations were tested with the Spearman rank test; a p value of <0.05 was regarded as significant.
Results
All 78 subjects performed the test correctly without discomfort. The mean concentration of eNO collected in a single bag was 17.1 (0.6) ppb (range 5–58.5) while the mean values of eNO in bags 1 and 2 were 16.7 (1.3) ppb (range 5–54.7) and 13.8 (1.2) ppb (range 4.4–52), respectively. The mean variability coefficients among the three exhalations performed in the same day (intraday variability) was 9.3 (1.7) for the single bag and 10.3 (1.8) and 9.7 (1.4) for bags 1 and 2, respectively. Measurements of eNO on separate days (interday variability) in 10 subjects performed when the aNO was lower than 10 ppb showed that the coefficient of variation varied from 0 to 11.2%.
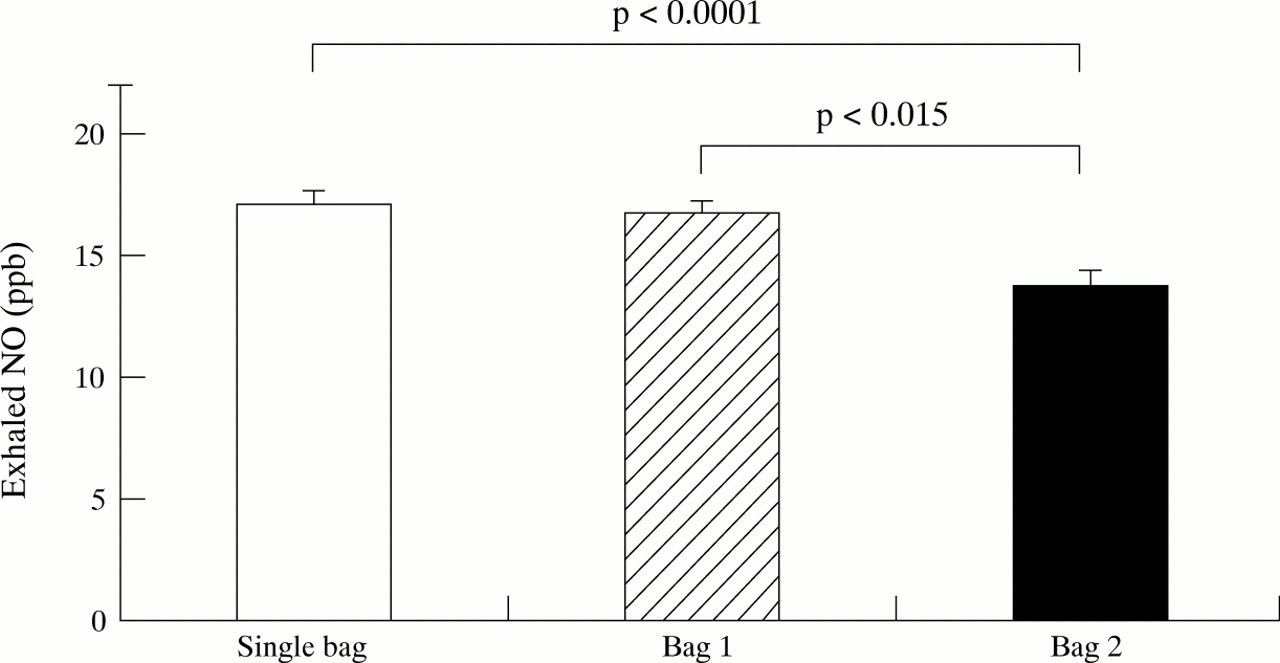
We found a significant difference in the eNO concentration in bag 1 compared with bag 2 (p<0.015), and in the single bag compared with bag 2 (p<0.0001), while no difference was observed between the single bag and bag 1 (p = 0.2; fig 3).

Concentrations of exhaled NO in single bag, bag 1 and bag 2. The single bag contained the entire exhalation, bag 1 contained the first 10 s of exhaled air, and bag 2 contained the second 10 s of exhaled air.
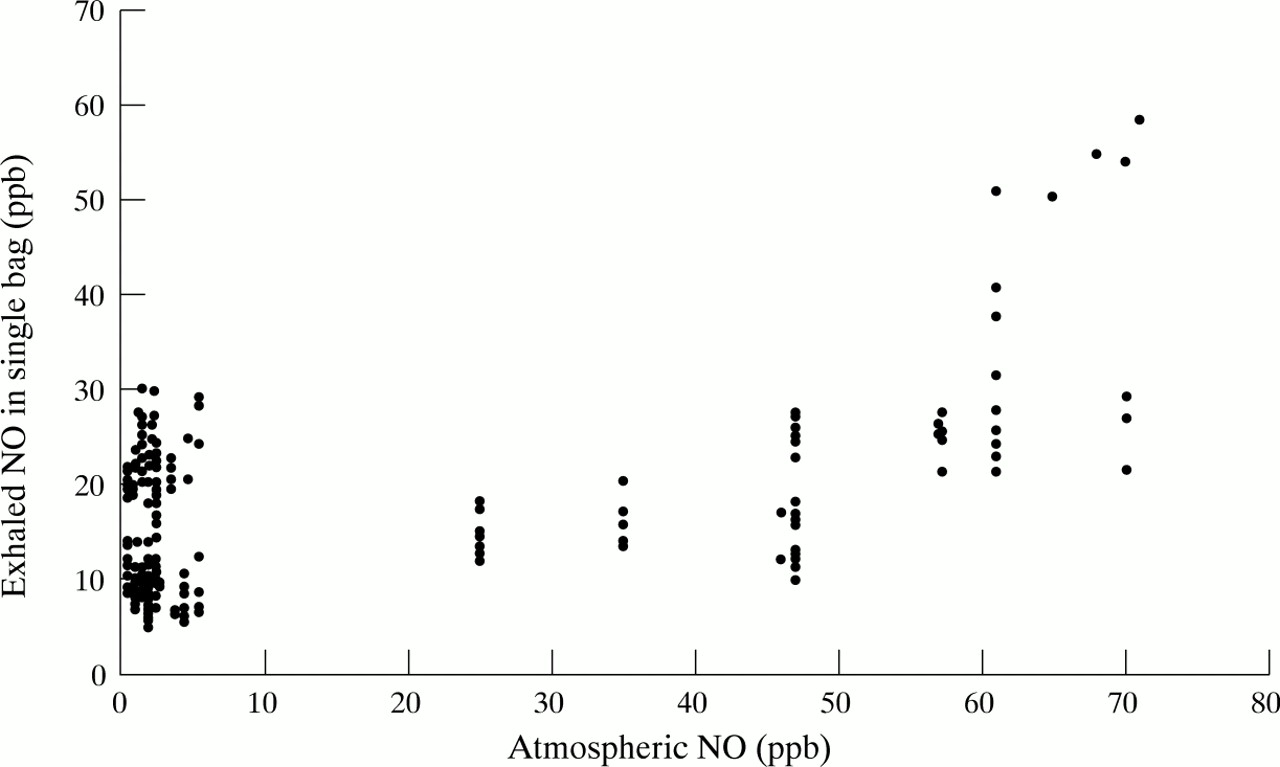
The aNO before each test varied from 0.4 to 71 ppb. There was a significant correlation between the eNO concentration in the single bag and the aNO level (r = 0.38, p = 0.0001; fig4); the aNO also correlated with the eNO levels both in bag 1 (r = 0.44, p = 0.0001) and in bag 2 (r = 0.42, p = 0.0001).
Relationship between atmospheric NO concentrations and exhaled NO levels in the single bag.
The correlations between the aNO and eNO levels in single and fractionated bags disappeared when the aNO level was lower than 35 ppb: single bag (r = 0.06, p = 0.3), bag 1 (r = 0.1, p = 0.2), bag 2 (r = 0.1, p = 0.3).
The mean eNO levels obtained when the aNO level was lower than 35 ppb were 14.9 (0.53) ppb (range 5–30) for the single bag and 12 (1.01) ppb (range 5–29.3) and 10.7 (0.93) ppb (range 4.4–25.2) for bags 1 and 2, respectively.
Discussion
The results of the study indicate a relationship between aNO and eNO levels. This phenomenon is present both in the first and in the second part of exhaled air and the correlation disappears when the aNO level is lower than 35 ppb.
The measurement of eNO is currently being tested for its use in the management of various airway diseases. High and variable concentrations of this gas are also detected in ambient air. The presence of the relationship between aNO and eNO levels shows that it is risky to study eNO without monitoring aNO. Figure 2 shows wide variability in the daily mean levels of aNO; moreover, we noticed that the concentration of aNO changed suddenly during the day (data not shown) which suggests that aNO should be measured immediately before each eNO measurement.
In a group of healthy adult subjects our data are in agreement with those of Dötsch et al 16 who found a correlation between aNO and eNO levels in a mixed group of healthy and sick children. Other authors, however, did not find this correlation.17 ,18 This discrepancy may be explained by the fact that Borland et al 17and Robbins et al 18 correlated eNO levels with aNO levels that never exceeded 7 ppb and 20 ppb, respectively. In these studies the lack of a relationship between aNO and eNO levels can probably be explained by the fact that the influence of the aNO level on eNO levels began from a higher aNO level. In our study the trend of the correlation (fig 4) shows that eNO levels begin to increase when the aNO level exceeds 35 ppb. Moreover, the correlations we found between aNO and eNO levels disappeared when the aNO was lower than 35 ppb. This is probably the level of aNO above which the study of eNO becomes risky and this agrees with Kharitonovet al 3 who found that an aNO level lower than 38 ppb did not influence the readings of eNO.
We are aware that the lack of a comparison with eNO values obtained after an inspiration with NO-free air is necessarily a limit to any precise interpretation of our data because correlations between eNO and aNO levels point towards associations that can result from several mechanisms (equipment, dead space air, pro-inflammatory action, etc).
We fractionated exhaled air into two sequential portions in order to verify the influence of aNO on eNO in both aliquots. We assumed that bag 1 would include more gas derived from the proximal airways and dead space and less from the distal airways than bag 2. Since NO is not absorbed to any large extent in the dead space9 but is absorbed in the lung,19 we expected to find an influence of aNO on the first part of exhaled air but not on the second. In this regard, Silkoff et al 13 found that deep inhalation with enriched NO gas (1059 ppb) was able to influence the first part of the exhalation (the peak) but not the second part (the plateau). However, we found a significant correlation between aNO and eNO levels both in bag 1 and in bag 2. This discrepancy could be explained by the fact that a daily and continuous exposure to high aNO levels (see fig 2) might influence eNO levels more than a single inhalation with a high NO concentration. This observation shows that, to avoid the influence of aNO on eNO levels, it is not sufficient to discharge only the first aliquot of exhaled air.
In theory, inhaled NO can be either detrimental or beneficial to the airway inflammatory process.20 It would be of interest to know if and how the daily exposure to high concentrations of aNO can act on airway inflammation in patients with chronic lung diseases.
In agreement with Tsujino et al 21 we found an increased concentration of eNO in the first aliquot (bag 1) of mixed exhaled air compared with the second (bag 2); this might signify that the first part of exhaled air is still influenced by small amounts of nasal and oropharyngeal NO even though we tried to use a system to avoid nasal NO leakage. This fits with the recommendations of Kharitonov et al 22 who suggested that a system of valves should be applied to separate the last part of expiration when NO is measured with the collection bag technique. A second explanation for the differences in eNO levels between bags 1 and 2 could be that NO is differently produced in the airway tree.23 ,24 However, not all studies have found different sites of NO production in airways15 and this confirms the need for more studies to gain insight into the site of NO production.
We also analysed the mean eNO levels excluding those that were performed when the aNO level was higher than 35 ppb. The values we found were similar to those obtained by other authors using either the collection bag technique18 or by on line measurements of the eNO plateau.13 While analysing data obtained when the aNO level was lower than 35 ppb, in agreement with Robbinset al 18 and Borlandet al 17 we observed a wide range of values in eNO levels of our healthy subjects. This could create some difficulties when comparing healthy and ill subjects and it would be interesting to know why, in healthy subjects, there is such a wide range of eNO values.
In conclusion, our study indicates a relationship between aNO and eNO levels and we recommend that eNO levels should not be measured on days with very high aNO levels.
Acknowledgments
We would like to thank Elisabeth de Young from the Linguistic Centre, University of Parma, for her help with the final text of this manuscript. We also thank Cristiano Immovilli for his excellent help in maintaining the analyser. The study was partially supported by a grant from Ministero dell’Università e Ricerca Scientifica e Tecnologica, Rome, Italy.