Article Text

Statistics from Altmetric.com
Shahab et al recently reported significant under-diagnosis of chronic obstructive pulmonary disease (COPD) in England.1 Adults over 35 years were regarded as having airway obstruction (COPD) if the forced expiratory volume in 1 s/forced vital capacity (FEV1/FVC) ratio was <0.70. This conforms with the Global Initiative for Chronic Obstructive Lung Disease (GOLD) guidelines2 adopted by various organisations, albeit that no data were obtained after bronchodilation. Even the GOLD group acknowledges that there is no evidence that this cut-off point signifies clinically validated airway obstruction and that “the use of this fixed ratio may result in over-diagnosis of COPD in the elderly, especially of mild disease. Using the lower limit of normal (LLN) values for FEV1/FVC that are based on the normal distribution and classify the bottom 5% of the healthy population as abnormal is one way to minimize the potential misclassification.”2 This statement does justice to science and to authors of predicted values for spirometric indices who carefully defined the LLN for various indices, none of them advocating the use of a fixed cut-off point. In fact, in 45 publications, an overwhelming majority found that the LLN for FEV1/FVC fell below 0.70 with age.3
In the 1995/6 study of a representative sample of the English population, valid spirometric data were obtained in 11 854 men and 13 554 women.4 Measurements in 6053 non-smoking white people with no reported diagnosis of asthma or respiratory symptoms were used to derive prediction equations for the FEV1/FVC ratio and its LLN. For an adult woman of 160 cm and a man of 174 cm, the LLN for FEV1/FVC fell below 0.70 at ages 61 and 48 years, respectively. Using a fixed ratio, airway obstruction will hence be under-diagnosed below those ages and over-diagnosed above those ages.
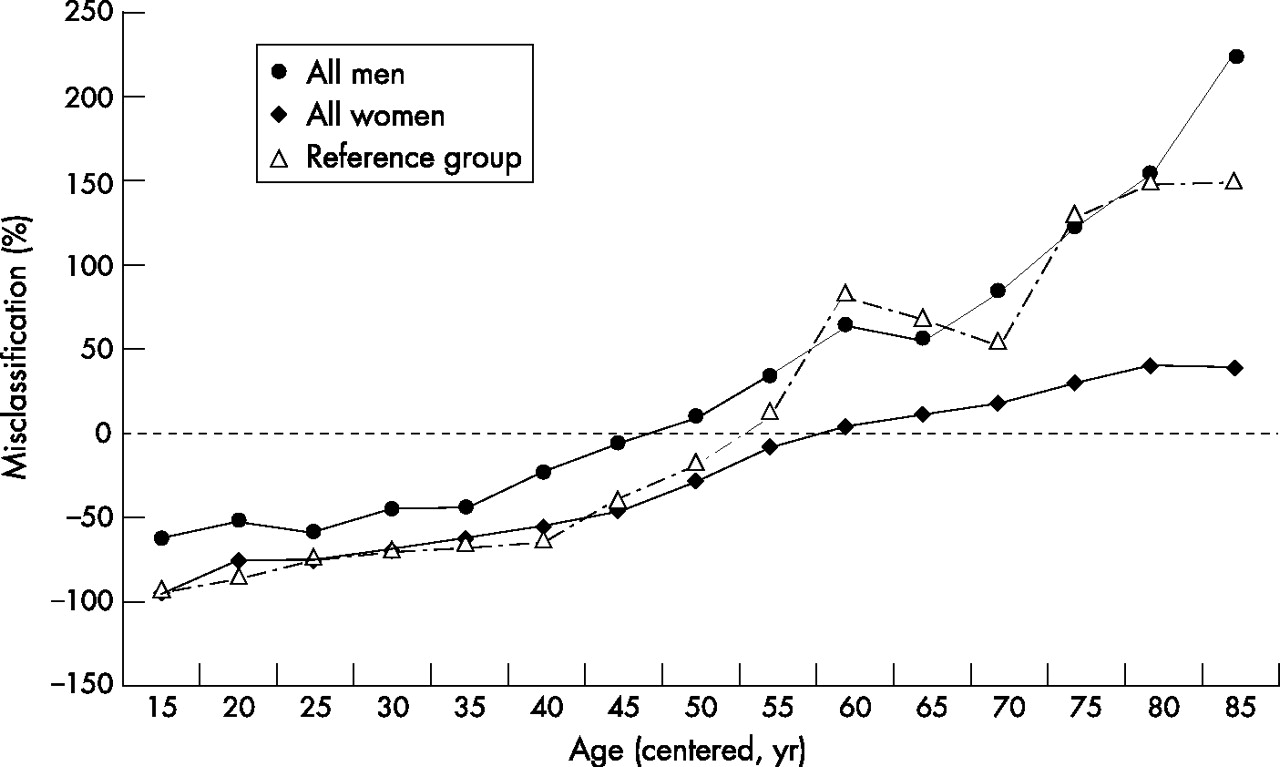
Using data on 25 408 subjects,4 we established how often FEV1/FVC was <0.70 (method A) or below the LLN (method B). Figure 1 illustrates the misclassification rate. We expressed the difference between A and B as a percentage of B. Thus, 0% means equal prevalence, 100% means that the fixed ratio for FEV1/FVC identified twice as many subjects with airway obstruction as the LLN method (50% false positives), and −80% means that the fixed ratio method failed to identify 8 out of 10 subjects with airway obstruction (80% false negatives). Using the NHANES III database and data from a Dutch population, sample findings were comparable with those in fig 1; the 2001 Health Survey for England data used by Shahab et al produced results nearly identical to those in fig 1. The trend in non-smoking men and women with no reported diagnosis of asthma or respiratory symptoms (a healthy reference group) is the same as that in the whole population.

Percentage of subjects with airway obstruction (FEV1/FVC <lower limit of normal) misclassified using GOLD guidelines (FEV1/FVC <0.07), as a function of age. Misclassification: negative value = under-diagnosis; positive value = over-diagnosis. Data from 1995/6 Health Survey for England.4
The findings in a healthy reference group illustrate the inappropriateness of using a fixed FEV1/FVC ratio for establishing airway obstruction. Applying that criterion to the whole population leads to substantial over-diagnosis of airway obstruction in middle-aged and elderly subjects, particularly in men, and unacceptably large under-diagnosis in younger adults. We recommend that organisations like GOLD, the American Thoracic Society, European Respiratory Society, British Thoracic Society and the National Institute for Clinical Excellence—who all recommend an FEV1/FVC ratio of <0.70 as evidence of airway obstruction—return to evidence-based medicine and revise their guidelines.
Authors’ reply
We are grateful for the comments by Falaschetti et al on the usefulness and suitability of the Global Initiative for Chronic Obstructive Lung Disease (GOLD) standard for the diagnosis of COPD. We appreciate that there are other approaches to defining abnormal airflow—indeed, one co-author (JB) was involved as a consultant to the study cited in their letter1—but our objective was to assess the extent of under-diagnosis according to current conventional criteria. We agree (and have acknowledged in the paper) that the lack of post-bronchodilator values will lead to overestimation of the prevalence of COPD, but do not believe that this effect would be of sufficient magnitude to account for more than a small minority of the under-diagnosis apparent, especially when considering the inclusive definition of COPD diagnosis used in our study. We have reanalysed the data using the lower limit of normal (LLN) method based on reference values from Falaschetti et al1 and find that estimates of COPD prevalence (11.2%; 95% CI 10.5% to 11.9%) and under-diagnosis (78.8%; 95% CI 76.1% to 81.5%) are very modestly reduced compared with GOLD standard figures for prevalence (13.3%, 95% CI 12.6% to 14.0%) and under-diagnosis (81.2%; 95% CI 78.9% to 83.6%). Equally, smoking prevalence figures are somewhat higher among LLN-defined cases of COPD (39.5%; 95% CI 36.3% to 42.7%) than among GOLD-defined cases (34.9%; 95% CI 32.1% to 37.8%). However, irrespective of the criterion used, under-diagnosis of COPD remains a major problem, particularly among smokers (figs 1 and 2).
Reference
Footnotes
-
Competing interests: None.