Article Text

Abstract
Computed tomographic scanning may replace lung function tests as the golden standard for assessing the response to known and novel treatments for α1-antitrypsin deficiency.
- α1-antitrypsin deficiency
- computed tomography
- emphysema
Statistics from Altmetric.com
Severe hereditary α1-antitrypsin (AAT) deficiency is characterised by a reduced serum AAT level down to about 20% of the normal level leading to the development of emphysema. Smoking is the most significant additional risk factor resulting in reduced lung function in the third and fourth decades of life, leading to early disability and death.1 Intravenous substitution treatment is approved in the USA, Italy, Spain, and a few other countries, but its efficacy has not been proved by a randomised placebo controlled trial. Such a trial, with the forced expiratory volume in 1 second (FEV1) as an end point, requires monitoring a large number of patients for many years to prove the therapeutic effect.2 Therefore, in most countries, the main aspects of management are limited to early detection and advice on smoking cessation. Other lines of management are similar to those applied in smoking induced emphysema. New ways to deliver AAT and the regeneration potential of retinoic acid therapy have promoted computed tomographic (CT) scanning as a method of early detection and follow up in longitudinal studies. This paper reviews the background of the use of CT in diagnosing and quantifying emphysema in general, and emphysema associated with AAT deficiency in particular. The CT features of this type of emphysema and its correlation with pathology, lung function tests, and quality of life are discussed, together with the current knowledge about the role of CT scanning in monitoring the progression of the disease.
HISTORICAL BACKGROUND
The first clinical CT images were of the head and were produced at the Atkinson Morley Hospital in London in 1972.3 The new imaging technique was enthusiastically welcomed by the medical community and the inventors G N Hounsfield and A M Cormack were awarded the Nobel prize for medicine in 1979.3
The first account of CT changes in emphysema appeared when the sensitivity of chest radiography was questioned. The chest radiograph is a useful but imprecise method of diagnosing emphysema, and even patients with severe emphysema can be missed by plain radiography.4 In 1978 Rosenblum et al5 described the CT features of emphysema. They found that the lungs of patients with emphysema had a lower mean density than normal lungs, and even more striking were the large zones of extremely low density scattered throughout the lung. To our knowledge, this was the first description of low attenuation areas characteristic of the CT appearance of parenchymal destruction in emphysema.
PLAIN CHEST RADIOGRAPHY VERSUS CT SCANNING
CT has two major advantages over plain radiography: (1) the true cross sectional anatomical image provided without superimposition of organs, and (2) higher contrast because neighbouring or superimposed structures have no or very little influence on the contrast resolution of structures.3
The latter criterion helps to detect subtle differences in lung density and allows direct visualisation of lung destruction and evaluation of its severity. The rapid development of CT technology, the emergence of multi-detector (or multi-slice) scanners capable of making 4–16 slices at one rotation, and reduced rotation time to 0.5 seconds make it possible to scan the whole chest in 8–10 seconds (that is, within a single breath hold). These technical advances have led to improvements in image quality with the possibility of multi-planer reconstruction together with reduction in radiation exposure, an inherent disadvantage of radiography.3
Definition of emphysema
Pulmonary emphysema is defined by the National Heart, Lung and Blood Institute as “a condition of the lung characterized by abnormal, permanent enlargement of airspaces distal to the terminal bronchiole, accompanied by the destruction of their walls, and without obvious fibrosis”.6 Three subtypes of emphysema are described: centrilobular emphysema (CLE), paraseptal emphysema (PSE), and panlobular emphysema (PLE); the latter is the pathological subtype associated with AAT deficiency. In PLE the pulmonary lobule is more or less uniformly destroyed from the respiratory bronchiole to the terminal distal alveoli. The lesions are characteristically more predominant in the lower lobes. In cigarette smokers with normal levels of AAT, PLE may be seen in conjunction with CLE but it is not the dominant morphological abnormality7 and, as emphysema worsens, it becomes difficult to distinguish PLE from CLE, both pathologically and radiologically.
CT features of PLE
The clinical features of emphysema may only be recognised late in the course of the disease and are imprecise in the diagnosis of the condition. Signs of hyperinflation and reduced vascularity on the plain chest radiograph are no more precise than the clinical features in diagnosing this condition, nor has the hope been realised that lung function tests would be sensitive and specific enough to detect emphysema. Since emphysema is defined in pathological terms as loss of lung tissue, the major advance in the in vivo diagnosis and quantitation of emphysema has come from CT scanning8,9 which reveals signs of emphysema before the appearance of symptoms or changes in lung function.
Emphysema associated with AAT deficiency is panlobular, characterised by uniform destruction of the pulmonary lobule leading to widespread areas of abnormally low attenuation without visible walls (fig 1). In contrast to CLE, the destruction is generalised and more prominent in the lower lobes.10–13 Pulmonary vessels in the affected lung are fewer and smaller than normal. There is pruning of small vascular branches resulting in a simplified vascular tree with fewer orders of branching, distortion of blood vessels around areas of low attenuation, and enlargement of the main pulmonary arteries.11,14 These changes are easily distinguished from normal lungs in severe PLE; however, in mild to moderate PLE they can be very subtle and difficult to detect.15 PSE is an uncommon accompanying lesion and bullae are not considered a major feature of the disease.13 Other features of hyperinflation are an anterior junctional line at the carinal level of more than 3 cm, intercostal bulging of the lung where the pleura takes a wavy configuration, and sabre sheath trachea.16,17

HRCT scan of the lung bases in a patient with PLE due to AAT deficiency after unilateral lung transplantation (right). The left lung shows uniform destruction of the pulmonary lobule associated with fewer and smaller pulmonary vessels.
Studies suggest an association between AAT deficiency and bronchiectasis or bronchial wall thickening.13,18,19 In Eriksson’s original patients, bronchiectasis was reported in two of 23 patients.20 In a series of 17 patients with PLE due to AAT deficiency, Guest et al13 reported bronchial wall thickening, dilatation, or both in seven (41%). Gross cystic bronchiectasis was visible in one case. King et al18 found bronchiectasis in six (43%) of 14 patients with AAT deficiency. This finding was associated with infection and was prevalent in lobes with higher emphysema scores. Lower rates of bronchiectasis, invariably cylindrical and limited in distribution, have also been reported.21 In most cases bronchiectasis was associated with PLE, but bronchiectasis preceding the development of PLE has also been described.19 However, it is still uncertain whether bronchiectasis is a primary feature of the disease or a result of airway damage due to recurrent infection. In a study of patients with radiologically proven bronchiectasis without emphysema,22 the AAT phenotype distribution and gene frequencies were similar to a control group of blood donors. It was therefore concluded that AAT deficiency does not play a role in the pathophysiology of bronchiectasis.
Recommended CT settings
As a result of decreased volume averaging and higher spatial resolution, high resolution CT (HRCT) scanning is superior to conventional CT scanning for visual identification of small areas of emphysema.15,23,24 The HRCT technique aims at optimising the demonstration of lung anatomy. Collimation of 1–2 mm is essential together with the use of a high spatial frequency algorithm (known as bone, sharp, or hard depending on the scanner manufacturer). This increases the spatial resolution, making the structures appear sharper. With current scanners that have a rotation time of less than 1 second, scan techniques of 120–140 kV and tube current of 200–250 mA have proved satisfactory.25 The field of view should be sufficient to encompass the patient (30–40 cm) and the matrix size used should be the largest available (512 × 512–1024 × 1024). A window level of −700 Hounsfield units (HU) and a width of 1500 HU are optimal for lung structures.26
CT QUANTITATION OF EMPHYSEMA
More than 20 years ago it was noted that the CT density of emphysematous lung was decreased compared with normal lung.5,14,27 Several CT-physiological and CT-pathological studies were based upon visual (subjective) quantitation of emphysema. Visual scoring can be accomplished by (1) calculating the percentage of lung volume affected by emphysema;28,29 (2) comparing CT scan images with anatomical standards designed for pathological grading of emphysema;30,31 and (3) placing a grid over the CT image and analysing the severity and extent of emphysema in each square centimetre.15
Visual scoring for quantitation is insensitive, subjective, time consuming, and has high intra- and inter-observer variability.32–34 Because of their digital nature, CT images lend themselves to objective computer analysis, and software has been developed for semi-automatic calculation of so-called densitometric parameters from the pixel attenuation values of CT images. Two sophisticated parameters, the percentile density and the relative area (or pixel index), extracted from the CT lung density histogram have been widely used.34,35 The percentile density is the cut off point in the histogram that defines a given percentile in the histogram35—for example, the 15th percentile density is the density value (HU) at which 15% of the pixels have lower densities; by adding 1000, the density values can be converted into g/l units—for example, a 15th percentile density of −950 HU corresponds to 50 g/l (that is, 15% of the pixels have a density value below 50 g/l).
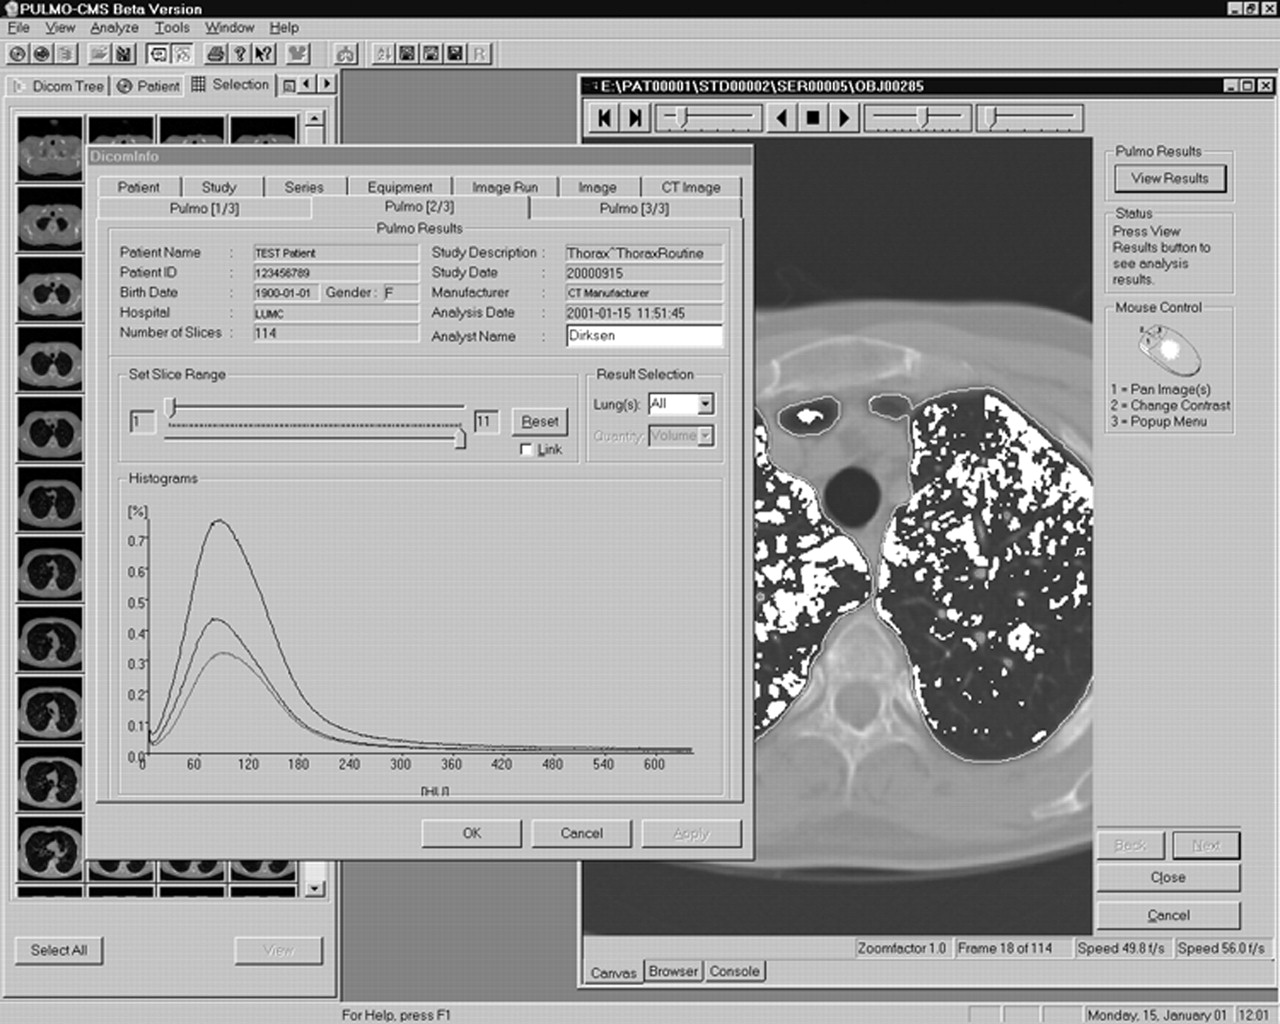
The relative area of emphysema is based on the “density mask” concept which relies on highlighting areas of attenuation below a given threshold, making it easy to identify and visualise—even three dimensionally—the emphysematous region (fig 2). Originally, Müller et al34 used a threshold of −910 HU, and later Gevenois et al found a better correlation with both macroscopic and microscopic emphysema at a threshold of −950 HU.36,37

“Pulmo-CMS” software (MEDIS, Medical Imaging Systems, Leiden, The Netherlands) for analysing CT lung density. The window in the front shows the lung density histogram for the whole lung and for the left and right lungs, separately. The window in the back shows a “density mask” analysis where emphysematous areas are highlighted (white).
Different CT settings have been used to quantitate emphysema and a consensus on this issue is still to be reached. Several quantitative studies have used high spatial resolution with good results.33,36,37 However, one previous study found poor density resolution for thin sections and hard reconstruction algorithms.38 In a recent study we found that the use of a hard reconstruction algorithm results in overestimation of the extent of emphysema by 8 HU using the 15th percentile density compared with the soft algorithm.39 With volume multi-detector scans obtained at total lung capacity we recommend the following CT settings: 5 mm collimation, high speed rotation, pitch 1.5 (*M), 140 kVp, and tube current 40 mA. Images should be reconstructed with 50% overlap using low (soft) frequency algorithm.
CT-PATHOLOGICAL CORRELATION IN EMPHYSEMA
Studies have been conducted to compare the radiographic and pathological extent of CLE and, to a lesser extent, PLE, since the latter comprises about 1–2% of all cases of emphysema. Areas of low attenuation are the radiological equivalent of loss of tissue in emphysema and represent the CT sign that correlates best with the presence and severity of emphysema.40 Visual scoring of the extent of emphysema on the CT scan correlates to macroscopic quantitation of emphysema using the panel grading system in resected lobes41 and post mortem lungs.30 It was suggested that HRCT is able to distinguish normal lungs from emphysematous lungs and to detect even the mildest degrees of CLE.30 This finding was challenged by Miller et al15 who found that CT is insensitive in detecting the earliest lesions of emphysema because most lesions below 0.5 cm in diameter were missed. The group also reported that CT consistently underestimated mild and moderate PLE and CLE. However, they found a good correlation between the CT score and the pathological score (r = 0.81) with the use of 10 mm collimation scans, and even better (r = 0.85) with the use of 1.5 mm scans.
It is interesting to know that the first CT-pathological correlation study used an objective densitometric parameter. Hayhurst et al27 showed that patients with CLE have more pixels in the range of −900 to −1000 HU than non-emphysematous patients. The authors predicted that emphysema could be localised by highlighting pixels within a predefined threshold; this idea led to the “density mask” concept mentioned above. Subsequently, two CT-pathological studies were conducted using objective CT-densitometric parameters. Müller et al34 compared the density mask software program of the GE 9800 scanner with the pathological extent of emphysema. In this study a single representative 10 mm slice was compared with the corresponding section of fixed lung cut in the same plane as the CT scan; the highest correlation was obtained using a threshold of −910 HU. An important methodological limitation of this study was the use of intravenous contrast medium which is not recommended in lung densitometry. Using HRCT, Gevenois et al36,37 found that, at a threshold of −950 HU, there was no significant difference between the radiological and pathological extent of emphysema. But, as already mentioned, although HRCT scanning improves the visual assessment of emphysema, the combination of thin sections and a hard (or sharp) reconstruction algorithm results in poor density resolution and should be avoided in densitometric studies.38
The second objective method was introduced by Gould et al35 who found a good correlation between the area of the distal airspaces and the 5th percentile density calculated from the frequency histogram. This study had some limitations: a 13 mm collimation scan was used that easily misses small lesions and the slice scanning time was 17 seconds which includes high risk for motion artefacts. It was concluded that CT can diagnose, quantitate, and—by highlighting—locate mild to moderate emphysema. The 5th percentile chosen by Gould et al represents very low densities and corresponds to areas that contain almost only air; subsequent studies used higher percentiles that correspond to emphysematous regions.42,43
Spouge et al24 determined the value of CT in assessing the presence and extent of pathologically proven PLE. To our knowledge, this is the only CT-pathological correlation study exclusively on patients with PLE. Five patients without emphysema and 10 patients with PLE were studied, four of whom had severe emphysema due to AAT deficiency. Conventional scans (10 mm) were obtained in 14 patients and HRCT scans (1.5 mm) in nine. Emphysema was assessed pathologically using the modified panel grading system. There was good correlation with pathology using conventional CT scanning (r = 0.90, p<0.01) and HRCT scanning (r = 0.96, p<0.01). The extent of PLE was consistently underestimated, although less so on HRCT scanning (slope 0.67) than on conventional CT scanning (slope 0.47). Conventional CT scans correctly identified or excluded PLE in 10/14 cases and HRCT in 6/9 cases. The authors therefore concluded in 1993 that mild PLE was still beyond the diagnostic capabilities of CT technology.
CORRELATION OF CT SCANNING WITH LUNG FUNCTION
The physiological hallmarks of emphysema are expiratory airflow obstruction (decreased FEV1 and FEV1/FVC) and decreased carbon monoxide transfer factor (Tlco). The pathological changes precede the onset of decline in lung function by a number of years,44 and it has been estimated that, in CLE—which is more prominent in the upper lobes—30% of the lung must be destroyed before symptoms or changes in lung function become evident.45 Studies have shown that Tlco is closely correlated with the extent of emphysema on CT scanning with both subjective29,46,47 and objective48 quantitation. However, decreased Tlco is a non-specific indicator of impaired gas transfer across the alveolar membrane, while CT has the advantage of being anatomically more specific. Conversely, several studies found less good correlation between CT and measures of airflow obstruction such as FEV1.14,29,35,37,46,49–52
Guest and Hansell13 reported the CT-physiological correlation in 17 patients with a proven diagnosis of AAT deficiency. Areas of low attenuation and vascular pruning and distortion were present in all zones, with a slight predominance in the lower lobe. There was good correlation between the visual score of emphysema on the CT scan and FEV1/FVC (r = −0.78, p<0.001) and the transfer coefficient Kco (r = −0.61, p<0.001). Significant correlation with airflow obstruction in AAT deficiency was also found by Dowson et al53 who studied the cross-sectional relation between the relative area below −910 HU calculated from HRCT scans, lung function tests, and health status in 111 patients with homozygous AAT deficiency with pure PLE. This was the first cross sectional study to explore the relationship between CT and health status, which was assessed by the St George’s Respiratory Questionnaire (SGRQ) and the Short-Form health survey (SF-36). They found a significant correlation between CT and airflow obstruction and Tlco, the latter being slightly stronger. More interesting was the clear relationship between CT and the disease-specific SGRQ scores as well as many domains of the generic SF-36. However, a subsequent longitudinal study21 showed no correlation between CT lung density, which deteriorated over a 2 year period, and the overall SGRQ score which improved, apart from the activity domain which showed a significant decline.
CT SCANNING AS A PREDICTOR OF MORTALITY
Dawkins and colleagues54 followed 200 individuals with severe AAT deficiency for a mean of 2 years with the SGRQ score, lung function tests, and CT scans. Twenty patients who died after enrolment into the study had lower FEV1 (percentage predicted), a lower Kco (percentage predicted), a higher relative area of emphysema below −910 HU, and higher SGRQ scores indicating worse health status compared with survivors. Subsequent multiple (Cox survival) regression analysis showed that the upper zone CT emphysema index was the most powerful predictor of mortality followed by the SGRQ activity score, whereas age and lung function measurements had no independent effect on survival. These recent data contribute to the validation of CT lung density as a superior outcome measure for monitoring the progression of emphysema.
CT SCANNING IN MONITORING THE PROGRESSION OF EMPHYSEMA
Measures of lung function, particularly FEV1, have traditionally been used to assess the progression of emphysema but, because of a large within-subject variation compared with the annual decline, more sensitive markers of the rate of decline are being investigated. The establishment of a strong correlation between CT scanning and the pathological extent of emphysema led to the suggestion that emphysema could be assessed more accurately by repeated CT scans than by measuring the FEV1 alone.8 Because of its subjective nature, visual scoring was shown to be inconsistent in longitudinal studies. Two experienced radiologists scored the annual HRCT scan of 22 patients with AAT deficiency as “stable” or “progressive” disease. The degree of agreement in the classification of the patients was the same as would be expected by chance.42 As a result, longitudinal studies have so far used objective densitometric parameters.21,42,55,56
The major confounder in this respect is the depth of inspiration since lung density more than doubles from full inspiration to full expiration.57 Two approaches have been suggested to overcome variations in lung volume between scans. In a group of patients with AAT deficiency, Zagers et al56 used spirometrically gated scans at 90% of vital capacity and showed a significant annual fall in mean lung density. A limitation of this approach is that patients with COPD are less able to reproduce the same level of vital capacity in successive scans.58 The second approach was suggested by Dirksen et al42 and relied on regression analysis to adjust the lung density according to the total lung volume calculated from the CT images. This method was applied in a randomised placebo controlled study of intravenous AAT in 56 patients with homozygous AAT deficiency.55 The annual loss of lung tissue determined by the 15th percentile density was 2.6 (0.41) g/l in the placebo group and 1.5 (0.41) g/l in the treatment group (p = 0.07). Power analysis showed that the protective effect of augmentation treatment would be statistically significant in a similar trial over a period of 3 years with 130 patients. Separate analysis of the placebo group showed that CT lung density was twice as sensitive as lung function tests for detecting the progression of emphysema.55
One study presented longitudinal CT data without adjustment to the level of respiration.21 This was a 2 year follow up study of 43 patients with severe AAT deficiency and PLE with lower lobe predominance. Quantitation of emphysema by the relative area below −910 HU extracted from HRCT slices at the upper and lower lung zones revealed that greater deterioration occurs in the upper zone. This was explained by the expansion of the disease to less affected regions of the lung. The group found no difference in the rate of decline of FEV1, Kco, and CT density.
Stolk et al43 found excellent reproducibility of the relative area below −910 HU and the 15th percentile density in 10 patients with AAT deficiency. The patients were scanned twice in a 2 week interval with the low dose technique (20 mA). The estimated CT dose per examination was 0.7 milliSievert (mSv). In a recent study39 we have studied the reproducibility of CT measurements in 25 patients with AAT deficiency and 25 current smokers with usual emphysema. CT was performed at three visits with an interval of 2 weeks. Low dose multi-detector CT scans were performed using tube currents of 8, 16 and 32 mA. Images were reconstructed using three different algorithms: low (soft), medium (detail) and high spatial resolution (bone). We found good reproducibility regardless of the type of emphysema, radiation dose, and reconstruction algorithm.39 The use of the low dose technique reduces the radiation dose to levels below the annual background radiation in most countries,3 and below the annual radiation dose of 1–10 mSv recommended in biomedical research studies of minor to intermediate risk.59
CONCLUSIONS
CT scanning is the most sensitive method of diagnosing emphysema, determining its subtype, and assessing its severity in vivo, and both visual and quantitative CT scanning is closely correlated with the pathological extent of emphysema. Nevertheless, CT scanning is insensitive in detecting the earliest lesions. Characteristic lesions are areas of low attenuation which are better visualised by HRCT scanning than by conventional CT scans. CT scanning has shown good correlation with measures of lung function and health status, and preliminary data suggest that CT is more sensitive than lung function tests in longitudinal studies. CT scanning may therefore replace lung function tests as the golden standard for assessing the response to known and novel treatments for AAT deficiency in clinical trials.
There are many important epidemiological questions regarding the natural history of emphysema in AAT deficiency. These questions can only be answered by CT scanning. However, consensus about a number of issues must first be reached, especially those concerning the standardisation and validation of the technique.
REFERENCES
Footnotes
-
This review received financial support from The Alpha-1 Foundation, The Danish Lung Association and the European Union (SPREAD project, www.lkeb.nl/spread.htm).