Article Text

Abstract
Background WHO recommends isoniazid preventive therapy (IPT) for young children in close contact with an infectious tuberculosis (TB) case. No models have examined the cost effectiveness of this recommendation.
Methods A decision analysis model was developed to estimate health and economic outcomes of five TB infection screening strategies in young household contacts. In the no-testing strategy, children received IPT based on age and reported exposure. Other strategies included testing for infection with a tuberculin skin test (TST), interferon γ release assay (IGRA) or IGRA after TST. Markov modelling included age-specific disease states and probabilities while considering risk of re-infection in a high-burden country.
Results Among the 0–2-year-old cohort, the no-testing strategy was most cost effective. The discounted societal cost of care per life year saved ranged from US$237 (no-testing) to US$538 (IGRA only testing). Among the 3–5-year-old cohort, strategies employing an IGRA after a negative TST were most effective, but were associated with significant incremental cost (incremental cost-effectiveness ratio >US$233 000), depending on the rate of Mycobacterium tuberculosis infection.
Conclusion Screening for M tuberculosis infection and provision of IPT in young children is a highly cost-effective intervention. Screening without testing for M tuberculosis infection is the most cost-effective strategy in 0–2-year-old children and the preferred strategy in 3–5-year-old children. Lack of testing capacity should therefore not be a barrier to IPT delivery. These findings highlight the cost effectiveness of contact tracing and IPT delivery in young children exposed to TB in high-burden countries.
- Tuberculosis
- Cost effectiveness
- paediatrics
- screening
- isoniazid preventive therapy
- paediatric lung disease
- paediatric physician
- asthma
- inhaler devices
Statistics from Altmetric.com
- Tuberculosis
- Cost effectiveness
- paediatrics
- screening
- isoniazid preventive therapy
- paediatric lung disease
- paediatric physician
- asthma
- inhaler devices
Key messages
What is the key question?
-
What is the most cost-effective strategy to prevent tuberculosis (TB) in child contacts in high-burden settings?
What is the bottom line?
-
Screening without testing for Mycobacterium tuberculosis infection is the most cost-effective strategy in 0–2-year-old children and the preferred strategy in 3–5-year-old children.
Why read on?
-
Although WHO recommends isoniazid preventive therapy for children younger than 5 years of age who are in close contact with an infectious TB case, no previous models have examined the cost effectiveness of this recommendation.
WHO estimates that 2 billion people are infected with Mycobacterium tuberculosis. This reservoir of infected people, together with ongoing exposure in areas with poor tuberculosis (TB) control, lead to 9 million new TB cases and 2 million deaths annually. Children carry 15% of the global disease burden, leading to approximately 1 million cases of childhood TB annually. Young children are at disproportionately high risk of primary disease progression and development of disseminated disease in the absence of isoniazid preventive therapy (IPT).1 Early and accurate identification of children infected with M tuberculosis could guide targeted delivery of IPT and improve its cost effectiveness while ultimately preventing TB disease in many children.
There is no gold standard for detecting M tuberculosis infection. The tuberculin skin test (TST) has limited sensitivity and specificity. The identification of genes in the M tuberculosis genome that are absent from Mycobacterium bovis bacillus Calmette-Guérin (BCG)2 and most non-tuberculous mycobacteria3 supported the development of more specific assays that quantify the in vitro production of interferon γ by T cells after stimulation with M tuberculosis-specific antigens. In children, the specificity of interferon γ release assays (IGRAs) for TB disease detection is estimated to be 91% for the ELISA-based QuantiFERON (QTF, Cellestis, Australia) assays and 94% for the enzyme-linked immunosorbent spot based T-SPOT.TB (Oxford Immunotec, Oxford, UK), compared with 88% for the TST.4 Estimates of test sensitivity for detection of TB disease in children are similar: 83% (QTF), 84% (T-SPOT.TB) and 84% (TST).4
Although a systematic review of primarily adult studies found IPT to reduce incident TB by 60%,5 a randomised control trial of IPT demonstrated 75% efficacy in non-compliant adults versus 93% efficacy in compliant adults.6 Limited paediatric data indicate that IPT efficacy is greater than 90% given good adherence,7 ,8 but consistently demonstrate low IPT usage rates in children from high-burden settings, resulting in missed opportunities to prevent TB.9–11 In South Africa, IPT uptake ranges from 21% in the routine healthcare setting11 to 73% in clinical research settings12; adherence is approximately 24%.12 Among South African children hospitalised for TB, missed opportunities for IPT occur in up to 64% of young children.13
WHO recommends IPT for children younger than 5 years of age who are in close contact with an infectious TB case.14 Despite longstanding guidelines recommending contact screening and IPT for these child contacts, no models have examined the cost effectiveness of these recommendations. Using probability and cost estimates derived from the existing literature, we developed a decision analysis model to estimate health and economic outcomes of five M tuberculosis infection screening strategies used in young, HIV-negative South African household contacts. Markov modelling was used to describe paediatric age-specific disease states and probabilities while considering a high annual risk of TB infection (ARI).
Methods
Study design
A decision analysis model was developed using TreeAge ProTM (TreeAge Software Inc, Williamstown, Massachusetts, USA) to examine the impact of household contact tracing with subsequent screening for M tuberculosis infection and provision of IPT in the context of a middle-income country with an exceptionally high ARI. We estimated the childhood costs and mortality of five screening strategies for M tuberculosis infection. All screening strategies initially evaluated children for TB disease. Subsequently, four screening strategies tested children without TB for M tuberculosis infection with TST, single IGRA, positive TST followed by IGRA to maximise specificity, or negative TST followed by IGRA to maximise sensitivity. Commercially available IGRAs were considered. One screening strategy did not test for M tuberculosis infection. Model outcomes were compared using incremental cost-effectiveness ratios (ICERs), which provide a measure of the additional cost per extra unit of effect for each option under comparison. In our model, ICERs measure the additional cost per life year saved (US$/LYS) for each of the strategies being compared. Cost-effectiveness analysis was prospectively undertaken from provider and societal perspectives. In the base case, costs and outcomes were discounted at the standard rate of 3%.15 The majority of model parameters and assumptions were derived from published data obtained in high-burden settings. Extensive evidence supports the assumption that isoniazid-related adverse events are negligible in children8 ,12 ,16–18 (table 1 and box 1).
Estimates of the probability of events in the model
Assumptions used in the model
-
When used as a confirmatory test following an accurate tuberculin skin test (TST), the interferon γ release assay (IGRA) is 100% sensitive and 100% specific.
-
Test properties do not vary by age.
-
The TST testing strategy requires two tuberculosis (TB) clinic visits. The IGRA and TST following IGRA testing strategies require two clinic visits and one outpatient laboratory visit to complete phlebotomy as IGRA testing is typically only available at peripheral laboratory settings.
-
Isoniazid preventive therapy (IPT) uptake and adherence do not vary across age groups.
-
The duration of protection offered by a 6-month course of IPT is limited to the initial exposure and for the duration of treatment only.
-
Following Mycobacterium tuberculosis infection and completion of IPT, children remain M tuberculosis infected.
-
Following the initial exposure, children cannot progress from the M tuberculosis infection state to active disease states unless they are re-infected.
-
Children with a history of household TB exposure have the same subsequent annual risk of infection as calculated by formal surveys in the setting.
-
Children can only progress to the TB death state from the pulmonary or disseminated TB states. The disseminated disease state includes TB meningitis and other forms of non-pulmonary TB.
-
Children have the same risk of disease progression following each subsequent TB exposure.
-
Isoniazid-related adverse events are negligible in children.8 ,12 ,16–18
-
The cost of IGRA testing assumes that specimens are processed in batches.
Model structure
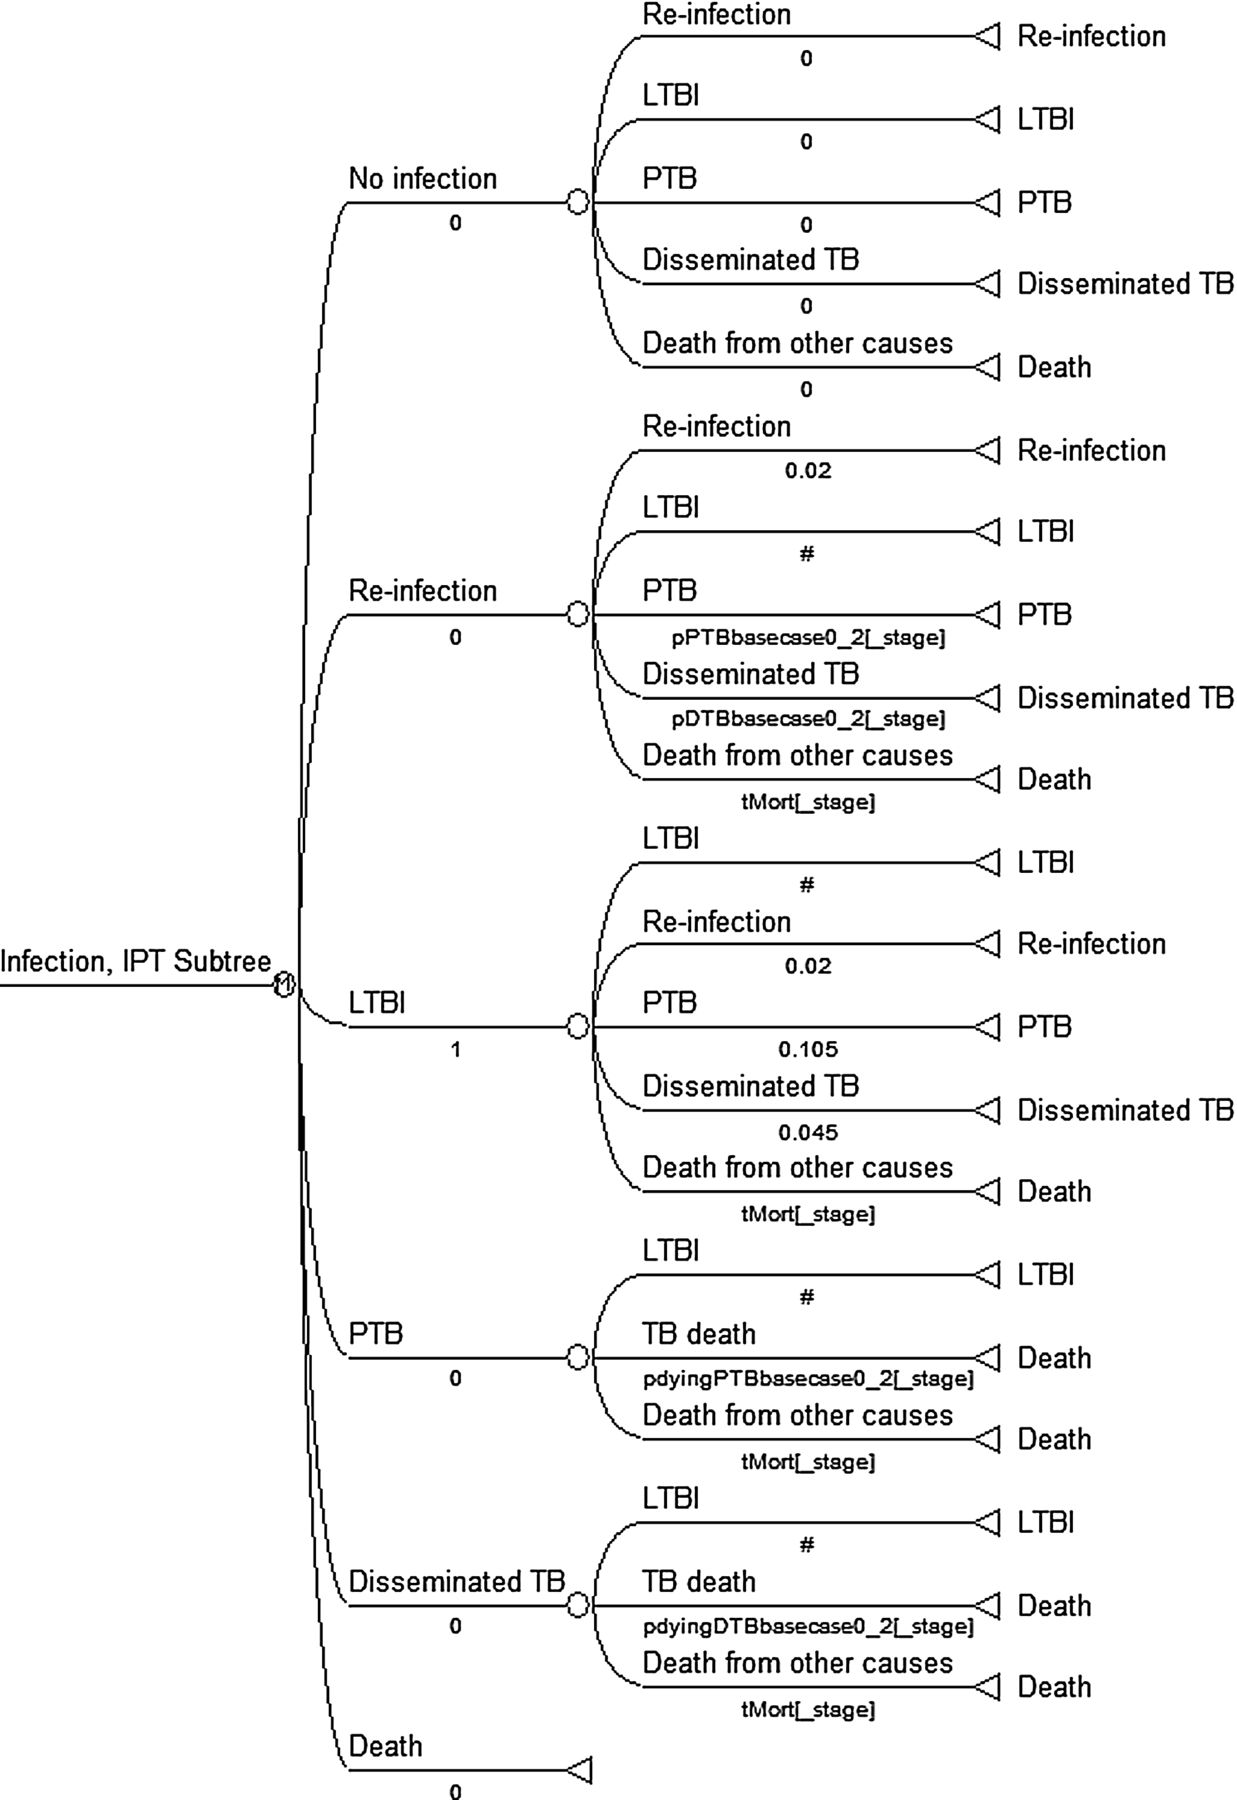
The model assumed that the routine TB control programme conducts contact tracing to identify children in recent household contact with an infectious (smear/culture-positive) case of TB. Identified children then participated in one of five M tuberculosis infection screening strategies (figure 1). For the four strategies that involved testing, we first modelled the probability of having a positive test of M tuberculosis infection followed by the probability of test accuracy. For children in whom M tuberculosis infection was detected, we modelled the probability of IPT uptake and adherence. For base-case children who proceeded through the no-testing strategy, we immediately modelled the probability of IPT uptake and adherence. Once children completed screening, Markov modelling considered IPT effectiveness, re-infection and subsequent disease, and mortality in children who did and did not receive IPT (figure 1). Risk of re-infection was based on ARI and supports the model to consider future risk of disease. Hence, our model simulates typical policy in a high-burden setting where IPT is only offered to children younger than 5 years of age and typical practice where children generally receive IPT once despite recurrent exposure.

Decision tree (excluding null branches and IPT decision nodes). For simplicity, we present a version of the decision tree in which we have excluded null pathway branches and sequential IPT decision nodes related to IPT referral, uptake and adherence. IGRA, interferon γ release assay; IPT, isoniazid preventive therapy; LTBI, latent tuberculosis infection; NPV, negative predictive value; PPV, positive predictive value; TST, tuberculin skin test.
Data
Characteristics of simulated children
The initial cohorts consisted of 10 000 simulated children in recent household contact with an infectious case of TB. Simulated children who did not have TB disease or HIV infection at the time of initial screening progressed through the model.14 Since rates of M tuberculosis infection and disease progression vary according to age,1 the model was run for two age cohorts: children 0–2 years or 3–5 years of age.
Transition probabilities
For all strategies, we first modelled the probability of M tuberculosis infection in children given documented household TB exposure while considering age19–21 (table 1). For the testing strategies, we then considered the presence of true M tuberculosis infection given a positive test (positive predictive values) and absence of M tuberculosis infection given a negative test (negative predictive value). These values were derived from robust estimates of sensitivity and specificity based on paediatric studies in countries of varying income.4 For children who progressed through screening strategies involving testing, only children with positive tests were eligible for IPT. In the no-testing strategy, all children were eligible for IPT.14 For all strategies, the model considered the probability of IPT referral (75%), uptake (75%) and adherence (24%).11 ,12 ,24
Markov modelling
Our Markov model included seven health states: no infection, initial infection, subsequent infection due to future exposures, pulmonary TB, disseminated TB, TB death and death from other causes. Initial health state probabilities were varied based on M tuberculosis infection and IPT completion rates. The subsequent transition between health states varied according to the child's ARI,30 age-adjusted risk of all-cause mortality after the perinatal period,31 and risk of disease progression in the absence of IPT1 ,13 ,20 ,28 ,32 (table 1). Our model therefore evaluates the impact of offering one course of IPT to children who survived the perinatal period, experienced household TB exposure, were identified through contact tracing, and had a high risk of re-exposure over 15 subsequent years. The model assumes that the protective effect of IPT is limited to the initial exposure and employs cycles of 6 months' duration simulating the length of IPT used in South Africa (figure 2).
Markov model: health states and possible transitions between states. Initial probabilities were varied to model the progression of three subgroups through the Markov models. Among children with LTBI who completed IPT, all children begin the Markov model in the LTBI state; subsequent transitional probabilities are adjusted to consider the protective efficacy of IPT. Among children with LTBI who do not complete IPT, all children begin the Markov model in the LTBI state; subsequent transitional probabilities reflect the natural history of TB disease. Among children without LTBI, 98% of children begin the Markov model in the no infection state and 2% begin the Markov model in the LTBI state, reflecting an annual risk of infection of 4. IPT, isoniazid preventive therapy; LTBI, latent tuberculosis infection; TB, tuberculosis.
Costs
An ingredients-based costing methodology was used in which quantities of resources were multiplied by their respective unit costs to obtain total costs. We considered provider costs associated with screening to exclude active TB (tests for infection, chest radiography and culture), HIV testing, outpatient and inpatient visits, laboratory tests, procedures in children with pulmonary and disseminated TB, IPT and TB drugs. Although inconsistent with current WHO guidelines, routine chest radiography screening for all contacts was included in our model as this is recommended by many national TB control programmes, including that of South Africa (table 2). We did not include costs of IPT adverse reactions because these are rare in children.8 ,12 ,16–18 Since they are not available in the South African public health sector, test costs were based on realistic manufacturer's pricing (Serum Statens Institute, Copenhagen, Denmark for TST; Oxford Immunotec for T-SPOT.TB) and pricing from the Foundation for Innovative New Diagnostics (Geneva, Switzerland for QTF). Unit costs for testing included the costs of tests and labour provided by the South African National Health Laboratory Services (NHLS). Cape Town City Health provided unit costs of IPT and other TB drugs. Laboratory costs for TB testing were obtained from NHLS. Unit costs for inpatient and outpatient visits and patient costs were derived from previously published data.33 These cost data were adjusted for length of visit, inflated to 2009 values and then converted to US$ at the average 2009 exchange rate. Costs to the patient included time travelling and waiting to receive care, and transport costs.
Cost of screening and treatment per patient (2009 US$)
Sensitivity analysis
We performed one-way sensitivity analyses, varying key parameters over a range of reasonable values to evaluate the impact of data uncertainties and determine the robustness of conclusions. For each IGRA within each age cohort, key parameters included test property estimates, test properties stratified by World Bank income status, and latent TB infection (LTBI) prevalence (table 1). Sensitivity analysis of test properties compared model outcomes when using the lowest and highest estimates of sensitivity and specificity for each test while holding the performance of the other tests constant. Sensitivity analysis of test properties stratified by World Bank income status, serving as a surrogate measure of ARI,4 simultaneously considered the lowest or highest estimates of sensitivity and specificity of all tests and assessed model generalisability.
Results
Base-case scenarios
Cost effectiveness was measured as the cost of care included in the model (ie, all diagnostic tests and appropriate treatment) per LYS. For the 0–2-year-old cohort, the discounted societal cost of care per LYS (ie, the cost effectiveness) was US$237 for no testing, US$369 for TST, US$411 for QFT after positive TST, US$439 for QFT after negative TST, and US$495 for QFT only. Discounted LYS per child screened over 15 years varied among the five screening strategies considered in the QFT model and ranged from 9.51 (QFT after positive TST) to 10.43 (no testing); undiscounted LYS were slightly higher (11.88–13.05) (table 3). A strategy was considered dominant if it cost less but generated a greater effect than all other strategies. For example, the no-testing strategy saved more life years and cost less than all other strategies from the societal and provider perspective. Hence, the no-testing strategy dominated all other strategies. The results obtained using properties of the QFT in the 3–5-year-old cohort had a similar rank order and slightly lower costs per LYS (US$140–358/LYS). In this older cohort, the QFT after negative TST strategy saved the most life years, but was associated with an ICER of $233 516 compared with the no-testing strategy (table 3).
Costs, life years saved and incremental cost-effectiveness ratios associated with screening strategies in the base-case scenario
In the 0–2-year-old cohort, discounted LYS per child screened again varied among screening strategies considered in the T-SPOT.TB model and was nearly identical to the QFT analysis, ranging from 9.51 (T-SPOT.TB-after positive TST) to 10.45 (no testing). The discounted societal cost of care per LYS was slightly higher than the QFT model. Results in the 3–5-year-old cohort had a similar rank order and slightly lower costs than the younger cohort (US$140–375/LYS) when considering the societal perspective. Similar to the QFT model, the T-SPOT.TB after negative TST strategy saved slightly more lives than the no-testing strategy (ICER $254 243). When considering a provider perspective in the older cohort, the rank order changes because the T-SPOT.TB after negative TST strategy became more costly than the single T-SPOT.TB strategy (table 3).
Sensitivity analysis
In the younger cohort, the IGRA after negative TST strategy was the most effective strategy when low estimates of TST sensitivity were modelled; ICERs ranged from US$145 606 (T-SPOT.TB model) to US$153 206 (QFT model) compared with the no-testing strategy. In the older cohort, the no-testing strategy dominated the IGRA after negative TST strategy when high estimates of TST sensitivity were modelled and ICERs of the IGRA after negative TST strategy increased as estimates of TST specificity decreased (table 4).
The impact of alternative assumptions for test properties and latent tuberculosis infection rates (societal perspective)
As the rate of LTBI increased, the IGRA after negative TST strategy became more effective than the no-testing strategy in both age cohorts; ICERs ranged from US$18 381 to 75 298 compared with the no-testing strategy. At the lower estimates of LTBI, the no-testing strategy dominated all other strategies (table 4).
Using estimates of test performance in low and middle income countries produced cost-effectiveness rank orders identical to the base-case models. Costs were similar to the base model; US$237–554/LYS (0–2-year-old cohort) versus US$140–625/LYS (3–5-year-old cohort).
Discussion
IPT substantially decreases rates of TB progression, morbidity and mortality among close contacts of infectious TB cases.5 We compare the cost effectiveness of five M tuberculosis infection screening strategies in child household TB contacts identified through contact tracing. Simulating WHO guidelines,14 we include a unique no-testing strategy in which IPT is offered to child contacts based on age. Our model includes realistically low estimates of IPT usage9–12 ,24 ,34 and purposively measures the impact of offering IPT once over a period of 15 years to ensure that model outcomes are relevant to TB high-burden settings.
In contrast to published adult models,35–37 our model includes two dual testing methods to assess strategies maximising test sensitivity (IGRA after negative TST) and specificity (IGRA after positive TST). Assessment of both strategies is important because young children might benefit from confirmatory IGRA testing to maximise specificity in the presence of BCG vaccination and from confirmatory IGRA testing to maximise sensitivity in recently exposed child contacts.
Outcomes of our base case models varied between age cohorts considered. In the 0–2-year-old cohort, the no-testing strategy saved the most life years and cost less than the testing strategies highlighting the cost effectiveness of offering IPT to all young household contacts. In the 3–5-year-old cohort, the IGRA after negative TST strategy saved slightly more lives than the no-testing strategy. Although this strategy avoids overtreatment of uninfected children, the cost of saving one additional life year was at least US$233 000. This strategy further requires public health programmes to have more operational capacity than the no-testing strategy. The ICERs of the IGRA after negative TST strategy notably decreased by up to 30% when considering the provider perspective only, highlighting the substantial investment required by families and further limiting the strategies' feasibility. Hence, in most TB high-burden settings, the preferred screening strategy in TB-exposed children from 0 to 5 years of age is likely the no-testing strategy.
There is ongoing discussion regarding the usefulness of IGRAs in settings with high ARI.38 As rates of LTBI increase, the IGRA after negative TST strategy becomes increasingly effective and eventually saves more lives than the no-testing strategy in all models. This change in dominance patterns reflects gains in LYS by maximising sensitivity of screening. As rates of LTBI increase, the ICER of the IGRA after negative TST strategy also decreases, making this a more appealing strategy. In our model that considered LTBI rates as high as 62%, US$18 000 was the least expensive ICER associated with the IGRA after negative TST strategy. However, an ICER of this magnitude may still be considered too high to justify use of this more effective strategy in many settings.
All of our models were sensitive to changes in IGRA sensitivity and specificity while holding TST performance constant. Among 0–2 year olds, as TST sensitivity decreased, the IGRA after negative TST strategy became more effective but remained considerably more costly than the no-testing strategy (ICERs ranged from US$146 000 to 153 000). Similarly, in the 3–5-year-old cohort, as TST sensitivity decreased, the IGRA after negative TST strategy became more attractive with ICERs of US$42 000–45 000. Nevertheless, these ICERs remain excessive, likely precluding use of the IGRA after negative TST strategy in TB high-burden areas.
Our model has limitations. Test performance estimates were derived from studies examining test accuracy for the identification of TB disease.4 Studies using exposure as a surrogate measure of infection suggest that IGRAs may be more sensitive for the detection of M tuberculosis infection compared with the TST.4 We also assumed that IPT usage was similar across strategies; however, testing for infection may improve IPT usage. Both of these limitations may lead our model to underestimate the advantages of IGRA testing strategies. Since our model incorporated the high 4% ARI present in the study setting, over 60% of our cohort experienced re-infection during the 15-year period modelled. A portion of these children developed subsequent TB disease and died without the benefit of a second course of IPT. Our model clearly underestimates the impact of an ideal contact tracing programme offering IPT following every TB exposure.
TB control programmes are challenged to appropriately allocate funds to support TB prevention and treatment. Similar to adult models,39–41 we have demonstrated the cost effectiveness of IPT conducted during contact tracing. Adult models have further illustrated limitations in cost effectiveness due to poor uptake and adherence.40 ,41 Despite the realistically low IPT usage and recurrent TB exposure included in our model, the societal cost of care per LYS ranged between US$140 and 538 depending on the screening strategy and cohort age. The WHO Commission on Macroeconomics and Health considers an intervention to be cost effective if it does not exceed three times the gross domestic product (GDP) of a nation.42 South Africa's GDP per capita in 2009 was US$5724.43 Our model therefore provides strong support for the use of contact tracing, screening for M tuberculosis infection and IPT in young children in South Africa and in other middle and low income countries. Our model illustrates that screening without testing for M tuberculosis infection is the most cost-effective strategy in 0–2-year-old children and the preferred strategy in 3–5-year-old children. Lack of testing capacity should therefore not be a barrier to IPT delivery.
Conclusions
Our realistic model illustrates that blanket IPT programmes typical of TB high-burden settings are cost effective despite well recognised deficiencies, including low rates of IPT usage and missed opportunities to provide IPT for serial exposures. The impact and cost effectiveness of these programmes could surely be enhanced by raising IPT uptake and adherence, and decreasing missed opportunities to provide IPT. Similar to recent WHO recommendations in HIV-infected individuals,44 our findings highlight the need for intensified contact tracing and improved IPT delivery to all TB-exposed children living in TB high-burden settings.
Acknowledgments
The authors wish to thank personnel from Cape Town City Health and the South African National Health Laboratory Services for provision of costing data.
References
Footnotes
-
Funding This project was supported by funding from the Thrasher Research Fund. AM received salary support from the US Department of State to serve as a Senior Fulbright Scholar to South Africa during the completion of this analysis. Funding sources played no role in project implementation, analysis or reporting.
-
Competing interests None.
-
Provenance and peer review Not commissioned; externally peer reviewed.