Article Text

Abstract
Background Severe asthma is a heterogeneous condition. Airway remodelling is a feature of severe asthma and can be determined by the assessment of high-resolution computed tomography (HRCT) scans. The aim of this study was to assess whether airway remodelling is restricted to specific subphenotypes of severe asthma.
Methods A retrospective analysis was performed of HRCT scans from subjects who had attended a single-centre severe asthma clinic between 2003 and 2008. The right upper lobe apical segmental bronchus (RB1) dimensions were measured and the clinical and sputum inflammatory characteristics associated with RB1 geometry were assessed by univariate and multivariate regression analyses. Longitudinal sputum data were available and were described as area under the time curve (AUC). Comparisons were made in RB1 geometry across subjects in four subphenotypes determined by cluster analysis, smokers and non-smokers, and subjects with and without persistent airflow obstruction.
Results Ninety-nine subjects with severe asthma and 16 healthy controls were recruited. In the subjects with severe asthma the RB1 percentage wall area (%WA) was increased (p=0.009) and lumen area (LA)/body surface area (BSA) was decreased (p=0.008) compared with controls but was not different across the four subphenotypes. Airway geometry was not different between smokers and non-smokers and RB1 %WA was increased in those with persistent airflow obstruction. RB1 %WA in severe asthma was best associated with airflow limitation and persistent neutrophilic airway inflammation (model R2=0.27, p=0.001).
Conclusions Airway remodelling of proximal airways occurs in severe asthma and is associated with impaired lung function and neutrophilic airway inflammation.
- Severe asthma
- airway remodelling
- computed tomography
- airway inflammation
- quantitative analysis
- asthma phenotypes
- cluster analysis
- imaging/CT MRI etc
This is an open-access article distributed under the terms of the Creative Commons Attribution Non-commercial License, which permits use, distribution, and reproduction in any medium, provided the original work is properly cited, the use is non commercial and is otherwise in compliance with the license. See: http://creativecommons.org/licenses/by-nc/2.0/ and http://creativecommons.org/licenses/by-nc/2.0/legalcode.
Statistics from Altmetric.com
- Severe asthma
- airway remodelling
- computed tomography
- airway inflammation
- quantitative analysis
- asthma phenotypes
- cluster analysis
- imaging/CT MRI etc
Introduction
Asthma, a common complex inflammatory disorder, affects about 5% of adults in the general population, of which approximately 5–10% suffer from severe asthma.1 This severe asthma group is important as these patients suffer severe morbidity and consume a disproportionately high amount of healthcare resources.2 Airway remodelling, characterised by changes such as increase in airway smooth muscle mass due to hyperplastic and hypertrophic changes, mucous gland hyperplasia, thickening of reticular basement membrane, dysregulated extracellular matrix deposition and increased vasculature, is important and considered fundamental to the chronicity of the asthma disease complex.3
Airway wall changes in severe asthma are common and impossible to predict without imaging.4 High-resolution computed tomography (HRCT) has emerged as a repeatable and accurate tool for non-invasive quantitative assessment of proximal airway structural changes in patients with asthma.5–8 Thickening of the right upper lobe apical segmental bronchus (RB1) has been shown to correlate with airflow limitation,6 airway hyper-responsiveness8 and air trapping on expiratory CT scans9 in asthma. Remodelling of RB1 has also been shown to correlate well with non-RB1 proximal airways in severe asthma.6 8
The heterogeneity of asthma is highlighted by different phenotypes identified using cluster analysis.10 Dividing a multidimensional disease complex such as asthma into distinct phenotypes may help target treatment more effectively, as exemplified by the success of eosinophilic airway inflammation-directed corticosteroid and anti-interleukin 5 (IL-5) treatment7 11 12 to prevent asthma exacerbations. A critical gap in improving our understanding of severe asthma phenotypes is identification of remodelling patterns in various subtypes of severe asthma and the ability to relate airway structure to important clinical outcomes.
We hypothesised that airway remodelling assessed by CT is different between severe asthma subphenotypes. Our study aims were (1) to compare CT-derived dimensions of RB1 between severe asthma subphenotypes determined by cluster analysis and (2) to identify clinical features relating to patients' demographic profiles, symptoms, pulmonary functions or airway inflammation that are best associated with the geometry of RB1.
Methods
Subjects
We performed a single-centre retrospective cross-sectional study based on the ‘difficult asthma’ clinic at Glenfield Hospital, Leicester, UK. Of 364 patients attending the clinic between April 2003 and April 2008, 173 had HRCT scans and were considered for inclusion in the study. The clinical indications for HRCT scanning were determined by the attending physician as described previously.4 Pregnant and lactating women were not subjected to CT scanning. Subjects attending the clinic undergo an extensive re-evaluation as part of their routine clinical care, including an extensive history, skin prick tests for common aeroallergens, spirometry, methacholine challenge tests, sputum induction13 and asthma control questionnaire.14 The diagnosis of asthma is confirmed by a respiratory physician based on history and one or more of the following objective criteria: maximum diurnal peak expiratory flow variability >20% over a 2-week period, significant bronchodilator reversibility defined as an increase in forced expiratory volume in 1 s (FEV1) >200 ml post-bronchodilator or a concentration of methacholine provoking a fall in FEV1 of <8 mg/ml. Severe asthma was defined in accordance with the American Thoracic Society workshop on refractory asthma.15 The non-asthmatic controls were referred to our centre with symptoms that were transient and resolved spontaneously on follow-up. They were all non-smokers (never or ex-smokers with a smoking history <10 pack-years) and had normal spirometry and CT scans.
Informed consent for clinical characterisation and CT scanning was obtained from all subjects and the study was approved by the Leicestershire, Northamptonshire and Rutland research ethics committee.
Cross-sectional imaging
HRCT was performed using a Siemens Sensation 16 scanner. Scans were acquired using a standard HRCT protocol (sequential scanning at 10 mm increments with 1 mm collimation) from the apex of the lung to the diaphragm. Patients were scanned in the supine position at maximal inspiration (adequate breath holding rehearsed prior to scan) with their arms held over their heads. Images were reconstructed using a high spatial frequency algorithm through a 512×512 matrix with a small field of view targeted to image only pulmonary areas. Scanning time ranged from 30 s to 45 s with a voltage of 120 kVp and peak effective tube current (dose modulation based on size and attenuation profile of the region scanned used to minimise radiation dose) of 140 mAs (range 65–140). Long-acting bronchodilator therapy was not withheld prior to the HRCT scan.
Quantitative airway analysis
An automated program Emphylyx-J V 1.00.0116 using the full width at half-maximum (FWHM) technique was used to determine the airway cross-sectional geometry. Image data were transferred from the CT workstation to a personal computer in DICOM 3.0 format. After identifying the RB1, the operator placed a seed point in the airway lumen from which 64–128 rays were cast across the airway wall. The boundaries of the wall were defined by the mid point of the profile of CT numbers across each ray. Lumen area (LA), wall area (WA) and maximum and minimum airway diameter were measured. A high spatial frequency algorithm was used for reconstruction of images as it results in reduced blurring and, as shown by phantom studies,17 is associated with reduced errors in airway wall estimation using the FWHM method.
We used a previously reported airway phantom, modelling the RB1 which had been validated against stereomicroscopy and Micro-CT as gold standards for cross-sectional geometry.8 Correction equations for both size-dependent error using the FWHM method and oblique orientation of the airways were applied as previously described.7 LA and WA were corrected for body surface area (BSA). Total area (TA) and percentage WA (%WA) were derived from LA and WA (TA=LA+WA; %WA=WA/TA×100).
The following aspects of the analysis are described in the online supplement: (1) interobserver variability for airway dimensions; (2) assessment of variability in measurement of RB1 across its length; and (3) assessment of the right B10 bronchus (RB10) to further validate findings from RB1.
Data analysis
Data analysis was performed in three steps. First, a priori analysis was performed in patients with severe asthma dichotomised into clinically relevant groups based on (1) the presence or absence of chronic persistent airflow obstruction (FEV1 <70% of predicted value and FEV1/forced vital capacity (FVC) <70%)18; (2) smoking history (smokers defined as subjects with ≥10 pack-years smoking history); (3) gender; and (4) eosinophilic airway inflammation (non-eosinophilic severe asthma (NEA) was defined as subjects with asthma who had a sputum eosinophil count of ≤1.9%19 on at least two occasions with no previous evidence of significant eosinophilia >1.9%, eosinophilic asthma (EA) was defined as subjects with asthma and a sputum eosinophil count of ≥3%11 on at least two occasions; 30 and 16 patients qualified as EA and NEA, respectively). Unbiased phenotyping of subjects with severe asthma was then undertaken using factor and cluster analysis techniques as described previously.10 Briefly, a two-step cluster analysis methodology was employed using representative variables identified on factor analysis.10 The number of likely clusters was estimated using hierarchical cluster analysis. This estimate was prespecified in a k-means cluster analysis that was used as the principal clustering technique. Finally, univariate and multiple regression analysis was performed to explore the structure and function relationship in severe asthma.
Statistical analysis
Statistical analysis was performed using GraphPad Prism Version 5.00 for Windows (GraphPad Software, San Diego, California USA) and standard multiple regression using SPSS for Windows Release 16.0.1.2008 (SPSS Inc, Chicago, Illinois, USA). Parametric data were expressed as mean (SEM) and non-parametric data were described as median (interquartile range, IQR). χ2 tests were used for categorical data analysis. The unpaired t test was used to compare clinical characteristics and RB1 dimensions of dichotomised subjects with severe asthma and the Mann-Whitney U test was used to compare sputum characteristics of the dichotomised severe asthma groups. One-way analysis of variance with Tukey correction (clinical characteristics and RB1 dimensions) and Kruskal-Wallis test with Dunn's intergroup comparison (sputum characteristics) was used to compare severe asthma subphenotypes determined by cluster analysis. One-way analysis of variance with Tukey correction was used to assess the effect of varying tube current–time product (mAs) on airway phantom dimensions. Two-way analysis of variance was used to assess variability in the dimension of RB1 across its length at three levels and between subjects.
Pearson correlation coefficient was used to determine the relationship between RB1 dimensions (LA/BSA, WA/BSA, TA/BSA and %WA) and clinical indices. The relationship between RB1 %WA and clinical indices was further explored using standard multiple regression. A p value of <0.05 was taken as statistically significant.
Results
Patients with severe asthma, measurable RB1 and sufficient baseline data to perform cluster analysis as described previously10 (n=99) were included in the study. Seventy-three of the patients included in this study had also participated in a previous study.4 Longitudinal sputum data obtained at scheduled clinic visits were available for 91% of subjects (>2 sputum samples over period of at least 3 months; median (IQR) number of samples 5 (3–9) and duration 22 (11–38) months) and were described as area under the time curve expressed as the differential cell count/unit of time (AUC%).
Patients with severe asthma dichotomised into clinically relevant groups
In the severe asthma group as a whole we found that mean (SEM) RB1 %WA was significantly greater in subjects with persistent airflow obstruction than in those without (73.8 (1.5) vs 69.0 (0.7), p=0.006). There was no significant difference in RB1 %WA between smokers and non-smokers (71.9 (1.5) vs 69.7 (0.8), p=0.2). Women had a greater RB1 LA/BSA (mm2/m2) (5.8 (0.4) vs 4.8 (0.3), p=0.05) and RB1 WA/BSA (mm2/m2) (13.0 (0.6) vs 11.2 (0.5), p=0.03) than men, but no significant difference was found in RB1 %WA. There was no difference in RB1 %WA between patients with EA (n=30) and those with NEA (n=16) (70.5 (1.2)% vs 70.6 (1.3)%, p=0.2). Further details are shown in tables S2, S3, S4 and S5 in the online supplement.
Unbiased phenotyping of subjects with severe asthma using cluster analysis
The clinical characteristics of the four severe asthma subphenotypes (groups A–D) determined by cluster analysis and controls are shown in table 1. No significant differences were found between groups with regard to age. The severe asthma subphenotypes were similar with regard to FEV1% predicted, FEV1/FVC ratio and treatment with long-acting β agonists and inhaled or oral corticosteroids. Group A represents patients with severe asthma with a concordant asthma control score and eosinophilic inflammation with a significantly greater bronchodilator response. Group B consisted of patients with severe asthma who were predominantly women with high body mass index and evidence of a high asthma control score but very little eosinophilic airway inflammation. Groups C and D both had a discordant asthma control score and eosinophilic inflammation, with Group C predominantly having a high asthma control score and Group D predominantly having eosinophilic airway inflammation. The clinical characteristics of the 99 subjects in this study were not significantly different from those of the remaining 74 subjects with severe asthma who underwent HRCT scanning but were not included (data not shown).
Clinical and sputum characteristics of patient groups and clinical characteristics of control subjects
The mean (SEM) LA/BSA (mm2/m2) of RB1 was significantly smaller in all severe asthma subphenotypes than in the control group (table 2 and figure 1) while the mean (SEM) RB1 %WA was significantly increased in all severe asthma subphenotypes compared with the control group (table 2 and figure 2). There was no difference in wall area between subphenotypes. RB10 results were similar to those of RB1 (see online supplement).
Dimensions of right upper lobe apical segmental bronchus (RB1) in patient groups and control subjects

Comparison of right upper lobe apical segmental bronchus (RB1) lumen area/body surface area (LA/BSA, mm2/m2) of four severe asthma phenotypes and control subjects (p=0.008, ANOVA; *p<0.05, Tukey test to compare all pairs of columns). Group A, patients with severe asthma with a concordant asthma control score and eosinophilic inflammation with a significantly greater bronchodilator response; group B, patients with severe asthma who were predominantly women with high body mass index and evidence of a high asthma control score but very little eosinophilic airway inflammation; group C, patients with severe asthma with a predominantly high asthma control score and very little eosinophilic airway inflammation; group D, patients with severe asthma with predominantly eosinophilic airway inflammation and significantly low asthma control score.
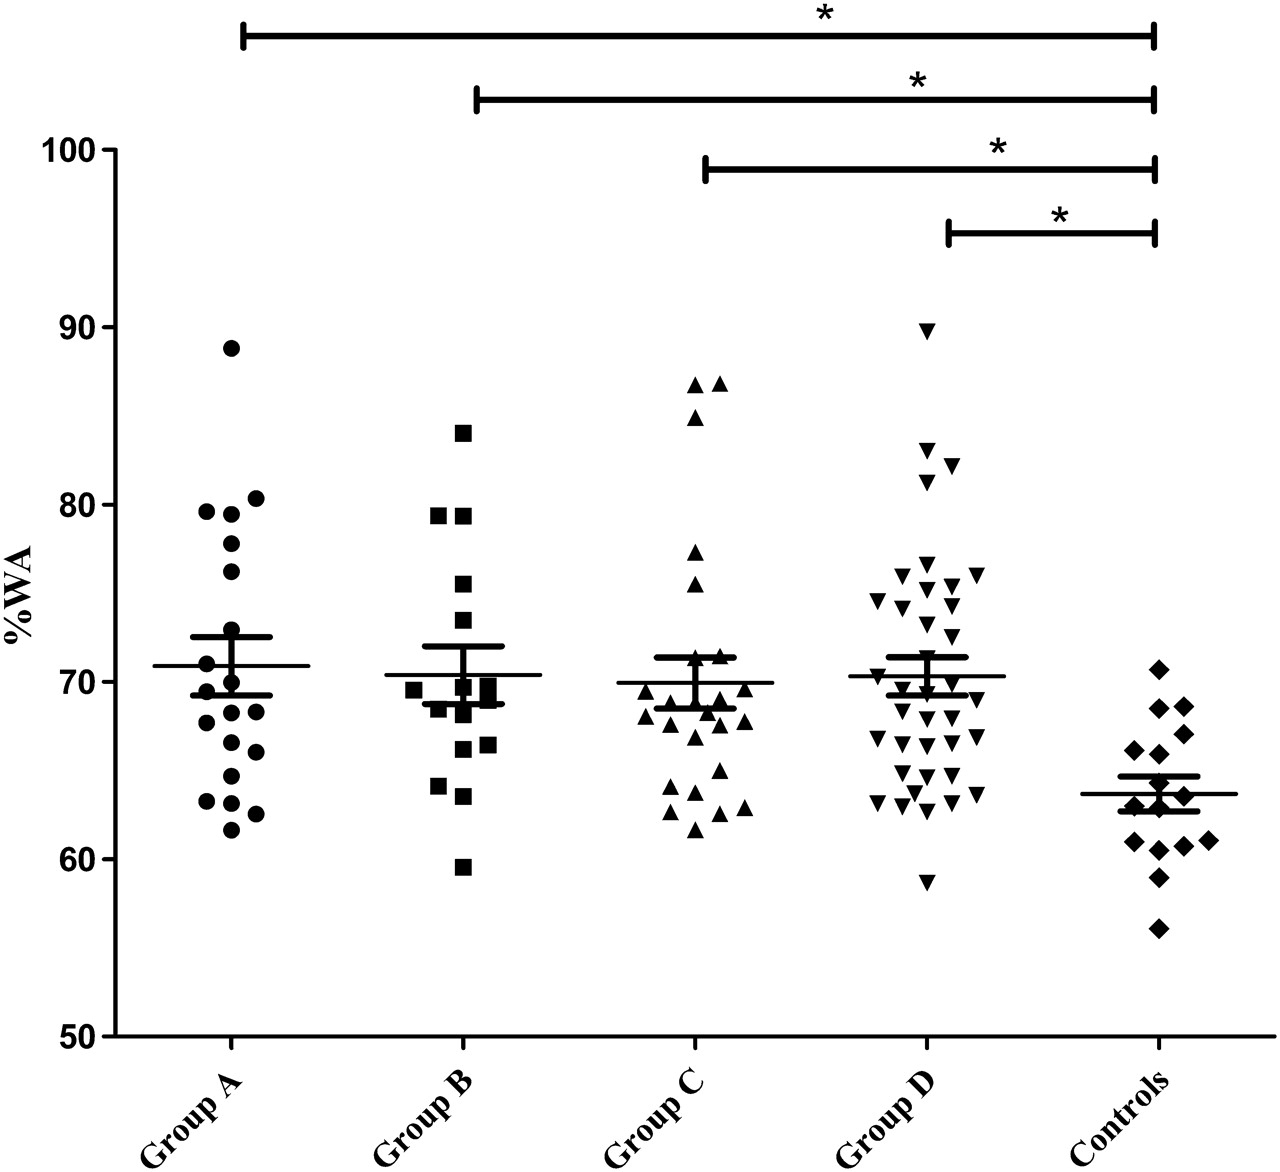
Comparison of right upper lobe apical segmental bronchus (RB1) percentage wall area (%WA) of four severe asthma phenotypes and control subjects (p=0.009, ANOVA; *p<0.05, Tukey test to compare all pairs of columns). Group A, patients with severe asthma with a concordant asthma control score and eosinophilic inflammation with a significantly greater bronchodilator response; group B, patients with severe asthma who were predominantly women with high body mass index and evidence of a high asthma control score but very little eosinophilic airway inflammation; group C, patients with severe asthma with a predominantly high asthma control score and very little eosinophilic airway inflammation; group D, patients with severe asthma with predominantly eosinophilic airway inflammation and significantly low asthma control score.
Univariate and multiple regression analysis to explore structure and function relationship in severe asthma
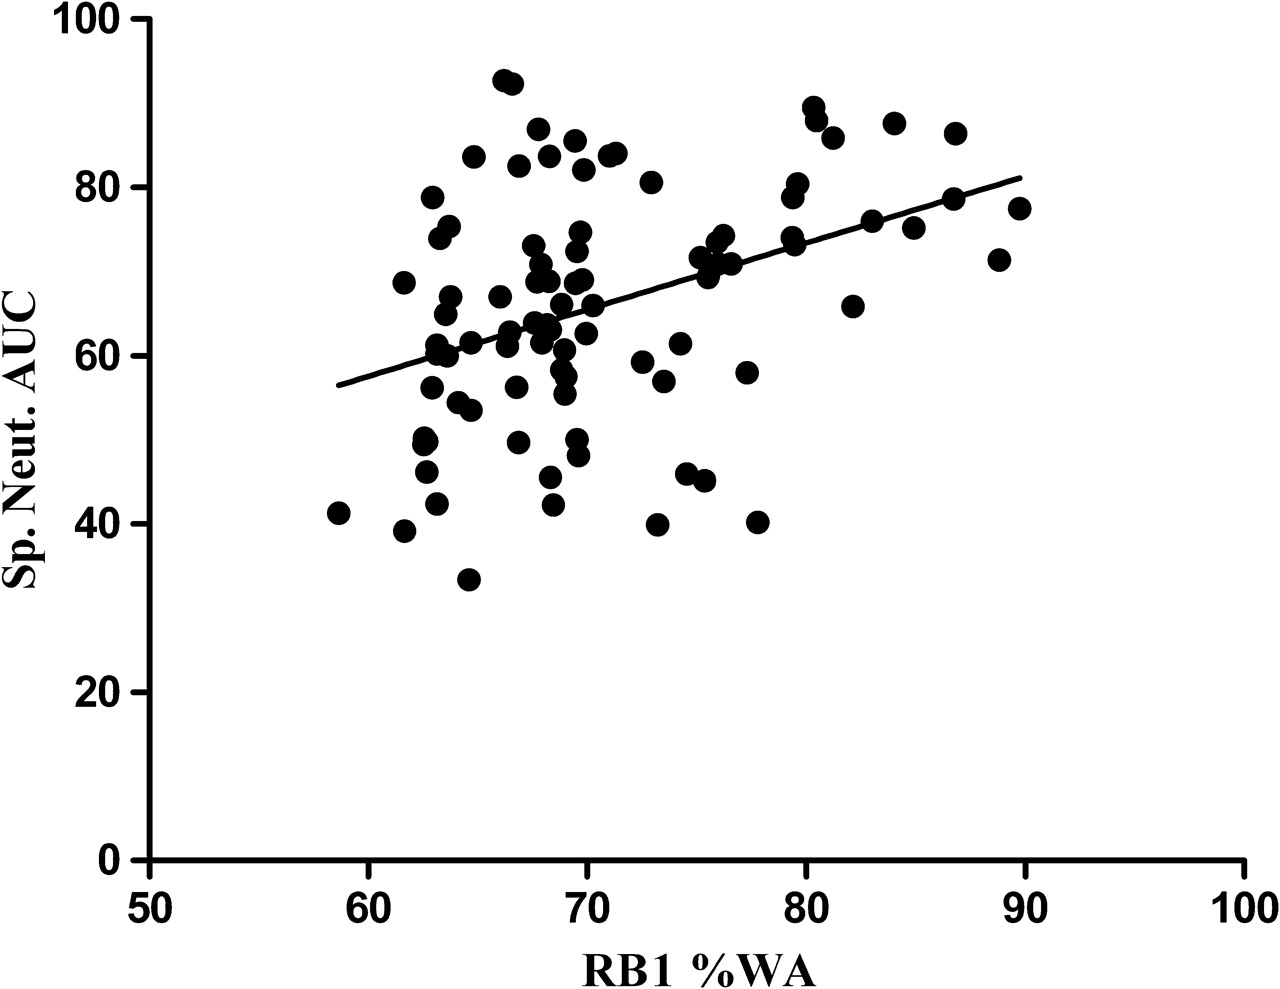
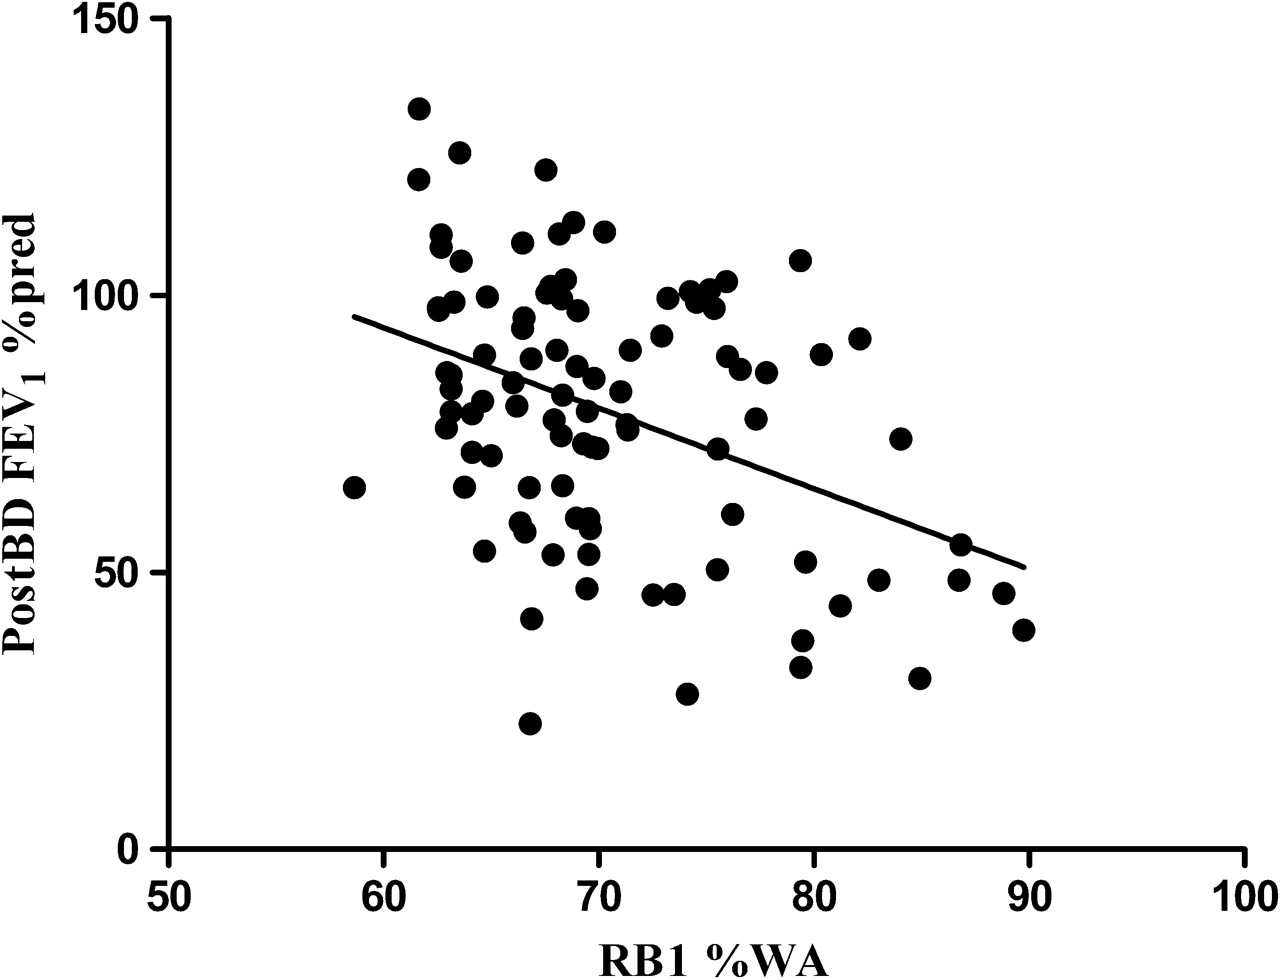
Univariate analysis of the relationship between RB1 dimensions and clinical indices is shown in table 3 and figures 3 and 4. RB1 %WA correlated significantly with disease duration, post-bronchodilator FEV1% predicted, post-bronchodilator FEV1/FVC, Juniper Asthma Control Score (JACS) and sputum neutrophil AUC (%). Standard multiple regression was performed using the ‘Enter’ method between RB1 %WA as the dependent variable and disease duration, post-bronchodilator FEV1% predicted, sputum neutrophil AUC and modified JACS (6-point score without FEV1% predicted)20 as the independent variables, selected based on the univariate analysis. With the use of a p<0.001 criterion for Mahalanobis distance, no outliers among the cases were found. No multicollinearity or singularity was detected. Normality, linearity, homoscedasticity and independence of residuals were confirmed. Table 4 shows the unstandardised correlation coefficients (B), the standardised correlation coefficient (β), the semipartial correlations R2 and adjusted R2.
Univariate analysis of relationship between RB1 dimensions and clinical indices

Correlation between right upper lobe apical segmental bronchus (RB1) percentage wall area (%WA) and postbronchodilator (postBD) forced expiratory volume in 1 s (FEV1)% predicted in patients with severe asthma (r=0.41, p<0.0001).
Correlation between right upper lobe apical segmental bronchus (RB1) percentage wall area (%WA) and sputum neutrophil area under the curve (AUC, %) in patients with severe asthma (r=0.36, p<0.005).
Standard multiple regression
Post-bronchodilator FEV1% predicted and sputum neutrophil AUC (%) made a statistically significant contribution to the regression model for prediction of RB1 %WA, with the former making the strongest unique contribution to explaining the dependent variable as indicated by standardised coefficients.
Discussion
We found that, in patients with severe asthma, RB1—a proximal third-generation airway—was remodelled with luminal narrowing and increased %WA. The degree of airway remodelling was similar across clinical subphenotypes determined by cluster analysis and was independent of smoking status. Importantly, we confirmed that %WA was associated with lung function impairment and was significantly greater in patients with severe asthma with persistent airflow obstruction than in those without. For the first time we have shown that %WA is associated with the burden of neutrophilic airway inflammation over time, suggesting that this component of the airway inflammatory profile may be important in airway remodelling.
Airway remodelling is an established feature of asthma, particularly in those with severe disease. Our findings confirm that airway wall thickening and reduced luminal patency are features of severe asthma. This altered geometry in patients with severe asthma compared with healthy controls may be important in determining physiological characteristics such as airway hyper-responsiveness and airflow obstruction. However, there is increasing recognition that severe asthma is a heterogeneous condition and the relationship between clinical, physiological and inflammatory features of disease and remodelling is poorly understood.
Whether subjects with airway remodelling represent a distinct asthma subphenotype is unknown. Cluster analysis has been applied to determine asthma subphenotypes.10 21 Using a combination of factor and cluster analysis, we have previously reported four novel subphenotypes in severe asthma.10 Here we used the same approach to categorise our patients with severe asthma into distinct groups. The four subphenotypes identified had very similar characteristics to our earlier report. Importantly, airway remodelling was a feature of all four subphenotypes and there were no differences between them. Bronchoconstriction may cause airway luminal narrowing without change in wall area.22 We are confident that the RB1 luminal narrowing in the subjects with severe asthma in this study does not simply reflect reversible bronchoconstriction as a consequence of airway smooth muscle shortening, as all subjects in our study were on long-acting β agonists and these were not withheld before undertaking the CT scan.
In addition to this unbiased approach to phenotyping, we prespecified criteria to stratify our subjects into those with or without persistent airflow obstruction, smoking status and the presence or absence of sputum eosinophilia. Those with persistent airflow limitation had the most marked CT evidence of remodelling whereas altered airway geometry was independent of smoking status. Our observation that RB1 %WA was associated with the post-bronchodilator FEV1% predicted is in keeping with previous reports in asthma5 6 and chronic obstructive pulmonary disease.23 In addition, we have previously identified that, in asthma, RB1 %WA is associated with airway hyper-responsiveness.8 Taken together, these findings support the view that the changes in airway geometry are functionally important.
To date there has been a paucity of studies exploring the associations between remodelling assessed by CT and airway inflammation. Sputum analysis provides a non-invasive safe tool to assess airway inflammation and has been widely applied in the study of severe asthma. Indeed, the identification of eosinophilic airway inflammation in severe asthma has evolved as a powerful diagnostic tool to predict the response to corticosteroids24 and to prevent exacerbations.11 12 In addition to eosinophilic airway inflammation, the existence of a distinct subgroup with neutrophilic airway inflammation in severe25 as well as mild-to-moderate26 asthma is well recognised. Both eosinophilic27 28 and neutrophilic29 inflammation have been implicated in the development of persistent airflow obstruction. ten Brinke et al28 showed that the only independent factor associated with persistent airflow limitation was a differential sputum eosinophilia whereas we29 and others30 demonstrated that raised differential sputum eosinophil and neutrophil counts were both associated with a lower prebronchodilator FEV1. Here we report for the first time that the RB1 %WA is increased in subjects with and without eosinophilic inflammation and is associated with the preceding burden of neutrophilic inflammation over time measured by repeated sputum analysis. Our observation that airway wall thickening in severe asthma can be present in both eosinophilic and non-eosinophilic asthma but is not related to the degree of airway inflammation measured cross-sectionally is in keeping with other imaging studies in mild-to-moderate disease. Little et al failed to find an association between airway wall geometry and sputum neutrophils or exhaled nitric oxide.31 Similarly, Niimi et al failed to find an association between serum eosinophil cationic protein and airway wall geometry.5 These studies were cross-sectional in design and did not capture the temporal relationship between inflammation and remodelling. Our study findings supporting a role for persistent neutrophilic inflammation in the development of airway remodelling is in contrast to our recent report7 that the RB1 wall area decreased after 1 year of treatment with anti-IL-5 compared with placebo, providing strong evidence in favour of a key role for eosinophils in airway remodelling determined by CT. One possible explanation for this apparent paradox is that eosinophilic and neutrophilic inflammation may both contribute to airway remodelling but they may exert different effects on airway geometry and lung function. In this report the changes in RB1 %WA are largely driven by luminal narrowing which may be more closely related to neutrophilic inflammation whereas, in our study of anti-IL-5,7 the wall area was decreased without affecting the luminal area. Importantly, the change in wall area in response to anti-IL-5 was small but significant, suggesting that additional components of airway inflammation play a role in remodelling. This view is supported by the association of other markers of airway inflammation in sputum such as transforming growth factor β32 and the ratio of matrix metalloproteinase-9 to tissue inhibitor of metalloproteinases-133 and airway wall thickening.
This recognition of the complexity of the interactions of different aspects of the airway inflammation underlying asthma and their temporal course provides an explanation for the apparent discrepancy between some CT studies. Methodological variations or difficulties in the measurement of airway dimensions and the inability of CT scanning to dissect out various individual components of airway remodelling may also contribute to the apparent discrepancy between CT studies. This highlights the need for further prospective interventional and longitudinal studies.
In addition to FEV1% predicted and neutrophilic inflammation, our univariate analysis also showed that disease duration was associated with thickening of the airway wall in severe asthma. This is in keeping with previous reports which have shown that vascular remodelling of the airway wall is related to disease duration34 and that duration of disease is associated with increased airway smooth muscle mass and luminal narrowing in patients with fatal asthma.35 However, this feature and the univariate association between asthma control and %WA were not found to be independent predictors in the multiple regression model.
Our study has a number of potential limitations. The HRCT scan was part of the clinical assessment of the subjects, was not undertaken in all subjects and in some subjects the CT scan did not adequately capture the RB1 so these subjects were excluded. We are confident that our findings can be extended to those subjects who underwent CT scanning but were excluded as there were no differences in the clinical characteristics between these groups. However, our findings cannot be simply extrapolated to our severe asthma population as a whole as we have previously reported that subjects in our ‘difficult asthma’ clinic who undergo HRCT scanning are older, have longer disease duration, poorer lung function, are treated with a higher dose of inhaled corticosteroids and oral corticosteroids and have increased neutrophilic airway inflammation.4 There is therefore a need to undertake multicentre prospective studies that include the full spectrum of patients with severe asthma. In addition, we analysed the images of RB1 from standard HRCT scans and not from narrow collimation CT scans which capture RB1 across its entire length. We found that the variability in RB1 dimensions across its length was small and considerably less than the between-subject variability. This was therefore unlikely to have an impact on our findings. Our analysis was limited to third-generation bronchial airways, unlike other studies36 where differences between subjects with asthma and controls were only found in airways of higher generations. We and others have established that the measurement of RB1 is closely associated with the measurement of multiple airways.6 8 RB10 dimensions were correlated with those of RB1 and, importantly, the degree of RB10 remodelling in patients with severe asthma and control subjects reflected remodelling changes observed in RB1 suggesting that, despite disease heterogeneity, RB1 dimensions serve as a good surrogate for airway wall remodelling in this disease cohort as previously described. The FWHM technique used for quantitative assessment in this study is known to cause errors in airway wall estimation due to CT scanner point spread function. To overcome such problems, various other techniques such as the ‘laplacian of Gaussian algorithm’36 which uses smoothing and edge detection filters to segment airways, the ‘maximum-likelihood method’37 whereby the attenuation threshold along each ray is matched to an ideal calculated ray and the ‘energy driven contour estimation method’38 which incorporates shape independent quantification have been developed. Most of the newer software platforms are designed to work on volumetric CT scans and not the standard sequential HRCT scans. We used an airway phantom model with gold standard measures obtained using high-precision micro-CT as previously described7 8 to correct potential size and oblique orientation-related errors in quantification of airway dimensions. Moreover, we have measured and compared the third-generation proximal airway in all subjects. We are therefore confident that the potential errors associated with the FWHM technique are unlikely to affect our results.
In conclusion, the degree of airway wall remodelling assessed by CT scanning was similar in all severe asthma subphenotypes and was associated with airflow limitation and neutrophilic inflammation. Longitudinal studies are required in severe asthma to assess the natural history of remodelling, its association with airway inflammation and function and its response to current and novel therapies.
Acknowledgments
The authors thank Mr Will Monteiro and colleagues for the processing and analysis of sputum samples, Mrs Beverley Hargadon and colleagues for help with patient clinical characterisation and colleagues in the Radiology Department at Glenfield Hospital, Leicester for coordinating HRCT scans.
References
Supplementary materials
Web Only Data thx.2010.136374
Files in this Data Supplement:
Footnotes
Funding The Wellcome Trust (Senior Clinical Fellowship, CEB).
Competing interests CEB has received research grants from MedImmune, AstraZeneca and GlaxoSmithKline and fees for consulting and/or speaking from MedImmune, AstraZeneca, GlaxoSmithKline, Novartis, Aerovant and Genentech. AJW has received research grants from GlaxoSmithKline and Pfizer and is on GlaxoSmithKline advisory board on asthma and related diseases. PH has received an unrestricted educational grant from GlaxoSmithKline. All other authors declare that they have no competing interests of relevance to this manuscript. No pharmaceutical company had any involvement in the planning, design, analysis or interpretation of the current study.
Ethics approval This study was conducted with the approval of the Leicestershire, Northamptonshire and Rutland research ethics committee.
Provenance and peer review Not commissioned; externally peer reviewed.