Article Text

Abstract
BACKGROUND Inhalation of lipopolysaccharide (LPS) causes an inflammatory response in the lungs. To explore this response, inflammatory indices were measured in induced sputum from atopic asthmatic patients and compared with atopic and non-atopic subjects after inhalation of LPS.
METHODS The effects of inhaled LPS (60 μg) or placebo (0.9% saline) were examined in a randomised, double blind, crossover trial in 11 non-atopic normal subjects, seven atopic, non-asthmatic individuals, and eight atopic, asthmatic patients. Sputum was induced by inhalation of 3.5% saline before the test inhalation and again at six hours and 24 hours. Spirometry (forced expiratory volume in one second (FEV1), forced vital capacity (FVC)), heart rate, blood pressure, and temperature were recorded before challenge and at intervals until eight hours, and at 24 hours after challenge.
RESULTS There was no change in cardiovascular parameters or spirometry with either exposure in any group. In the asthmatic patients only, inhalation of LPS caused a rise in temperature, with a peak of 0.6°C at seven hours, which was significantly higher than following placebo inhalation (p<0.05). In normal subjects, LPS caused a significant rise in absolute neutrophil counts at 24 hours compared with placebo (median 1.1 × 10⁶ cells/ml after LPS; median 0.2 × 10⁶ cells/ml after placebo, p<0.01), but no change in differential counts. In asthmatic patients, LPS caused a significant rise in differential neutrophil counts at six hours compared with placebo (median 88% after LPS; median 56% after placebo, p<0.05), but no change in absolute cell counts at any time point. There was no change in neutrophil counts in the atopic subjects. There was a significant rise in sputum interleukin 8 (IL–8) concentrations in normal subjects at six hours compared with placebo (mean placebo 1.1 ng/ml; LPS 3.0 ng/ml, p<0.05) and in asthmatics at 24 hours (mean placebo 2.0 ng/ml, LPS 6.9 ng/ml, p<0.05). There were no changes in sputum concentrations of tumour necrosis factor α or granulocyte macrophage colony stimulating factor at any time.
CONCLUSIONS Inhalation of LPS causes a neutrophilic inflammation with increases in IL–8 in both normal and asthmatic subjects.
- endotoxin
- induced sputum
- neutrophils
- atopy
- asthma
- interleukin 8
Statistics from Altmetric.com
Bacterial lipopolysaccharides (LPS) are constituents of Gram negative bacteria, which are present in the environment, and in the oral and nasal cavities of humans. Exposure to endotoxin occurs in a number of ways; by aspiration of secretions from the mouth and nasopharynx1 or by inhalation of endotoxin contaminated water.2 ,3 Endotoxins are also present in certain types of organic dusts; inhalation of these dusts is thought to be responsible for a number of occupational diseases including byssinosis,4 swine worker’s disease,5 and farmer’s lung disease.6
Previous exposure studies in man have shown that inhalation of endotoxin leads to impaired lung function7-9 and an inflammatory response in the lungs. These studies suggest that asthmatic subjects are more sensitive to the inhalation of LPS than normal subjects in terms of lung function.
The inflammatory response to LPS inhalation consists of increases in various proinflammatory cytokines, such as interleukin 8 (IL–8), IL 1β, and tumour necrosis factor α (TNFα), accompanied by neutrophil recruitment10-12 in normal subjects10-13 and in smokers.11 Previous studies of the inflammatory effect of inhaled LPS have examined the early effects on inflammatory cells and cytokines. In this study we used the technique of induced sputum to study the proinflammatory effect of inhaled LPS over a period up to 24 hours in non-atopic, non-asthmatic subjects, in atopic non-asthmatic individuals, and in atopic asthmatics, to determine whether asthma or atopy predispose to a greater inflammatory response to inhaled LPS in the lungs.
Methods
SUBJECTS
Eleven healthy non-atopic, non-asthmatic volunteers were studied; mean age 25.5 years. All had normal bronchial reactivity (provocative concentration (PC)20 methacholine >64 mg/ml) and were non-atopic on skin prick testing to common aeroallergens (cat,Aspergillus fumigatus, grass pollen andDermatophagoides pteronyssinus). They reported no history of respiratory or allergic disease and were on no medications. We also studied seven atopic, non-asthmatic subjects (mean age 23.9 years), who had normal bronchial reactivity, but a positive skin prick test to at least one allergen and a history of symptoms on relevant allergen exposure. None was taking medication at the time of the trial. We also studied eight mild asthmatic volunteers (as defined by American Thoracic Society criteria14), mean age 26.0 years, with a forced expiratory volume in one second (FEV1) >70% predicted, and all were atopic. All had a PC20methacholine <8 mg/ml, and were controlled with β2agonists only. None was taking inhaled or oral steroids at the time of the study or for eight weeks before the trial (table 1). All subjects were male, and non-smokers or ex-smokers for more than five years. None had suffered from an upper respiratory tract infection in the previous eight weeks. Written informed consent was obtained from all volunteers. The study was approved by the ethics committee of the Royal Brompton Hospital and the National Heart & Lung Institute.
Characteristics of asthmatic patients
MATERIALS
The LPS solution was prepared by dissolving 4 mgEscherichia coli endotoxin (Sigma Chemicals, Poole, Dorset, UK) in 3 ml endotoxin free sterile 0.9% saline before use. Saline solution was used as a placebo. Both solutions were delivered with a breath activated nebuliser (Mefar Dosimeter MB3, Brescia, Italy). The nebuliser delivered particles with an aerodynamic mass median diameter of 3.4 to 4 μm. Subjects inhaled five breaths of each solution (60 μg LPS or placebo).
LUNG FUNCTION MEASUREMENTS
FEV1 and forced vital capacity (FVC) were measured using a dry wedge spirometer (Vitalograph, Buckingham, Buckinghamshire, UK). Values were expressed as per cent predicted normal. Baseline values were measured after 15 minutes’ rest and taken as the highest of three readings. Single readings only were taken at other times. The level of bronchial reactivity was assessed by methacholine challenge performed according to a standardised technique.15 The dose required to cause a 20% drop in FEV1(PC20) was determined by linear interpolation of the concentration–FEV1 response curve.
SPUTUM INDUCTION PROCEDURE
Subjects inhaled 3.5% saline for 15 minutes in total, via an ultrasonic nebuliser (DeVilbiss 2000, DeVilbiss Co, Heston, Middlesex, UK) with a calibrated mass median aerodynamic diameter of 4.5 μm, and output of 4.5 ml/min. The aerosol was inhaled through a tube 110 cm long with an internal diameter of 22 mm equipped with a mouthpiece, with the subject’s nose clipped. Subjects discarded saliva into a bowl and mouth washed before each expectoration. Any secretions collected during the first five minutes were discarded to minimise squamous epithelial cell contamination. Subjects were encouraged to cough deeply at five minute intervals and any other time they felt the need. Secretions expectorated over the final 10 minutes were kept at 4°C for not more than two hours before processing. For safety reasons, all asthmatic subjects were premedicated with 200 μg inhaled salbutamol before the sputum induction procedure to prevent bronchoconstriction from the hypertonic saline.
SPUTUM PROCESSING
The whole sputum sample was processed as described previously.16 Sputum was diluted with Hank’s balanced salt solution (HBSS) containing 1% dithiothreitol (DTT) (Sigma Chemicals) and vortexed at room temperature. When homogeneous, the volume was recorded and the sample was diluted further with HBSS and centrifuged at 300 g for 10 minutes. The supernatant was separated and frozen at −70°C until further analysis. The cell pellet was resuspended in HBSS. Total cell counts were determined on a haemocytometer slide using Kimura stain and slides were prepared using a cytospin (Shandon, Runcorn, Cheshire, UK) and stained with May-Grunwald-Giemsa stain. Differential cell counts were performed by a “blinded” observer. Three hundred non-squamous cells were counted on two slides for each sample. Differential cell counts are expressed as a percentage of lower airway cells—that is, excluding squamous epithelial cells.
TNFα ASSAY
TNFα concentrations were measured using an amplified sandwich enzyme linked immunosorbent assay (ELISA). Ninety six well microtitre plates (Greiner Labortecnik Ltd, Dursley, Gloucestershire, UK) were coated with 100 μl mouse monoclonal antiTNFα antibody (NBS Biologicals, Huntingdon, Cambridgeshire, UK) at a 1:400 dilution and incubated for two hours at 37°C. Plates were then washed with phosphate buffered saline (PBS) containing 0.05% vol/vol Tween 20 and blocked with bovine serum albumin (BSA) 5% wt/vol for 25 minutes at 37°C. The plates were washed again and TNFα standards (containing 0.2% DTT) and sputum supernatant samples were added in duplicate and incubated at 4°C for 18 hours. Plates were washed and incubated at room temperature for two hours with 100 μl rabbit antihuman TNFα polyclonal antibody (Genzyme Diagnostics, West Malling, UK). After a further wash, an alkaline phosphatase conjugated donkey antirabbit polyclonal IgG antibody (Jaxon/Stratech Scientific Ltd, Luton, Bedfordshire, UK) diluted 1:2000 was added and incubated for two hours at room temperature. Excess antibody was washed off and plates were developed with a p-nitro-phenyl phosphate assay kit (number 50–80–00; KPL/Dynatech Laboratories Ltd, Billinghurst, Sussex, UK). The optical density of the wells was read at 405 nm using a plate photometer and quantified by interpolation on a standard curve of known concentrations of human recombinant TNF in the range 8 to 800 pg/ml (RD Systems, Abingdon, Oxfordshire, UK). The lower detection limit of the assay is 8 pg/ml.
IL–8 ASSAY
IL–8 concentrations were measured using an amplified sandwich ELISA. Ninety six well microtitre plates were coated with 100 μl mouse monoclonal antihuman IL–8 antibody (Genzyme Diagnostics) at a concentration of 2.5 μg/ml and incubated overnight at 4°C. Plates were washed with PBS containing 0.05% vol/vol Tween 20 and immediately blocked with BSA 1% wt/vol for two hours at 37°C. Plates were decanted and IL–8 standards (containing 0.2% DTT) and sputum supernatant samples were added in duplicate and incubated at 37°C for one hour. Plates were washed and incubated at 37°C for one hour with 100 μl rabbit antihuman IL–8 polyclonal antibody (Genzyme Diagnostics). After a further wash, streptavidin horseradish peroxidase (Genzyme Diagnostics) diluted in 0.05% PBS Tween 20 with 1% BSA was added and incubated for 15 minutes at 37°C. Following a further wash, 100 μl tetramethylbenzidine (TMB) (Sigma Chemicals) was added and plates were left for 20 minutes at room temperature. The colour reaction was stopped with 2N sulphuric acid (Sigma Chemicals). Optical density of the wells was read at 450 nm using a plate photometer and quantified by interpolation from a standard curve constructed to known concentrations (16 to 2000 pg/ml) of human recombinant IL–8 (Genzyme Diagnostics).
GM-CSF ASSAY
Rat antihuman granulocyte macrophage colony stimulating factor (GM-CSF) monoclonal antibody (Pharmingen, San Diego, California, USA) was diluted to 2 μg/ml in NaHCO3 (pH 8.2), and 50 μl added to each well of a 96 well plate and incubated at 4°C for 16 hours. Wells were washed with PBS/Tween 20 0.05% wt/vol; 200 μl PBS/10% fetal calf serum was added to the wells and incubated at room temperature for two hours. Plates were washed again with PBS/Tween. Then 100 μl of standards (16 to 2000 pg/ml) made up in 0.2% DTT and 100 μl of samples were added in duplicate to the plates. Plates were then incubated for 16 hours at 4°C. Next, 100 μl biotinylated rat antihuman GM-CSF monoclonal antibody (Pharmingen) was added and incubated for 45 minutes at room temperature before washing six times. Then 100 μl of a 1:400 dilution of 1 mg/ml stock avidin peroxidase (Sigma Chemicals) was added and incubated at room temperature for 30 minutes before further washing. Finally, 10 μl hydrogen peroxide was added to ABTS (2,2′-azino-bis (3-ethylbenz-thiazoline-6-sulphonic acid)) substrate (Sigma Chemicals) and 100 μl added to each well. Colour was developed for 60 minutes and optical density read at 405 nm using a plate photometer. A standard curve was constructed and sample values were determined by interpolation.
STUDY DESIGN
The trial was double blind, randomised, placebo controlled, and crossover. An initial screening visit involved a full medical history, physical examination, spirometry (FEV1 and FVC), skin prick testing, and a methacholine challenge. Subjects were then classified as normal, atopic, or asthmatic on the basis of these results.
Subjects reattended on a separate study day at 8 am and underwent a number of baseline investigations of spirometry, oral temperature, pulse, and blood pressure measurement. A baseline sample of sputum was collected by inhalation of hypertonic saline. Subjects were then randomised to inhale either 60 μg LPS or saline placebo. Subjects remained under observation and spirometry was repeated hourly for eight hours. Temperature, pulse, and blood pressure were measured every two hours. A repeat sputum sample was collected six hours after the challenge. Subjects were then allowed home and reattended 24 hours after the original challenge, at which time all the above procedures were repeated and subjects were questioned about any symptoms. After a four week washout, subjects reattended and the whole process was repeated with the opposite challenge solution.
ANALYSIS OF DATA
Cardiovascular parameters, temperature, and spirometry were analysed using repeated measures analysis of variance (ANOVA). Where differences were found the peak value following exposure was taken as a summary measurement. Comparisons between placebo and LPS exposure were then made using a paired t test. Results of supernatant assays were compared using a pairedt test to examine differences between exposures at six hours and 24 hours within each group of subjects. Comparisons between groups were initially made using ANOVA, followed by a non-paired t test where the ANOVA was significant. Results of parametric data are expressed as means with 95% confidence intervals (CI), unless stated otherwise. Cell count data are not normally distributed and are expressed as medians throughout. The Wilcoxon signed rank test was used to compare cell counts following placebo and LPS exposure at six and 24 hours within each subject group. Differences between groups were analysed using the Kruskal Wallis test. If this was significant, pairwise comparisons were made using the Mann-Whitney rank sum test. Correlations were calculated using Spearman’s rank correlation coefficient. For all tests, p<0.05 was considered significant.
Results
ADVERSE EVENTS
Two of the normal subjects reported having a mild headache in the evening following the inhalation of LPS. Neither subject required any treatment and the headache resolved within 24 hours in both cases.
CARDIOVASCULAR PARAMETERS
There was no significant change in pulse rate or blood pressure at any time point following challenge with inhaled LPS or placebo.
TEMPERATURE
There was no significant change in oral temperature at any time in normal or atopic subjects. In the asthmatic group, inhalation of LPS caused an increase in temperature, with a peak rise of 0.6°C at seven hours, which was significantly higher than following placebo inhalation (p<0.05, fig 1).

Change in temperature following inhalation of LPS (closed circles) or placebo (open circles) in asthmatic patients. Values shown as mean (SE). *p<0.05 compared with placebo at seven hours after challenge.
SPIROMETRY
There was no difference in the baseline FEV1 between the three groups (normals 103.5% of predicted value, 95% CI 92.7 to 114.3; atopics 100.1%, 95% CI 86.4 to 113.9; and asthmatics 93.0 %, 95% CI 81.0 to 104.9). There was no significant change in either FEV1 or FVC following LPS or placebo in any of the groups.
SPUTUM CELL COUNTS
All but three sputum samples were adequate for analysis and data for these (one normal baseline and two normal subjects at six hours after placebo) were excluded from the analysis.
In normal subjects, there was a significant approximate fivefold increase in the absolute neutrophil count following LPS inhalation compared with placebo at 24 hours (p<0.01, fig 2D). There was an increase of 25 to 32% in differential neutrophil counts at six hours after inhalation of either LPS or placebo (fig 2A), but no significant difference between exposures at this time point. There was no significant difference between placebo or LPS exposure in the differential or absolute counts of macrophages (fig 3A and 3D), eosinophils, lymphocytes or epithelial cells at any time point.

Effect of LPS inhalation on sputum neutrophils. Differential and absolute neutrophil counts following LPS (closed symbols) and placebo exposure (open symbols). Differential counts in normal subjects (A), atopic subjects (B), and asthmatic patients (C). Absolute neutrophil counts in normal subjects (D), atopic subjects (E), and asthmatic patients (F). Values are shown as individual data points with medians. Absolute counts are given on a logarithmic scale. *p<0.05, **p<0.01 compared with placebo.

Effect of LPS inhalation on sputum macrophages. Differential and absolute macrophage counts following LPS (closed symbols) and placebo exposure (open symbols). Differential counts in normal subjects (A), atopic subjects (B) and asthmatic patients (C). Absolute macrophage counts in normal subjects (D), atopic subjects (E) and asthmatic patients (F). Values are shown as individual data points with medians. Absolute counts are given on a logarithmic scale. *p<0.05 compared with placebo.
In atopic subjects, there was a similar increase in differential neutrophils at six hours (fig 2B) following placebo or LPS, but no difference between the two exposures. There were no changes in absolute neutrophil counts in this group (fig 2E). There were no significant differences between placebo and LPS exposures in differential or absolute counts of macrophages (fig 3B and 3E), eosinophils, lymphocytes, or epithelial cells at any time point.
In asthmatic patients, inhalation of LPS caused a significant rise in neutrophils of 32% above placebo at six hours (p<0.05), and this remained raised at 24 hours, albeit not significantly (fig2C). There were no significant differences in the absolute neutrophil counts following LPS inhalation compared with placebo (fig2F). Both the differential and absolute macrophage counts at six hours were significantly lower in the LPS treated group compared with placebo (p<0.05, fig 3C and 3F). There were no significant differences in the differential or absolute counts of eosinophils, lymphocytes, or epithelial cells between placebo or LPS exposures.
A comparison of the difference in differential neutrophil counts between placebo and LPS exposure within each subject group demonstrated a significantly greater difference at six hours in asthmatic subjects compared with normal subjects (mean increase in normal subjects 7.1%, 95% CI –9.4 to 23.7; mean increase in asthmatics 32.1%, 95% CI 13.9 to 50.4; p<0.05; compare fig 2A and 2C). No difference was found between groups for absolute neutrophil counts. A comparison of the difference in absolute macrophage counts between placebo and LPS exposure within each subject group demonstrated a significantly greater difference at six hours in asthmatic subjects compared with normal subjects (mean decrease in asthmatic patients of 34.2 million cells/ml, 95% CI 0.6 to 67.9; mean increase in normal subjects of 13.6 million cells/ml, 95% CI –0.3 to 27.5, p<0.05; compare fig 3D and 3F). No difference was found between groups for the differential macrophage counts.
SUPERNATANT ASSAYS
Data for a number of the supernatant samples were unavailable due to degradation during storage. Data were available for all samples in the asthmatic patient group. Complete data were available for six of the normal subjects, and a total of nine data points were missing from the remaining five patients. In view of the small number available for the atopic subjects we did not perform any statistical analysis in this group.
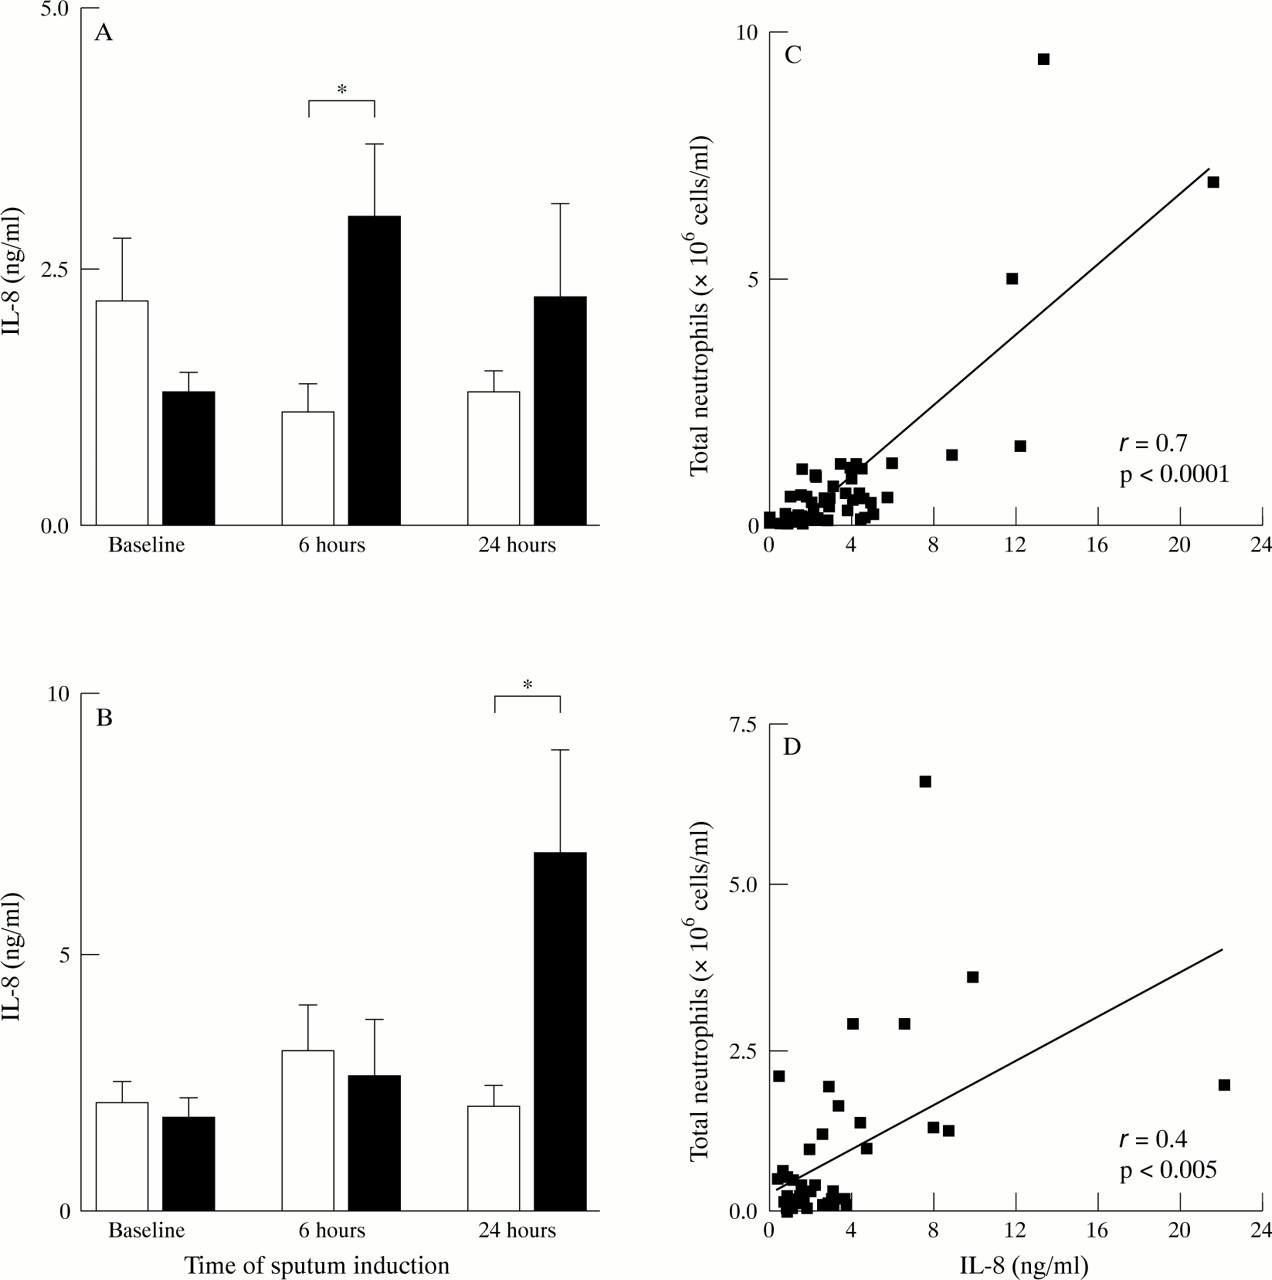
There was no difference in the baseline concentrations of IL–8 between normal subjects (1.7 ng/ml, 95% CI 1.0 to 2.4) and asthmatics (2.0 ng/ml, 95% CI 1.4 to 2.5). In the normal subjects there was an increase in IL–8 at six hours after LPS (3.0 ng/ml, 95% CI 1.3 to 4.7) that was significantly higher than after placebo (1.0 ng/ml, 95% CI 0.4 to1.7, p<0.05, fig 4A). In the asthmatic group there was a rise in IL–8 at 24 hours (6.9 ng/ml, 95% CI 2.1 to 11.7) that was significantly higher than the placebo group (2.0 ng/ml, 95% CI 1.0 to 3.1, p<0.05, fig 4B). There was a significant positive correlation between IL–8 concentrations and absolute neutrophil counts in normal subjects (r = 0.7, p<0.0001, fig 4C) and a weaker correlation in asthmatics (r = 0.4, p<0.005, fig 4D). A comparison of the difference in IL–8 concentrations between placebo and LPS exposure within each subject group demonstrated a significantly greater difference at six hours in normal subjects compared with asthmatic subjects (mean increase in normal subjects 2.0 ng/ml, 95% CI 0.7 to 3.4; mean decrease in asthmatics 0.5 ng/ml, 95% CI –2.6 to 1.5; p<0.05; compare fig 4A and4B). There was no significant difference between the groups at 24 hours.

Effect of LPS inhalation on sputum supernatant IL–8 concentrations. IL–8 concentrations following LPS (closed bars) and placebo exposure (open bars) in normal subjects (A) and asthmatic patients (B). Values are mean (SE). *p<0.05 compared with placebo. Correlation between IL–8 concentrations and absolute neutrophil counts in normal subjects (C) and asthmatics (D).
Mean baseline concentrations of TNFα for both exposures combined were significantly higher in asthmatics (98.4 pg/ml, 95% CI 38.4 to 158.4) than in normal subjects (13.5 pg/ml, 95% CI 0 to 33.9, p<0.05). There was no significant change in the TNFα concentrations in the asthmatic or the normal subjects at any time point following LPS (table2).
Mean (SE) GM-CSF (ng/ml) and TNFα (pg/ml) concentrations in normal and asthmatic subjects following inhalation of endotoxin or placebo
There was no difference between mean baseline concentrations of GM-CSF, for both exposures combined, in normal and asthmatic subjects (normals 0.5 ng/ml, 95% CI 0.3 to 0.7; asthmatics 0.6 ng/ml, 95% CI 0.4 to 0.7). The concentrations of GM-CSF did not change following LPS in either group (table 2).
Discussion
The present study demonstrated that inhalation of 60 μg LPS causes an increase in neutrophils in induced sputum in normal and asthmatic patients but not in atopic subjects. We also showed increases in sputum IL–8 at six hours in normal subjects and at 24 hours in asthmatic patients.
The dose of 60 μg endotoxin chosen in our experiment was calculated to equate with the amount of endotoxin that workers are likely to be exposed to in an occupational setting. For example, cotton mill workers are exposed to airborne concentrations of 0.15 to 0.46 μg/m3.17 Other occupations lead to exposures of up to 1 μg/m3.18 However, these values were measured by the Limulus lysate assay, which is inaccurate in the measurement of endotoxin bound to cells. This assay tends to underestimate the actual value of endotoxin by approximately 10-fold compared with chemical assays,8 giving occupational exposure concentrations of 1.5 to10 μg/m3. Assuming a respiratory volume of 1.5 m3/h and an eight hour shift in an environment with an endotoxin concentration of 5 μg/m3, subjects would be exposed to an actual dose of endotoxin of approximately 60 μg.
Inhalation of LPS has previously been shown to affect lung function in both normal subjects and asthmatics. In normal subjects the effect of inhalation of LPS on FEV1 appears to be dose related. Doses of LPS up to 100 μg have no effect on FEV1 in normal subjects,8 ,9 ,19 ,20 whereas a dose of 200 μg causes a significant fall in FEV1.8 This is consistent with the present study, which found no effect on FEV1 in normal subjects after 60 μg LPS.
Asthmatic subjects appear to be more sensitive to the effects of inhaled LPS, with doses as low as 20 μg causing small but significant falls in FEV1 of 5 to 8% from baseline.9 ,21 ,22 In contrast, we did not demonstrate a significant fall in FEV1 in the asthmatic subjects in the present study. This finding is not unexpected as the asthmatic subjects were premedicated with 200 μg inhaled salbutamol before the induction of sputum, approximately 30 minutes before the challenge exposure. This pretreatment with inhaled salbutamol is standard practice in our laboratory for safety reasons to prevent the bronchoconstriction that can occur in asthmatic subjects following the inhalation of hypertonic saline.23 The asthmatic subjects did, however, have a small but significant rise in temperature following LPS, which was significantly higher than the value following the placebo exposure.
Previous studies have demonstrated a proinflammatory effect of endotoxin inhalation in both animal and human exposure studies. Previous human exposure studies have shown increases in peripheral blood neutrophils following inhalation of endotoxin in normal subjects24 and asthmatics.21Bronchoscopy studies in healthy subjects have also shown increases in bronchoalveolar lavage (BAL) neutrophils at three hours10and at 90 and 240 minutes in healthy non-smoking volunteers and healthy smokers.11 A recent study in normal volunteers12 showed increases in induced sputum neutrophils with a dose as low as 5 μg LPS. Our study demonstrated a rise in absolute neutrophil counts in induced sputum from normal subjects following LPS inhalation compared with placebo at 24 hours. There was also a rise in neutrophil percentage following LPS in the normal subjects at six hours but no significant difference between the placebo and LPS groups at this time point, as there was also a notable rise after the placebo inhalation. The most likely explanation for this rise in neutrophils after placebo inhalation is a proinflammatory effect of the hypertonic saline used for the sputum induction. We have previously shown that repeated sputum induction alone causes a significant rise in percentage neutrophils in normal subjects at eight hours.25 This effect may also be responsible for the neutrophil increase seen in the atopic subjects after placebo in the present study. We have not demonstrated a rise in either differential or absolute neutrophil counts in the atopic group, suggesting that atopy does not increase the inflammatory effect of inhaled LPS. In the asthmatic patients there is a definite increase in percentage neutrophils at six hours with a non-significant increase in absolute neutrophil counts at six and 24 hours. A comparison of the difference in differential neutrophil counts between placebo and LPS exposure within each subject group demonstrated a significantly greater difference at six hours in asthmatic subjects compared with normal subjects. However, this difference may not be clinically significant as the absolute values of the differential counts are similar for the two groups at six hours (median in normals 84.2%, median in asthmatics 88.2%).
We also found a greater decrease in both differential counts and absolute numbers of macrophages in the asthmatic subjects at six hours after LPS inhalation compared with the placebo exposure, but no significant change in the atopic or normal subjects. For the normal subjects, our data are consistent with previous observations of no significant change in macrophage number in BAL fluid after inhalation of LPS,10 ,11 although a recent study showed a trend for reduction of macrophage numbers in induced sputum after LPS.12 To our knowledge, there are no previous studies demonstrating changes in macrophage number in BAL fluid or sputum of asthmatics after inhalation of LPS, although a decrease in macrophage counts in BAL fluid has been demonstrated in guinea pigs following inhalation of LPS.26 The mechanism underlying the reduction in macrophages in the present study is not known. A possible explanation is that LPS limits macrophage influx into the airway lumen, with a concomitant reduction in number in the sputum. It has been shown that LPS stimulation of human BAL macrophages in vitro changes the expression of very late antigen (VLA) 2, 3, and 5 and of fibronectin, which may be consistent with impairment of VLA mediated migration, resulting in local accumulation of macrophages in the lung.27 This suggestion is supported by a study demonstrating increased adhesion of rat BAL macrophages to a type II pulmonary epithelial cell line following in vivo tracheal instillation of LPS.28 An alternative explanation is that the inhalation of endotoxin causes an increase in apoptosis of macrophages, an effect that has been demonstrated in human alveolar macrophages exposed in vitro to LPS.29
We have shown a significant increase in the concentrations of IL–8 after LPS in normal subjects at six hours compared with placebo. We also demonstrated a rise in sputum IL–8 concentrations in asthmatic subjects following LPS inhalation. In the asthmatic subjects, however, this rise did not occur until 24 hours. IL–8 has been implicated as underlying the attraction of neutrophils after LPS inhalation.11 Previous studies have demonstrated an early rise in BAL concentrations of IL–8 following LPS inhalation in both smokers and non-smokers.11 This is consistent with our data for normal subjects. However, the rise in neutrophils in the asthmatic group precedes the rise in IL–8 concentrations, suggesting other neutrophil chemoattractants may be involved in asthmatic subjects. Further support for this conclusion comes from the finding that there is a significant correlation between absolute neutrophil counts and IL–8 concentrations in the normal subjects in our study (r = 0.7, p<0.001), while the correlation between neutrophils and IL–8 concentrations in the asthmatic group is weaker (r = 0.4, p<0.005). This is consistent with a previous in vitro study that showed that cultured human alveolar macrophages produced IL–8 in response to stimulation with LPS, but that this IL–8 was not sufficient to account for the total neutrophil chemotactic activity in the culture fluid.30
Previous studies have demonstrated a role for TNFα in the response to inhaled endotoxin, with increases in blood,21 BAL fluid,11 and induced sputum.12 The reason for the lack of change in TNFα concentrations in the present study is unclear but may be due to differences in sputum processing; we used the whole sputum sample whereas Michel et alused the technique of sputum plug selection.12 The concentrations of TNFα measured were very low and in most samples, in normal subjects particularly, concentrations were below the limit of detection of the assay. This may be less of a problem using the technique of sputum plug selection as this decreases the dilutional effect of any salivary contamination of the sample.
Previous work has demonstrated that GM-CSF is a primary endogenous regulator of neutrophil recruitment. It is known to stimulate IL–8 production by polymorphonuclear cells,31 it increases release of TNFα from cells of the monocyte macrophage line,32 and subcutaneous injections of human recombinant GM-CSF leads to increases in alveolar neutrophils with related increases in BAL fluid IL–8 concentrations.33 Endotoxin has been shown to be a potent stimulus for production and release of GM-CSF in vitro34; in view of this we hypothesised that GM-CSF may be released in the lung following inhalation of lipopolysaccharide and may play a role in neutrophil recruitment. However, we were unable to demonstrate an increase in GM-CSF concentrations within the lung in the present study. It remains to be determined whether changes in peripheral blood occur following inhalation of LPS. Our results are in agreement with a previous study in which dogs were treated with intravenous endotoxin35and, although there were increases in plasma concentrations of granulocyte colony stimulating factor (G-CSF), there was no increase in the plasma concentrations of GM-CSF. As far as we are aware, there are no previous studies that have addressed the issue of GM-CSF concentrations within the lung following administration of LPS.
In conclusion, we have demonstrated an increase in total neutrophils at 24 hours in normal subjects, and a rapid increase in percentage of neutrophils in induced sputum at six hours following LPS inhalation in asthmatic subjects, which begins to resolve by 24 hours. Further evidence for an inflammatory effect of inhaled LPS is provided by the increased concentrations of IL–8 seen in both normal and asthmatic subjects. Overall, there is no clear evidence that either atopy or asthma predisposes to an increase in the inflammatory effects of LPS at the dose used.
Acknowledgments
This study was performed with funding from Astra Draco AB.