Article Text

Abstract
BACKGROUND The geographical distribution of tuberculosis in England and Wales and changes since 1983 were examined using data from the 1988 and 1993 national surveys of tuberculosis notifications.
METHODS Notification rates for England and Wales in 1988 and 1993 were calculated for geographical areas using Office for National Statistics (ONS) mid year population estimates. Those for the standard regions and the Greater London boroughs were calculated for the main ethnic groups. Those for the counties and local authorities were calculated for all ethnic groups combined. These were compared using data from the 1983 national survey as a baseline.
RESULTS Wide regional variations in notification rates persist with Greater London having the highest rates. Rates in the ethnic group from the Indian subcontinent (ISC) were high in all regions, whilst those of the white ethnic group varied fourfold. Twenty seven of the 33 London boroughs showed increased rates in 1993 compared with 1988. In general, those local authority areas with high rates had high proportions of notifications in individuals of ISC ethnic origin, emphasising the continuing important contribution of ethnic minority groups to local tuberculosis rates. The number of local authority areas with notification rates four times the national average increased, but the number of areas with low or zero rates increased even more.
CONCLUSIONS The distribution of tuberculosis in England and Wales continues to vary markedly by geographical area. The distribution is becoming increasingly polarised with a growth in the number of areas with very high rates of notifications and a greater increase in the number of areas with very few notifications. Patients from ethnic minorities continued to contribute a substantial and increasing proportion of all reported tuberculosis cases in most regions in 1988 and 1993. These findings have important implications for the provision of tuberculosis services in England and Wales.
- tuberculosis
- geographical distribution
- England and Wales
Statistics from Altmetric.com
The decline in tuberculosis notification rates in Britain1 and many other industrialised countries ceased in the mid to late 1980s, and in some countries small increases then followed. Tuberculosis occurring in people born in or originating from parts of the world with high rates of tuberculosis has been identified as the major contributor to these changes. Within individual countries there are variations in tuberculosis rates in different geographical areas, such as those previously described for England and Wales.2 3 Considerable variation also exists in the geographical distribution of the population subgroups at high risk of tuberculosis. Consistent with the recent overall notification rates,1 the number of cases in the 19884 and 19935 surveys increased. The proportion of tuberculosis notifications from ethnic minority groups is continuing to increase in England and Wales, being 45% in 1983,6 47% in 1988,4 and 56% in 1993.5
In view of the recent changes in tuberculosis notification rates overall, and since the last reported geographical analysis was based on data from the 1983 National Tuberculosis Notification Survey,3 it is timely to examine the current geographical distribution and changes over time using the data from the more recent national surveys during 19884 and 1993.5
The standardised rates of tuberculosis for both the 1988 and 1993 surveys have been calculated and, using 1983 as the baseline,6 the changes in the rates since 1983 in the geographical subdivisions of England and Wales have been examined.
Methods
Details of the survey methods have already been reported.4 5 During the six month survey periods the survey team was sent a copy of all notification forms received by the Medical Officers of Environmental Health (MOEH) in 1988, and from Consultants in Communicable Disease Control (CCDC) in 1993 for the 403 local authorities in England and Wales. These were checked against lists received from the Office of Population Censuses and Surveys (OPCS) which gave details of age, sex, and type of disease of the notified cases to confirm that information on all notifications during the survey had been received. In addition, a special form was completed for each patient notified by the clinician in all of the surveys, which included results of age, sex, ethnic origin, country of birth, and bacteriological and histological results. The classification of ethnic origin was similar to that used in previous surveys.2 7Patients were classified by the notifying physician as being of White, Indian, Pakistani, Bangladeshi, Black Caribbean (West Indian), Black African, Arab, Chinese, other (including mixed), or unknown ethnic origin. In the analysis of this report the Indian, Pakistani and Bangladeshi ethnic groups have been combined as the Indian Subcontinent (ISC) ethnic group, and all other non-white ethnic groups have been combined as “other” ethnic groups. Due to seasonal variations in the number of reported notifications, the annual number of cases have been estimated by multiplying the numbers from the two six month surveys by an appropriate scaling factor (1.953 in 19836; 1.9348 in 19884; 1.8864 in 19935). As with previous geographical analyses,2 3 all notified cases include those with a previous history of tuberculosis.
DENOMINATORS
For local government purposes in 1983–93 England was divided into eight standard regions which were further subdivided into 46 counties; seven of the latter were largely urban and were designated metropolitan counties. Wales was divided into eight counties. The 54 counties were further divided into 403 local authority areas of which 33 were in Greater London. The population estimates for 1983, 1988, and 1993 were taken from the appropriate mid year estimates of the Office for National Statistics (ONS, formerly OPCS). In this report individuals for whom the place of birth or date of entry into the UK was not obtained have been distributed proportionally amongst those for whom it was known. Population data were available to calculate notification rates for the main ethnic groups for the regions of England and Wales, and for the 33 boroughs of Greater London. However, population data by ethnic group were not available for the counties and local authorities, and therefore rates for these areas could only be calculated for all ethnic groups combined.
Results
SURVEY POPULATIONS
Of the 2748 notifications during the 1988 survey period, 340 were excluded.4 There remained 2408 newly notified patients, of whom 245 had had previous treatment for tuberculosis (the corresponding figures for 1983 were 3302 and 300, respectively); 54% were of white origin, 38% of ISC origin, and 8% of “other” ethnic groups. During the 1993 survey period there were 3298 notifications of which 592 were excluded.5 The main reasons for exclusions were inappropriate notifications (chemoprophylaxis) and denotification (non-tuberculous mycobacteria and other diseases). There remained 2706 newly notified patients, of whom 248 had had previous treatment for tuberculosis 44% were of white origin, 41% were of ISC origin, and 14% of “other” ethnic groups.
The data are presented for all types of disease combined, although there were differences in the disease characteristics between the ethnic groups.
STANDARD REGIONS OF ENGLAND
Table 1 shows the estimated annual notification rates per 100 000 for 1988 and 1993, respectively, for all ethnic groups combined and the main ethnic groups for the standard regions with Greater London shown separately from the rest of the South East. There were wide regional variations with low rates in Anglia, South West, and the South East (excluding Greater London), and the highest rates in Greater London in both years. The rates for the white ethnic group varied from 3.0 to 8.8 per 100 000 in 1988, with a wider range from 2.5 to 10.4 per 100 000 in 1993. Increases in the notification rate for the white population between 1988 and 1993 were seen only in the North (9%) and Greater London (18%). The rate in the West Midlands stayed unchanged, and decreases were seen in the other regions ranging from 14% in the North West and South West to 31% in Yorkshire. The rates for the ISC ethnic group were high in all regions (59–192 per 100 000 in 1988 and 67–180 per 100 000 in 1993).
Notifications in the six month surveys in 1988 and 1993 (and estimated annual rate/100 000) in the standard regions of England and Wales (with Greater London shown separately) by the main ethnic groups
GREATER LONDON LOCAL AUTHORITY AREAS (BOROUGHS)
The rates for the London boroughs are given in table 2. All but six of the 33 boroughs showed an increase between 1988 and 1993 with five boroughs (Lambeth, Hackney, Enfield, Bromley and Merton) all showing increases of more than 100%. The rate for Greater London as a whole increased by 30% from 19.9 to 25.9 per 100 000 with the number of notifications rising from 680 to 924 with only a 2% increase in population. Whereas in 1988 seven of the boroughs had rates more than three times that of England and Wales, this had increased to 10 boroughs by 1993.
Greater London Boroughs: estimated annual notification rates for 1983, 1988 and 1993 for all ethnic groups combined and details of 1993 population and notifications
OTHER ETHNIC GROUPS
There have been changes in the distribution of the ethnic populations in England and Wales since 1983,3 and particularly since 1988. In 1988 non-ISC non-white ethnic groups contributed 8% of notifications4 which increased to 14% by 1993,5 this increase being particularly seen in Black Africans in whom notifications increased from 1.7% to 7.1% between 1988 and 1993. The contribution of the non-ISC ethnic groups is seen most in the London boroughs (table 2). There has been little change in the contributions of the Black Caribbean and Chinese ethnic groups.
In 1988 the possibility of an association between the overall rates of tuberculosis in the white population in the 33 London boroughs and the number of infectious tuberculosis cases in the ISC population in the same boroughs was examined but no association was found (Spearman’s correlation coefficient 0.06). The same analysis was repeated in 1993 and again no evidence of an association was apparent (Spearman’s correlation coefficient 0.45).
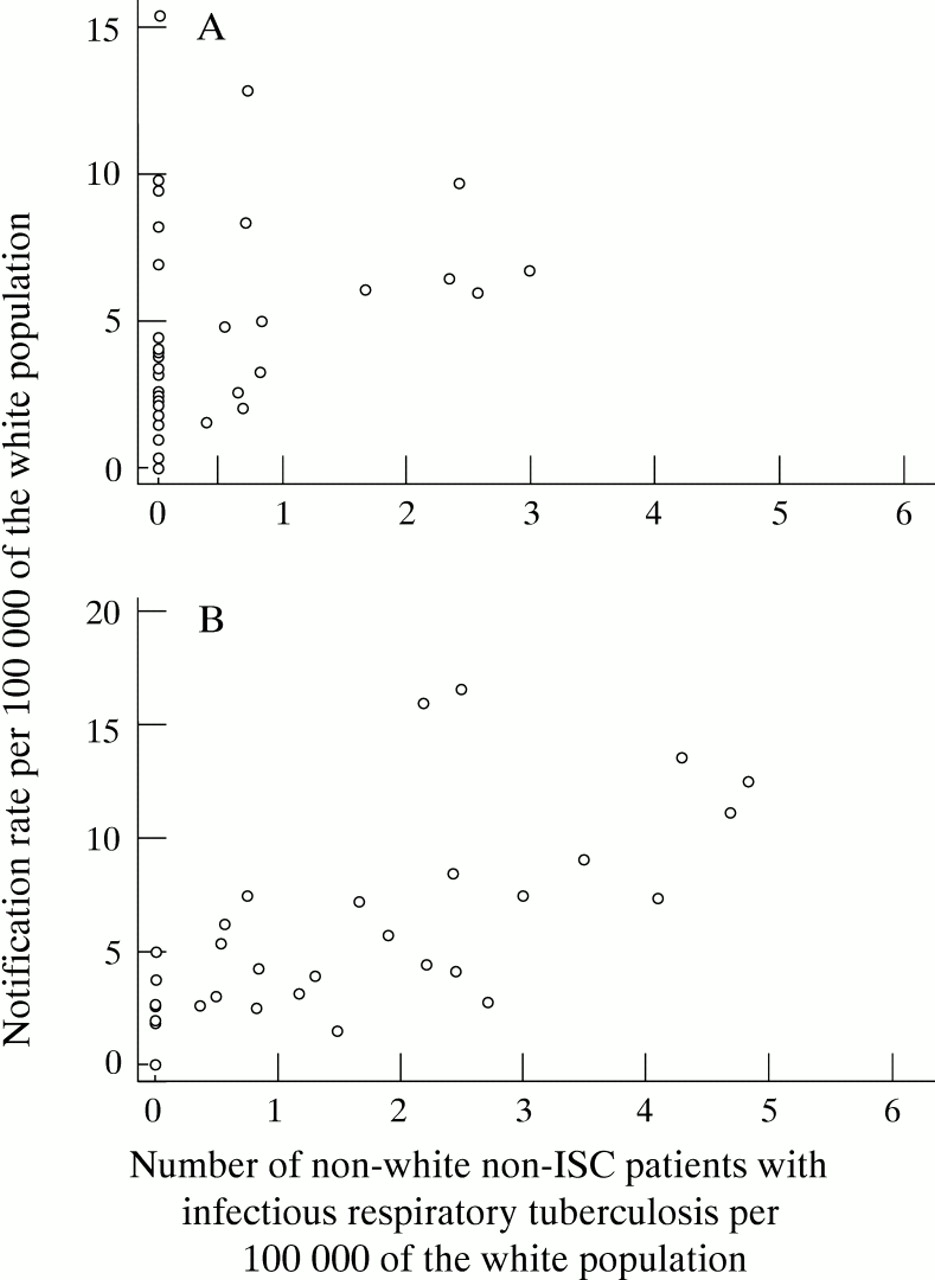
In the light of the increasing proportion of cases occurring in the non-white non-ISC group in 1993, an analysis was carried out using the number of cases of infectious tuberculosis in this group and the rates in the white population of the London boroughs (fig 1). No association was apparent in 1988 (Spearman’s correlation coefficient 0.35) but the possibility of an association was apparent in 1993 (Spearman’s correlation coefficient 0.69).
Relationship between the estimated number of patients of non-white non-ISC ethnic origin with infectious (smear and culture positive) respiratory tuberculosis per 100 000 of the white population and the estimated notification rate (for all forms of tuberculosis) in the white population in the 33 London boroughs in (A) 1988 (RS = 0.35) and (B) 1993 (RS = 0.69).
LOCAL AUTHORITY AREAS
The rates for those local authority areas outside Greater London with 15 or more cases and rates of 15 per 100 000 or more are presented in table 3. The number of such areas increased from 18 in 1988 to 21 in 1993. Of the 18 areas in 1988, 10 showed increases in 1993 and eight showed decreases—three of which (Stoke-on-Trent, Sandwell and Newcastle) had fallen below 15 per 100 000 by 1993. Liverpool, Reading, Oldham, and Middlesborough all had substantially higher rates in 1993 with increases of over 100% since 1988. Although there were increases in notification rates in some areas, the general trend for 1988 and 1993 was for a decrease in most local authority areas.
Local authorities: estimated annual notification rates/100 000, excluding Greater London, and restricted to those authorities with 15 cases or more and with rates of 15.0/100 000 or more in either 1988 or 1993, with 1993 population data
NOTIFICATIONS BY LOCAL AUTHORITY GROUPS
Table 4 shows the 403 local authorities grouped according to type, area and population size for 1988 and 1993. The 13% of the population living in Greater London provided 28% of the total notifications in 1988 and 34% in 1993. The 22% of the population in the metropolitan areas outside London provided 31% of the total notifications in both years. Thus in 1988 the 65% of the population in non-metropolitan areas provided the remaining 41% of the notifications, falling to 35% by 1993. In 1988 the percentage of notifications in people of white ethnic origin was 87% in the local authority areas with populations of less than 75 000 compared with 36% and 50% in Greater London and in the other metropolitan counties, respectively. By 1993 the proportion of notifications in people of white ethnic origin in the local authorities with populations of under 75 000 had declined to 82%, and in Greater London and other metropolitan counties to 31% and 41%, respectively. In both 1988 and 1993 the highest proportions of Indian patients (44% in 1988, 42% in 1993) were resident in Greater London, whereas the greatest proportion of Pakistani and Bangladeshi patients were resident in the other metropolitan counties (47% in 1988, 53% in 1993). In 1983, 1988 and 1993, 74%, 70% and 72% of notifications, respectively, in people of ISC ethnic origin occurred in residents of either Greater London or the other metropolitan counties. The comparative figures for people of white ethnic origin were 50%, 47%, and 52%.
Patients notified in the six month survey periods by area and main ethnic group and estimated annual rates for 1988 and 1993
The varying trends in geographical distribution can be seen more clearly if all 403 local authority areas are stratified by comparison with the national rate (table 5). The number of districts with below national average notification rates have increased over the three surveys, and those districts with no notifications have trebled since 1983. Those areas with rates four times the national average, however, have doubled between 1983 and 1993, with a lesser rise in those with rates between two and four times the national average notification rate.
Comparison of estimated annual rates in the 403 local authority areas of England and Wales in the 1983, 1988, and 1993 surveys
DURATION OF STAY IN THE UK BY REGION FOR THE ISC ETHNIC GROUP
In both 1988 and 1993 there were considerable differences in the notification rates for the population of the ISC ethnic group between those born in the UK and those born abroad, with much higher rates for those recently arrived in the UK than for those who had been resident in the country for more than five years.4 5 Table 6 shows the notification rates in those born and those not born in the UK and the time since first entry for those regions with more than 25 notifications in the Indian or Pakistani and Bangladeshi ethnic groups. The overall rates generally decreased between the surveys in the Indian group but generally increased in the Pakistani and Bangladeshi group.
Rates of tuberculosis notifications (per 100 000 population) in the six month survey periods of 1988 and 1993 by birthplace (UK or abroad) and number of years since first entry and region of residence (only regions with more than 25 notifications of Indian or Pakistani/Bangladeshi ethnic origin have been presented)
Although the rates amongst those born in the UK are relatively low, they are increasing in some areas—for example, the rates have more than doubled among the Indian group between the surveys in Greater London and for the Pakistani and Bangladeshi group in the North West.
The highest rates are seen in recent immigrants into the UK among whom the rates have generally increased between 1988 and 1993, especially within the Pakistani and Bangladeshi group. As most of these rates are essentially based on low numbers, changes in any group within one region should be interpreted with caution.
Discussion
The marked variation in tuberculosis notification rates in different parts of England and Wales reported in previous surveys3 7 was also seen in both 1988 and 1993, and in some respects has become more pronounced. The 1988 survey4took place shortly after the nadir of notifications in 19876 and that of 19935 after the increase in notifications seen between 1987 and 1990 had levelled off. Analysis by region shows that the rate of tuberculosis declined in all regions between 1983 and 1988, but that whilst the decline continued in most regions in 1993, there were increases in some regions including the West Midlands (10%), North West (9%), Northern (11%), and within the South East region, particularly in Greater London (30%).
More detailed analysis of the 403 local authority areas, however, shows that most of the areas are still experiencing a decline. Those districts which are predominantly small, rural, or are in non-metropolitan areas generally have falling rates with an increasing number of areas reporting either no notifications or rates below national average. However, the number of districts with rates at least three times the national average increased, particularly in 1993. Thus, the distribution of tuberculosis is becoming increasingly uneven, with a small number of areas with very high rates and below average rates for most of the areas. The number of areas with either no cases or below average rates have increased progressively and, by 1993, 320 (79%) were experiencing rates below the national average of which 123 (31%) reported no cases in the survey period.
This analysis also highlights the continuing important contribution of patients belonging to the ethnic minority groups to tuberculosis notification rates. Those of non-white ethnic origin, who constitute 6.3% of the total population (ranging from 1.1% (Northern) to 21.6% (Greater London) in 1993), contributed 56% of the tuberculosis notifications. All regions showed an increase in the percentage of notifications in persons of non-white ethnic origin in 1993 compared with 1988, ranging from 13.6% of total notifications in Wales to 68.6% in Greater London.
The tuberculosis rates in the ISC ethnic population remain very strongly associated with place of birth and duration of residence in the UK, as well as to the age distribution of the population.4 Those born in the UK have the lowest rates, and those most recently arrived (less than five years) have the highest rates. This association was first reported over 20 years ago8 but remains important despite the overall fall in notification rates in ISC ethnic groups. Thus, the age distribution of the ISC ethnic group in a local authority area, the proportions born in the UK, and the time since first arrival of those born abroad will influence the overall rate of tuberculosis seen in that area.
The rates in the white population varied up to fourfold between regions in 1993 with some showing rising rates and others falling rates. The rates in the white population of the London boroughs did not show a correlation with the proportion of ISC smear and culture positive rate per 1000 000 in either 1988 or 1993, consistent with the findings in 1983. In 1988 there was no correlation between white population rates and non-white non-ISC smear and culture positive rate per 100 000, but there was a possible association in 1993. This possible association is difficult to interpret in terms of establishing causality because potentially important confounding factors such as recent immigration and poverty have not been taken into account. Although this report was not designed to consider deprivation, evidence from Liverpool,9 Leeds,10 London,11and England and Wales12 suggest that socioeconomic deprivation is a substantial factor in the rates of tuberculosis of all ethnic groups.
In view of the marked variation in tuberculosis rates seen across the country, the tuberculosis services in a district will need to reflect not only absolute numbers and rates, but the proportions from the different ethnic groups, the proportions of those born abroad, and the ways in which these various factors are changing.
Acknowledgments
The success of the 1988 and 1993 surveys was due to the co-operation of the more than 150 Medical Officers in Environmental Health (1988) and Consultants in Communicable Disease Control (1993), all physicians with an interest in thoracic medicine (over 400), and many other clinicians who also provided information; to tuberculosis nurses and health visitors, clinic staff, records officers and clerks in many chest clinics and hospitals; and to infectious disease clerks and other local authority staff. The 1988 survey was funded by the Medical Research Council and that of 1993 by the Department of Health and the Welsh Office.