Article Text

Abstract
BACKGROUND Bronchodilator reversibility testing is recommended in all patients with chronic obstructive pulmonary disease (COPD) but does not predict improvements in breathlessness or exercise performance. Two alternative ways of assessing lung mechanics—measurement of end expiratory lung volume (EELV) using the inspiratory capacity manoeuvre and application of negative expiratory pressure (NEP) during tidal breathing to detect tidal airflow limitation—do relate to the degree of breathlessness in COPD. Their usefulness as end points in bronchodilator reversibility testing has not been examined.
METHODS We studied 20 patients with clinically stable COPD (mean age 69.9 (1.5) years, 15 men, forced expiratory volume in one second (FEV1) 29.5 (1.6)% predicted) with tidal flow limitation as assessed by their maximum flow-volume loop. Spirometric parameters, slow vital capacity (SVC), inspiratory capacity (IC), and NEP were measured seated, before and after nebulised saline, and at intervals after 5 mg nebulised salbutamol and 500 μg nebulised ipratropium bromide. The patients attended twice and the treatment order was randomised.
RESULTS Mean FEV1, FVC, SVC, and IC were unchanged after saline but the degree of tidal flow limitation varied. FEV1 improved significantly after salbutamol and ipratropium (0.11 (0.02) l and 0.09 (0.02) l, respectively) as did the other lung volumes with further significant increases after the combination. Tidal volume and mean expiratory flow increased significantly after all bronchodilators but breathlessness fell significantly only after the combination treatment. The initial NEP score was unrelated to subsequent changes in lung volume.
CONCLUSIONS NEP is not an appropriate measurement of acute bronchodilator responsiveness. Changes in IC were significantly larger than those in FEV1and may be more easily detected. However, our data showed no evidence for separation of “reversible” and “irreversible” groups whatever outcome measure was adopted.
- chronic obstructive pulmonary disease
- bronchodilator
- reversibility
- end expiratory lung volume
- flow limitation
Statistics from Altmetric.com
- chronic obstructive pulmonary disease
- bronchodilator
- reversibility
- end expiratory lung volume
- flow limitation
Chronic obstructive pulmonary disease (COPD) is characterised by airflow limitation which varies little over several months of observation or after treatment.1 ,2 The assessment of airflow limitation usually relies on spirometric testing and, in particular, the forced expiratory volume in 1 second (FEV1) which is the usual outcome measure in diagnostic bronchodilator reversibility testing.3 Although useful diagnostically and prognostically,4 spirometric abnormalities are poor descriptors of the severity of breathlessness in COPD.5Likewise, significant changes in FEV1 after inhaled bronchodilators are not necessary for improvement in exercise performance or dyspnoea to occur.5-7 Two alternative techniques of measuring lung mechanics relatively easily are now available. Both are better correlates of breathlessness than FEV1, but their reproducibility and sensitivity to change in response to bronchodilator drugs has not been assessed—an important consideration if they are to be of practical value.
The application of negative expiratory pressure during tidal breathing (the NEP technique) is a simple and rapid way of assessing the presence of flow limitation during tidal respiration which overcomes the problems of gas compression artefacts and variations in the preceding volume history of the manoeuvre.8 The degree of tidal flow limitation correlates with the severity of everyday breathlessness using the MRC scale.9 One study has reported that tidal flow limitation was unchanged after a moderate (400 μg) dose of inhaled salbutamol in patients with resting flow limitation,10 but the effects of higher doses of this drug or other bronchodilators have not been examined.
Pulmonary hyperinflation during spontaneous breathing is common in advanced COPD, relates well to the intensity of dyspnoea during exercise,11 and can be reproducibly detected using the inspiratory capacity manoeuvre.12 Inhaled β agonists and anticholinergic agents reduce exercise induced dynamic hyperinflation.6 ,7 Measurements of expired lung volume such as the forced and relaxed vital capacities also improve after bronchodilators, suggesting a fall in residual volume, but how these changes relate to those in inspiratory capacity (IC) is less certain.
The major diagnostic difficulties with spirometric based reversibility testing occur in patients with a low baseline FEV1 where changes after the bronchodilator drug fall within the spontaneous reproducibility of the measurement.13 In these individuals hyperinflation is present at rest and tidal flow limitation is more likely to be present when the subject is seated,8increasing the chance of a positive signal using these variables after a bronchodilator test. Our previous studies have suggested that acute bronchodilator responsiveness in COPD is a continuous variable.14 We hypothesised that changes in the degree of hyperinflation and in tidal flow limitation would be as reproducible as those in FEV1 and would separate potential responder groups for future treatment trials. To test this, we have conducted a single blind randomised placebo controlled trial of nebulised β agonists and anticholinergic drugs measuring both pulmonary hyperinflation and tidal flow limitation in a group of patients with more severe COPD than reported previously. Additionally, we have measured the relaxed or “slow” vital capacity to assess whether this more readily available measurement showed equivalent sensitivity to change after active drugs to those seen with the newer measurements of resting lung mechanics.
Methods
SUBJECTS
Twenty patients (15 men) with severe COPD participated in the study. All had been cigarette smokers of >20 pack years, had a clinical course consistent with the disease, and met the BTS criteria for diagnosis and classification of disease severity.15None had clinical or radiographic evidence of bronchial asthma, bronchiectasis, or neoplasia, nor of significant cardiovascular/neuromuscular disease which would affect their resting sensation of breathlessness or their pulmonary function results. All had been free of respiratory tract infection for at least 4 weeks. Short acting inhaled bronchodilators were omitted for 6 hours, long acting inhaled bronchodilators were omitted for 12 hours, and oral theophyllines were omitted for 24 hours prior to testing and caffeinated beverages were avoided for 6 hours. All were recruited from the respiratory outpatient clinics of the University Hospital Aintree and gave their informed consent to the study which was approved by our institutional ethics committee.
PROTOCOL
Each patient attended the Pulmonary Physiology Laboratory on two occasions at the same time of day. At the first visit they were randomly allocated to one of two groups, A or B, to determine the order in which they would receive their bronchodilator drugs. They completed a St George's Respiratory Questionnaire to assess their health status16 and resting arterial blood gas tensions were measured seated breathing room air. At each attendance spirometric parameters were recorded after the patient had been sitting quietly for at least 5 minutes, followed by measurement of IC and slow vital capacity (SVC), mean inspiratory and expiratory mouth pressures, thoracic gas volume, resting breathing pattern, and finally NEP testing (see below). Before each test period the intensity of breathlessness was graded using a modified Borg category scale17 in response to the question: “How breathless are you feeling?” Each patient received 2.5 ml normal saline via a wet nebuliser (Sidestream Disposable Nebuliser, MedicAid Ltd, UK) at flow rate of 5 l/min for 5 minutes. After 15 minutes' rest this assessment protocol was repeated. Patients in group A were then given 5 mg salbutamol via the nebuliser at the same flow rate as the saline. After a further 15 minutes all measurements were repeated. Group A subjects finally received 500 μg ipratropium bromide nebulised as before and then repeated their measurements 45 minutes later. Patients in Group B received saline, followed by nebulised ipratropium with measurements made after 45 minutes, then nebulised salbutamol with final measurements made 15 minutes after this.
On the second day the same protocol was followed but the order of the bronchodilators was reversed.
PHYSIOLOGICAL MEASUREMENTS
Spirometry
FEV1 and forced vital capacity (FVC) were measured using a 1 litre dry rolling seal spirometer (MedGraphics, Minnesota, USA), the best FEV1 and FVC values from reproducible measurements being reported as recommended by the ATS.18 ,19 Normal values were those of the ECSC.20 At the time of their first visit a maximum flow-volume manoeuvre was recorded after a period of quiet breathing and with the equipment software a tidal loop was positioned relative to the maximal loop using the IC manoeuvre. The resulting plot was printed to determine whether the resting tidal loop exceeded the maximum flow-volume envelope.
Inspiratory capacity/slow vital capacity
These were measured using the same spirometer as above. After four normal tidal breaths the patient inhaled to total lung capacity (TLC) from their spontaneous end expiratory lung volume (EELV), paused for 1 second, then exhaled slowly to functional residual capacity. This manoeuvre was repeated until two values corresponded to within 5% of each other.
Thoracic gas volume/total lung capacity
These were measured in the MedGraphics constant volume body plethysmograph and required subjects to pant against a closed mouthpiece supporting their cheeks. Thoracic gas volume and TLC were calculated using the commercial software supporting this equipment. Knowing the TLC, the EELV could be determined from the equation:
EELV = TLC − IC
Mean inspiratory and expiratory mouth pressures
These were measured according to the method of Black and Hyatt.21 Three measurements of each were made and the best of the three recorded.
BREATHING PATTERN
After 3–4 minutes of stable breathing a 30 second period of tidal breathing was recorded on the NEP circuit (Raytech Instruments, Vancouver, Canada) (see below) and displayed on the computer screen. Inspiratory and expiratory times (Ti, Te), the total time cycle time (Ttot), and tidal volume (Vt) were measured using the customised software. The duty cycle (Ti/Ttot) and mean inspiratory and expiratory flows (Vt/Ti and Vt/Te) were derived from these data.
NEP METHOD FOR MEASURING EXPIRATORY FLOW LIMITATION
The testing method and the protocol used are similar to those described elsewhere.8 ,9 ,22 The NEP circuit comprised a flanged mouthpiece in series with a pneumotachograph (Aeromech Devices, Ontario, Canada) and a Venturi device (Aeromech Devices), one end of which was open to the atmosphere, the other connected to the cone of the heated pneumotachograph (3700 series, Hans Rudolph Inc, Kansas City, USA). A side port on the Venturi device was connected via an electrically operated solenoid valve (Aeromech Devices) to a source of compressed air using rigid tubing. A pressure regulator connected to the source of compressed air could be adjusted to set the NEP to the required level of –5 cm H2O. The solenoid valve was controlled by a computer (Raytech Instruments Inc, Vancouver, Canada) using customised software to activate the pressure source 0.2 seconds after the onset of expiration and to remain activated for a preset period. This period was equal to the length of tidal expiration of each individual subject. Airflow was measured from the pressure drop across the pneumotachograph screen using a differential pressure transducer (Raytech Instruments Inc) calibrated before each subject's visit with a water manometer. These signals were amplified, filtered, digitised, analysed, and displayed on a computer screen. Volume was obtained by numerical integration of the flow signal. Flow and volume could be continuously monitored on screen during the study, which permitted monitoring of breathing stability and timing of the NEP test. By constantly monitoring flow and volume, leaks could be identified visually.
Procedure
With the patient in a seated position with a nose clip in place, tidal breathing was recorded for 30 seconds after acclimatisation and the duration of tidal expiration was calculated. A series of test NEP breaths was performed using an NEP of –5 cm H2O until the patient became accustomed to the procedure. Each NEP period was equal to the duration of the previous tidal expiration and was triggered 0.2 seconds after the onset of expiration. NEP was only applied once a steady state of tidal breathing was reached, and when air leaks could be confidently excluded.
Analysis of flow limitation was made by superimposing the expiratory limb of the flow-volume loop in the presence of NEP on the expiratory limb of the preceding breath. If flow could be increased by the application of NEP, then the patient was not flow limited. In preliminary studies we noted significant breath to breath variability in flow limitation in some subjects so only the first pair of breaths at each measurement was analysed. The degree of flow limitation was scored according to the amount by which the two expiratory limbs overlapped so that the period of flow limitation was expressed as a percentage of the control breath, as described elsewhere.8We then divided these percentages into three groups (0, 1, and 2) where 0 = no flow limitation at all during expiration (0%), 1 = partial flow limitation (>0% but <100%), and 2 = complete flow limitation (100%).
STATISTICAL ANALYSIS
Data are expressed as mean (SE) unless otherwise stated. Statistical analysis of the physiological measurements before and after saline, and each bronchodilator alone and in combination was made using analysis of variance (ANOVA). A p value of <0.05 was taken to be of statistical significance. Comparisons between the same variables on different occasions were made using the method of Bland and Altman. 95% agreement limits for each pulmonary function variable after placebo inhalation were calculated as previously described.23 Comparisons between subgroups defined by flow limitation were made using analysis of variance while Borg dyspnoea scores were tested non-parametrically (Wilcoxon signed rank test).24
Results
DEMOGRAPHIC DATA
Demographic data for the patient population studied is shown in table 1. They were an elderly group with severe airflow limitation, significantly raised lung volumes, and markedly impaired health status. All individuals had tidal flow limitation which exceeded the maximum flow-volume envelope as measured in the body plethysmograph. However, on NEP testing when seated, eight individuals had no flow limitation, six had partial flow limitation, and six had complete flow limitation at rest. The demographic features of each of these subgroups are also shown in table 1. NEP testing was poorly reproducible when repeated within a few breaths of the first test. Only 12 individuals had a consistent degree of tidal flow limitation, which worsened in two and decreased in six. All subsequent NEP data are reported on the first breath results.
Mean (SE) baseline demographic data for the 20 subjects with COPD studied
REPRODUCIBILITY
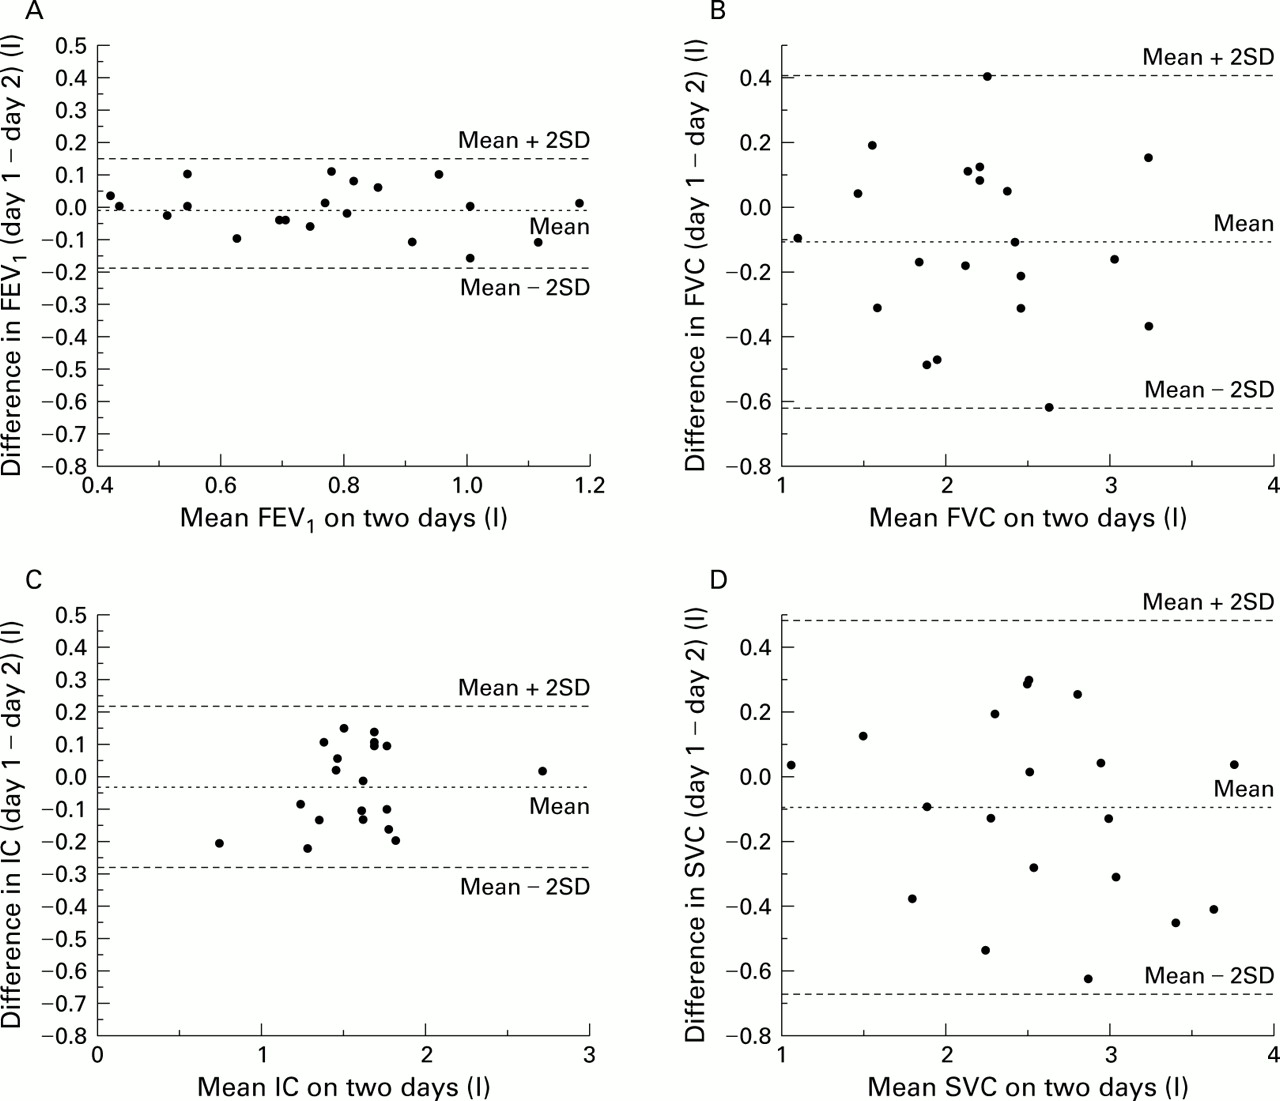
Short term reproducibility data are presented in fig 1 for the principal flow and volume measures in the form of Bland-Altman plots. These demonstrate relatively narrow 95% agreement limits with no evidence of a relationship between the baseline value and the reproducibility of the measurement. The mean (SE) between day reproducibility (mean of the differences between each of the baseline measurements on the two days of testing) of the FEV1, FVC, IC, and SVC was 0.06 (0.01) l, 0.23 (0.04) l, 0.07 (0.04) l, and 0.16 (0.06) l, respectively. The mean change in TLC after saline was 0.58 L with wide 95% confidence intervals (–2.04 to +1.79). The NEP data were less reproducible with 12 subjects remaining the same, four showing less tidal flow limitation, and four showing more tidal flow limitation on repeat testing on the second day. These changes showed no consistent relationship with measured IC or breathing pattern.

Bland-Altman plot of mean baseline values for each subject on two days plotted against the difference between the baseline values on the two days. Broken lines represent the mean and 2 standard deviations either side of the mean of the differences between baseline values. (A) forced expiratory volume in one second (FEV1), (B) forced vital capacity (FVC), (C) inspiratory capacity (IC), (D) slow vital capacity (SVC). The 95% agreement limits for all measurements are narrow.
BRONCHODILATOR RESPONSE
Group mean (SE) bronchodilator responsiveness data are shown in fig 2A and compared with the changes after saline. Significant (p<0.001) increases in FEV1 occurred after both salbutamol and ipratropium and a further significant increase (p<0.05) compared with the value after a single agent was seen when the two groups were combined, irrespective of the order in which they were given. This was also the case for IC (fig 2B). There were no significant differences in the magnitude of change after either drug given singly or in combination, irrespective of the different timings of the treatment. Similarly, significant changes in IC, FVC, and SVC were seen and similar changes occurred irrespective of the measure used to assess them (table 2). The FEV1/FVC and FEV1/SVC ratios were not significantly changed after either saline or any bronchodilator given singly or in combination. The number of individuals exceeding the 95% confidence interval for the measurements after both bronchodilators are shown in fig 3 where FEV1and IC data are compared. Using a change of 12% baseline as representing reversible disease, on 29 occasions subjects would be classified as reversible on FEV1 criteria while a change beyond the immediate reproducibility of the IC test was seen on 27 occasions.

(A) Mean (SE) changes in forced expiratory volume in one second (FEV1) after placebo and active drug, singly and in combination. SAL1 and SAL2 = saline (placebo) on days 1 and 2, respectively, S = salbutamol, I = ipratropium. Day 1 is the day on which salbutamol was the active drug which was given first (solid lines); day 2 is the day on which ipratropium was given first (broken lines). (B) Data for inspiratory capacity measured at the same time as the FEV1 and with the same conventions.
Mean (SE) changes in respiratory parameters after saline on two days and after salbutamol and ipratropium alone and in combination on each of the two days tested

Changes in (A) forced expiratory volume in one second (FEV1) and (B) inspiratory capacity (IC) after the combination bronchodilator on both days plotted as the absolute change against the change as a percentage of baseline value with each subject providing two data points, one for each day of testing (n=40). r2 = 0.648 for FEV1 and r2 = 0.905 for IC. Two lines have been superimposed on these plots, representing a percentage change of 12% and an absolute change of 200 ml for FEV1 and 213 ml for IC. The value of 213 ml represents the group mean increase in IC seen after saline (placebo) in our study. 200 ml and 12% are the values recommended by the ATS for satisfaction of FEV1 reversibility criteria. Few subjects are irreversible using these criteria.
The bronchodilator drugs had a variable effect on resting tidal flow limitation. Figure 4 shows tidal flow-volume loops in the presence of NEP superimposed on the preceding loop in the absence of NEP in patient 3. In fig 4A subject 3 is non-flow limited before nebulised salbutamol but in fig 4B flow limitation has occurred after nebulised salbutamol. Despite this, expiratory flow increased significantly after salbutamol. In nine individuals flow limitation was reduced after the single dose of bronchodilator and in seven after the combination of the two drugs. However, the number of individuals in whom this occurred was significantly different if the post saline data were used instead. Of the nine who became less flow limited after a single agent, seven became more flow limited after adding a second bronchodilator and two remained the same. None became less flow limited after the addition of a second agent. Post-bronchodilator NEP did not predict those who showed the greatest changes in FEV1 or IC with bronchodilator drugs, alone or in combination.

Negative expiratory pressure (NEP) traces of a typical subject (subject 3). Flow and volume are plotted against each other on the y and x axes respectively, both in the absence and the presence of NEP. The arrows denote the points at which NEP is applied and removed. (A) NEP trace after saline showing no flow limitation at any point during expiration. (B) NEP trace of the same subject after 5 mg nebulised salbutamol showing flow limitation throughout the whole of expiration. Despite the flow limitation there is a significant increase in the expiratory flow rate and in tidal volume from 0.79 to 0.89 litres.
The breathing pattern analysed at rest and the changes produced by the single and combination bronchodilator drugs are shown in table 3. Data for both the β agonists and anticholinergic drugs were combined as they showed no significant differences when analysed separately. There were no changes in the timing or frequency of respiration after any of the bronchodilator drugs, but there was a significant increase in the tidal volume representing a rise of 12.7% and 15.5% from the baseline breathing pattern after single and combination bronchodilator treatment, respectively. Mean inspiratory flow (Vt/Ti) did not change after the bronchodilators but mean expiratory flow (Vt/Te) showed significant improvements after each drug singly and in combination, but not after normal saline. When taken with the changes in EELV, the resultant changes in EILV were –0.24 (0.15) l and –0.41 (0.19) l after the single and combination bronchodilators, respectively. There were no significant differences in the measurements of inspiratory or expiratory muscle strength at any point during the testing, but there was a significant fall in mean (SE) perceived breathlessness from 3.4 (0.4) to 1.8 (0.3) after the combination treatment but not after treatment with a single agent (p<0.05). These changes in resting breathlessness were not correlated with those in IC, FEV1, SVC, or any other volume based derivative.
Mean (SE) changes in breathing pattern after placebo (saline), a single bronchodilator drug (either salbutamol or ipratropium but with data from both days combined, n=40)) and both drugs in combination
Discussion
Bronchodilator reversibility testing is an important way of excluding a significant asthmatic component in patients with COPD but is relatively ineffective at predicting symptomatic benefit in severe disease.5 ,6 Our data, together with those of others,10 ,25 suggest that significant changes in IC and hence pulmonary hyperinflation occur after both β agonists and anticholinergic drugs. These changes were not accompanied by reproducible improvements in tidal airflow limitation nor did the presence of tidal flow limitation predict the changes in EELV or dyspnoea occurring after the bronchodilator. Changes in EELV were paralleled by those in SVC and FVC and were associated with improvements in tidal volume, which were larger when combination bronchodilator drugs were given. Unlike the NEP results, all volume related variables showed a continuous response to bronchodilators with no sign of a clear break between responders and non-responders. These data show that current physiological end points for reversibility testing are either insufficiently reproducible to give a reliable baseline value or are unable to identify “responder” subgroups, at least in patients with severe disease.
Our data have a number of strengths and limitations. Unlike previous studies we have included both a saline placebo comparison with our bronchodilator data and a randomised design. We used doses of bronchodilator high on the known dose-response relationships to ensure a maximum effect26 ,27 and standardised the volume history and timing of all respiratory manoeuvres to diminish the effect of variation in the end expiratory pause on the expiratory flow rate.28 Our findings are confined to patients with severe disease (<35% predicted FEV1), partly because previous studies have shown more variable degrees of tidal flow limitation in patients with moderate disease8 and also because we felt such patients will be the most likely to be “irreversible”. We did not re-test our patients in the supine posture as we thought this likely to be impractical in clinical practice. Our measurements of flow and volume were very reproducible within individuals with a similar short term variability to that reported in severe COPD7and in patients with less marked airflow limitation.29
All of our patients had flow limitation when assessed conventionally using the maximum flow-volume envelope and without allowing for the effects of gas compression. We did not select them on the basis of pre-existing tidal flow limitation but because of the severity of FEV1 assessed on normal spirometric tests. Like other studies,8 ,9 we found that true tidal flow limitation was not present in most patients on NEP testing. However, despite the advantages of this type of assessment, we were disappointed to see that both the immediate and between day reproducibility of this measurement was inconsistent in patients of this severity studied in the seated position. This may reflect the fact that patients with more severe disease exhibit more dynamic regulation of their EELV than is the case in other subjects, even though there is no difference in baseline breathing pattern or IC on the different days. A variable effect of the small system dead space or the enhanced contribution of the abdominal muscles during quiet breathing may explain why, under some circumstances, the degree of tidal flow limitation varied. This has practical problems in terms of establishing a baseline for individual bronchodilator reversibility testing. In contrast, the measurements of lung volumes were more reproducible, those of FEV1 being within the reported range for this measurement7 ,13 while both SVC and FVC as well as IC measured from FRC were acceptable and consistent. The reproducibility of these volume based tests was equivalent to that of forced expiratory manoeuvres and broadly similar within individuals. Only when two inherently variable numbers (TLC and IC) were used to derive a third (EELV) did the variability become unacceptable. This problem has been noted previously when using derived lung volumes.30
The effects of the high dose nebulised bronchodilator drugs were very consistent. Although the drugs were given at different times and operate by different pharmacological mechanisms, there were no significant differences between the bronchodilator responses assessed by changes in IC or in any measure of expired volume after the β agonist or the anticholinergic agent. Post bronchodilator values were fivefold greater than the mean change seen after nebulised saline. As noted previously with inhaled ipratropium,7 neither the FEV1/FVC nor FEV1/VC ratios were affected by high doses of nebulised bronchodilators, which suggests that the increase in FEV1 resulted primarily from a fall in the operating lung volume. Addition of the second drug consistently produced further improvements in IC and lung emptying. The volumetric response was consistently greater than that after a single bronchodilator alone. Using the data derived from the short term reproducibility measurements, 29 of 40 measurements would be considered reversible on FEV1 criteria and 27 on the basis of IC. However, these data do not show a definite threshold of response and, when examined over the 2 days of the study, all subjects showed an improvement in one or more variable after the combined bronchodilators. In contrast, the changes in tidal flow limitation given the variable baseline were very modest and in keeping with those reported by Tantucci et al 10 after a single smaller dose of inhaled salbutamol in patients with less severe COPD. The presence of complete tidal flow limitation did not preclude a relatively large change in EELV after the combination bronchodilator in these patients, which confirms that factors other than tidal flow limitation determine EELV in patients with advanced COPD. These data are the first to test directly the alternative hypothesis that a “poor response” to a bronchodilator is confined to patients without resting flow limitation10 ,31 and, again, no clear pattern of response was seen.
Changes in the breathing pattern were not seen after nebulised saline but consistent improvements in tidal volume did occur after both anticholinergic and β agonist drugs. This initial increase in tidal volume amounted to approximately 50% of the change in EELV after the single bronchodilator, thereby reducing the change in EILV. Larger changes in tidal volume did not occur when the greater fall in EELV was seen after the combination drugs and on this occasion EILV was also reduced. In keeping with the data of Belman et al,6 it was at this point that the patients recorded a significant fall in the perceived level of resting breathlessness. The mean inspiratory flow (Vt/Ti), whether expressed as an absolute value or as a percentage of the vital capacity, was unchanged after the bronchodilator drug, suggesting that resting respiratory drive is well preserved in these individuals with resting tidal flow limitation or who are close to this state. However, we found consistent and highly significant improvements in mean expiratory flow after the bronchodilators, irrespective of the degree of tidal flow limitation. These data suggest that bronchodilators are acting to reduce the operating lung volume rather than resting inspiratory drive, in keeping with previous suggestions.31 The changes in EELV after nebulised bronchodilators were of similar magnitude to those seen during exercise and to changes in resting EELV in less severe patients treated with salbutamol alone.6 We believe that the improvements produced by the combination bronchodilators in our severe patients are likely to be translated into improved exercise performance.
The present data confirm the continuity of the bronchodilator response, however assessed, compared with placebo and this is seen even in patients who would be expected to have irreversible “flow limited” disease by conventional plethysmographic criteria. The separation of patients into “responders” and “non-responders” on the basis of short term spirometric changes is unlikely to be accurate whatever criteria or test is chosen. Despite the attractions of the NEP technique in objectively determining tidal flow limitation, it did not add further useful information when included as an outcome measure for bronchodilator testing, nor did it help to classify individuals who were likely to respond differently to treatment. In contrast, measurement of the IC was a useful guide as to when important changes in lung volume, associated with improvements in resting breathlessness, were likely to occur. It was as simple and reproducible as any of the other measures commonly reported. The improvements in EILV seen after a combination of high dose bronchodilators may explain why some individuals prefer wet nebuliser treatment to conventional metered dose inhalers32 as significant improvements in IC occurred even when the change in FEV1 would be considered barely significant. This technique may prove useful in assessing patients' suitability for home treatment with nebulised bronchodilators.
Acknowledgments
This work was supported in part by a EU collaborative BIOMED II grant and The Fazakerley Foundation for Respiratory Research.