Article Text

Abstract
BACKGROUND A national survey of tuberculosis was conducted in England and Wales in 1998 to obtain detailed information on the occurrence of the disease and recent trends. This survey also piloted the methodology for enhanced tuberculosis surveillance in England and Wales and investigated the prevalence of HIV infection in adults with tuberculosis.
METHODS Clinical and demographic data for all cases diagnosed during 1998 were obtained, together with microbiological data where available. Annual incidence rates in the population were estimated by age, sex, ethnic group, and geographical region using denominators from the 1998 Labour Force Survey. Incidence rates in different subgroups of the population were compared with the rates observed in previous surveys. The tuberculosis survey database for 1998 was matched against the Communicable Disease Surveillance Centre HIV/AIDS database to estimate the prevalence of HIV co-infection in adult patients with tuberculosis.
RESULTS A total of 5658 patients with tuberculosis were included in the survey in England and Wales (94% of all formally notified cases during the same period), giving an annual rate of 10.93 per 100 000 population (95% CI 10.87 to 10.99). This represented an increase of 11% in the number of cases since the survey in 1993 and 21% since 1988. In many regions case numbers have remained little changed since 1988, but in London an increase of 71% was observed. The number of children with tuberculosis has decreased by 10% since 1993. Annual rates of tuberculosis per 100 000 population have continued to decline among the white population (4.38) and those from the Indian subcontinent, although the rate for the latter has remained high at 121 per 100 000. Annual rates per 100 000 have increased in all other ethnic groups, especially among those of black African (210) and Chinese (77.3) origin. Over 50% of all patients were born outside the UK. Recent entrants to the UK had higher rates of the disease than those who had been in the country for more than 5 years or who had been born in the UK. An estimated 3.3% of all adults with tuberculosis were co-infected with HIV.
CONCLUSIONS The epidemiology of tuberculosis continues to change in England and Wales and the annual number of cases is rising. More than one third of cases now occur in young adults and rates are particularly high in those recently arrived from high prevalence areas of the world. The geographical distribution is uneven with urban centres having the highest rates. The increase in the number of cases in London is particularly large. Tuberculosis in patients co-infected with HIV makes a small but important contribution to the overall increase, particularly in London. To be most effective and to make the most efficient use of resources, tuberculosis prevention and control measures must be based on accurate and timely information on the occurrence of disease. A new system of continuous enhanced tuberculosis surveillance was introduced in 1999, based on the methodology developed in this national survey.
- tuberculosis
- national survey
- HIV co-infection
Statistics from Altmetric.com
National surveys of tuberculosis have been carried out in England and Wales every 5 years since 1978.1-4 These surveys have generally collected clinical, microbiological, and demographic data on notified cases for the first 6 months of the year and, in some, more limited data (on a restricted age group) in the second 6 months. The surveys have supplemented information on the incidence of tuberculosis from notifications and laboratory reports, permitting analyses of the trends in incidence in population subgroups defined by ethnic group and country of birth. The detailed information on the epidemiology of tuberculosis provided by the surveys has underpinned decisions on national treatment, control and prevention guidelines. A final survey was carried out in 1998 with the additional objective of piloting the methodology for a new system of continuous enhanced tuberculosis surveillance.
Methods
The survey was carried out by the Public Health Laboratory Service in collaboration with the British Thoracic Society and the Department of Health. The methodology of the survey differed from that used in previous surveys in certain key ways—namely, data were collected on all patients identified in the calendar year 1998, whether or not notified, and a coordinator was nominated by each district health authority with responsibility for ensuring that completed survey forms were collected and forwarded to the survey team at the Communicable Disease Surveillance Centre (CDSC), London.
Microbiological information, including drug susceptibility, on isolates reported to Mycobnet (the UK Mycobacterial Resistance Network, a surveillance system for all culture confirmed cases of tuberculosis) was matched by name and date of birth with the tuberculosis survey database. This supplemented the information provided by clinicians.
Matching was carried out between the 1998 tuberculosis survey database and the CDSC HIV/AIDS database, using previously described methodology,5 to estimate the extent of co-infection of tuberculosis and HIV in adults.
Population figures for England and Wales were obtained from the 1998 Labour Force Survey (winter quarter and 1998 local area database). Rates were not calculated for population subgroups of less than 10 000 as the relative standard errors would have been too large.6
In earlier surveys most analyses were of new (previously untreated) cases. Analyses of trends from 1988–98 used data from the earlier survey databases held at CDSC. To permit comparison, data from earlier surveys were re-analysed to include all patients, whether or not previously treated. As the earlier surveys had collected patient information for only 6 months in some age groups, these data were multiplied by scaling factors (as published previously4) to give annual estimates for comparison of trends. Numbers cited in this article for the 1988 and 1993 surveys are therefore the annual numbers.
The 1998 survey data were entered and held in Access 95 Version 7 software and exported to SPSS Version 10 (SPSS Inc, Chicago, Illinois) for analysis. Analysis of HIV prevalence was conducted using Access 95 Version 7.
Results
In all, 6032 cases of tuberculosis were formally notified during weeks 1–52 of 1998. A revised estimate (5876) of the total for the study period (1 January to 31 December 1998) was derived from figures provided by district coordinators which took into account local over- and under-notification. A total of 6400 survey forms was received, of which 343 were excluded on the basis of information on the form (230 patients received chemoprophylaxis only and 113 were diagnosed or notified outside the survey period). A further 399 were excluded after they were subsequently found not to have tuberculosis. Thus, 5658 patients were eligible for inclusion in the survey. This represented 94% of all those formally notified and 96% of the district coordinators' estimate.
A total of 3506 laboratory reports of tuberculosis isolates were reported to Mycobnet in 1998; 629 of these could not be matched with patients on the survey database. Insufficient information was available at the time of the survey to determine their eligibility so they were excluded. A subsequent audit of Mycobnet reports for 1998 carried out in 2000 (PHLS, unpublished data) determined that half of those reports for which information could be obtained would not have been eligible for inclusion in the survey—for example, patients notified outside the survey period or not resident in England and Wales.
Four hundred and forty five patients (7.9%) had been previously treated and 98 (1.7%) were known to have been diagnosed post mortem. The overall annual rate of tuberculosis in England and Wales was 10.93 per 100 000 (95% CI 10.87 to 10.99).
AGE AND SEX
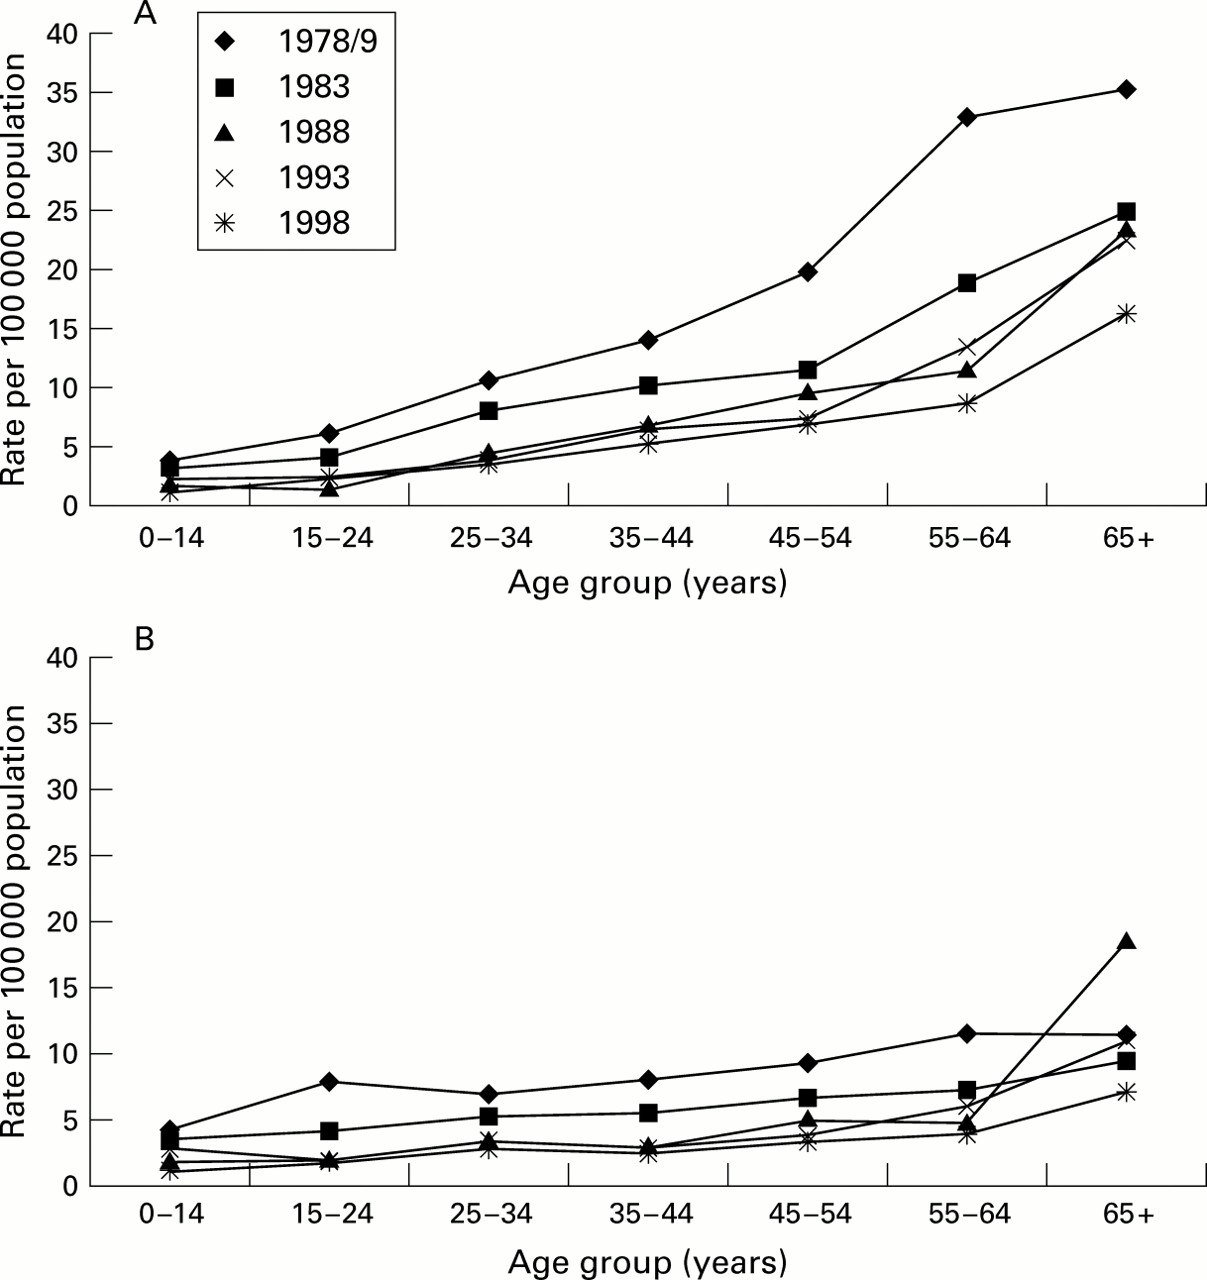
The greatest numbers of cases were reported in those aged 15–34 years, followed by the 35–54 and 55–74 age groups (fig 1A). More cases overall were reported in males in all age groups, except in children where similar numbers were reported in boys and girls (fig1A). The number of male patients was equal to or greater than the number of females in all but the Indian subcontinent (ISC: India, Pakistan and Bangladesh) ethnic group in which there were more females (fig 1B–D).

Age and sex distribution of proportion of patients with tuberculosis and rate of disease in (A) all patients (n=5653), (B) patients from the Indian subcontinent (ISC, n=2137), (C) white patients (n=2106), and (D) black African patients (n=743).
The lowest annual rates per 100 000 were seen in children (<15 years of age): males 3.5 (95% CI 3.4 to 3.6); females 3.7 (95% CI 3.6 to 3.7). In all the adult age groups males had higher rates than females (fig 1A). In males the annual rate per 100 000 generally increased with increasing age, peaking in the elderly (>74 years) at 24.5 (95% CI 23.7 to 25.3). In contrast, the annual rate in females was highest in the 15–34 year age group and did not increase in the elderly. These overall rates (fig 1A) hide substantial differences in age specific rates in ethnic subgroups of the population (fig 1B–D).
ETHNIC GROUP
In 1998 38% of patients with tuberculosis were reported from the ISC ethnic group. The proportion of white patients was also 38%, and 13% of patients were of black African ethnic origin (table 1). As in previous surveys, the numbers of cases in both the black Caribbean and Chinese ethnic groups have remained small,7 comprising 2.2% and 1.8% of all cases, respectively. The highest annual rate per 100 000 was observed in the black African ethnic group (over 200), and an increased rate since the last survey was seen in the Chinese ethnic group which was nearly three times higher than the rate for those of black Caribbean origin. Rates in the white ethnic group were low (less than 5), while rates in the ISC ethnic group have remained high (over 100).
Annual number of patients with tuberculosis and rate of disease in England and Wales by ethnic group
Place of birth and year of entry to the UK
Fifty six per cent of patients were born abroad compared with 45% in 1988 and 50% in 1993 (data not shown). Of those born in the UK, most (77%) were of white ethnic origin. Most of those born abroad were of ISC ethnic origin (56%). Of all patients with known year of entry, 60% had been in the UK for longer than 5 years; 57% of patients of black African ethnic origin born abroad (where year of entry was known) were recent entrants to the UK (during the 5 years before the survey), whereas only 32% of ISC patients were recent arrivals (table2).
Number of patients with tuberculosis and rate of disease by place of birth, year of entry to the UK, and ethnic group in England and Wales, 1998
For all ethnic groups except black Caribbean the rates of tuberculosis were highest in those born abroad who had recently entered the UK, about one third lower in those born abroad but who had been in the UK for more than 5 years, and lowest in those born in the UK. Patients of ISC ethnic origin had the highest rates of all those born in the UK. The proportion born abroad for whom year of entry was unknown ranged from 22% (in the ISC ethnic group) to 39% (white ethnic group); had these patients' year of entry been known, corresponding rates of disease may have been higher than stated in table 2.
Geographical distribution
Of all cases reported, 40% were from London. The annual rate per 100 000 in London (31.6 (95% CI 31.2 to 32.1)) was four times the rate for the rest of England and Wales (7.65 (95% CI 7.61 to 7.70)). Annual rates for the remaining regions ranged from 4.22 (95% CI 4.16 to 4.29) in the Eastern region to 11.9 (95% CI 11.7 to 12.0) in the West Midlands (table 3). Ten of the 15 district health authorities with more than 100 cases and/or an annual rate of >25 per 100 000 were in London (table 3).
Number of patients with tuberculosis and rate of disease by NHS region and in district health authorities in England and Wales with more than 100 patients with tuberculosis and/or a rate of >25 per 100 000 in 1998
TRENDS IN NUMBER OF CASES AND ANNUAL RATES OF DISEASE, 1988–98
The total number of patients with tuberculosis in 1998 (5658) represents an increase of 11% since the last national survey in 1993 and 21% since the survey in 1988. Annual rates of disease have also increased (table 1).
Age group
After an increase of 42% between the 1988 (286 patients) and 1993 surveys (407 patients), the number of children with tuberculosis decreased to 365 in 1998. The number of children with tuberculosis in London, however, has doubled since 1993 (to 90 patients). The number of elderly patients (over 74 years) showed little change between 1988 and 1998 (from 546 to 551). Other age groups (15–34, 35–54, 55–74 years) showed an increase in numbers of patients over the last decade which was greatest in the 15–34 year age group (1428 in 1988; 1554 in 1993; 1977 in 1998).
Ethnic group
The proportion of patients from the white ethnic group declined from 54% in 1988 and 44% in 1993 to 38% in 1998. The proportion from the ISC ethnic group has not changed appreciably (from 38% in 1988 to 41% in 1993 and 38% in 1998). The proportion of patients in the black African ethnic group, however, has risen from 1.7% to 7.0% and 13% in 1988, 1993, and 1998, respectively. The number of patients from the black Caribbean and Chinese ethnic groups decreased slightly between 1988 and 1993. Between 1993 and 1998 the numbers of patients of black Caribbean origin increased slightly, and those of Chinese ethnic origin increased by a factor of 2.5.
The rate in the black Caribbean ethnic group did not change substantially between 1988 and 1998. In the ISC population the rate declined slightly, although it was 30 times higher than the rate for the white ethnic group in 1998. During the same period the rate for patients from the black African ethnic group increased by about a factor of three. The decline in the rate in the ISC population and the rise in the rate in the black African ethnic group remained even after standardising to the 1988 population, taking into account age, place of birth, and year of first entry to the UK (data not shown). More detailed analysis of the contribution of different demographic factors will be carried out separately.
Decline in the rate in the white population in England, 1978–98
The annual rate of disease in the white ethnic group has continued to decline with each survey between 1978 and 1998 (fig 2). The general trend of increasing rate with age persisted in both male and female patients, and was more marked in males. In females the rate per 100 000 only rose above 5 for those aged 65 years and over while in males this rate was reached by 35 years of age, increasing by a factor of three for men over 65 years.

Rate of tuberculosis in the white ethnic group in England from 1978 to 1998 by age group in (A) male and (B) female patients.
Geographical distribution
With the exception of London, little change in the number of patients with tuberculosis has been observed in the NHS regions of England and Wales over the last decade. In London 927 more patients (an increase of 71%) were reported in 1998 than in 1988, accounting for much of the total increase in the number of patients between the two surveys. The annual rate per 100 000 in London rose from 19.9 in 1988 to 31.6 in 1998.
There were urban areas other than London such as Leicester and Blackburn where the annual rates of tuberculosis were in the range of 30–50 per 100 000. However, although the rate in Leicester was greater than that for London, it has declined since 1988 (data not shown). Most of the high incidence urban areas outside Greater London had lower rates of tuberculosis in 1998 than in 1993.7Only two showed substantial increases (Sandwell and Kirklees; data not shown).
SITE OF DISEASE
The site of disease was known for 5625 (99%) patients. The proportion of patients with pulmonary disease (with or without extrapulmonary tuberculosis) decreased from 67% in 1988 to 63% in 1993 and 62% in 1998. The proportion of patients with extrapulmonary disease alone increased to 38% from 33% in 1988 and 37% in 1993. Nine per cent of patients had both forms of disease (mediastinal glands and pleural effusion were considered extrapulmonary tuberculosis). A smaller proportion of children (49% of 358) than adults (63% of 5262) presented with pulmonary tuberculosis, while extrapulmonary disease alone was more common in children (51% v37%). The proportion of patients with pulmonary tuberculosis increased with increasing age, reaching 78% in patients aged over 74 years. Detailed results for site of disease will be reported separately.
DIAGNOSIS
A positive culture was reported on specimens from 60% of all patients (66% of those with pulmonary disease; 50% with extrapulmonary disease only) compared with 59% in 1988. The proportion with a positive culture was much lower in children (0–14 years) than in adults (22% v 62%). A smear positive result for sputum was obtained for 27% of all patients, or 43% of patients with pulmonary disease.
In 1.6% of all cases (92/5658) the laboratory support for the diagnosis was based on histological examination alone, mostly in patients with extrapulmonary disease only.
DRUG RESISTANCE
Of the 3385 patients reported with a positive culture, 3052 were matched to the Mycobnet database and drug resistance data were available for isolates from 3046 of these. Isoniazid resistance was present in the isolates from 153 patients (5.0%) compared with 2.9% in 1988, while multidrug resistance (defined as resistance to isoniazid and rifampicin, with or without resistance to any other drug) was present in 21 (0.7%) compared with 0.6% in 1988. The number of patients known to have been previously treated declined from 474 (10.2%) in 1988 to 445 (7.9%) in 1998. Isolates from these patients had higher levels of both isoniazid resistance (9.5%) and multidrug resistance (4.1%).
ESTIMATE OF HIV CO-INFECTION
In 1998 113 (3.3%) adult patients (16–54 years) with tuberculosis were co-infected with HIV compared with 62 (2.2%) in 1993. In London the proportion was higher and had also increased (5.4% in 1998; 3.3% in 1993). Most co-infected patients were from the black African or white ethnic groups. Detailed results of the overlap between tuberculosis and HIV infection will be reported separately.
Discussion
The number of reported cases of tuberculosis in England and Wales increased by 21% in the 10 years between 1988 and 1998. The increase occurred primarily in London where the number of patients with tuberculosis rose by 71% over this period. In 1998 the rates of disease were highest in the black African ethnic group, remained high but were decreasing gradually in the ISC population, had increased in the Chinese ethnic group, and were very low and continuing to decline in the white population. More than half of all patients with tuberculosis were born outside the UK and the year of entry was known for more than 75% of these. As in previous surveys, rates of disease remained particularly high in those who had recently arrived (between 1994 and 1998) from parts of the world with a high prevalence of tuberculosis. The number of patients born in the UK has continued to decline; this was reflected by continued reductions in rates both in the white population and in those of ISC origin when standardised for age, place of birth, and year of entry. Although greater than in 1993, the proportion of adult patients with tuberculosis co-infected with HIV was low overall.
The methodology used in the 1998 survey differed from previous surveys. A district coordinator was responsible for collecting survey forms in each district. Cases were ascertained throughout the year and all cases known to the district coordinators, whether formally notified or not, were eligible for inclusion in the survey. These differences may have contributed to higher ascertainment of cases compared with previous surveys.8 The increase in the number of patients between the 1988 and 1998 surveys (21%), however, is comparable to the increase in formally notified cases (18%) for the same period. Although it is not possible to quantify the extent of increased ascertainment in the 1998 survey, its effect is likely to have been at least partly counterbalanced by the exclusion of some formally notified patients for whom a survey form could not be obtained. This is strengthened by the fact that the number of survey forms obtained was very close to the best estimate of cases for 1998 provided by district coordinators.
In earlier surveys most analyses were of new (previously untreated) cases. As difficulties exist in distinguishing with certainty those who have not had prior treatment, in this survey (unless otherwise stated) all cases were analysed together, whether or not previously treated. For comparison, data from the 1988 and 1993 surveys were re-analysed to include all cases, regardless of prior treatment status. As these surveys collected data on all age groups for only 6 months, the data were multiplied by scaling factors to permit comparisons of annual figures. Numbers and rates in this paper may therefore be different from those published previously.
As in previous surveys,1-4 some patients who were started on treatment and notified as having tuberculosis were not subsequently de-notified when the diagnosis of a non-tuberculosis disease was made. De-notification remains important, both for local purposes (contact tracing) as well as for local and national surveillance.9Mechanisms to facilitate reporting a change of diagnosis have been incorporated into enhanced tuberculosis surveillance.
In some developed countries the reversal of the decline in the number of reported patients with tuberculosis has been partly attributed to extra cases as a result of an increasing number of patients born in high prevalence countries,10-14 the HIV epidemic,11 ,15 poverty,13 ,16 and an ageing population.17 ,18 In Europe 11 of the 15 countries providing information to the EuroTB scheme in 1997 reported that 35% of their foreign born tuberculosis patients were born in Africa.19 Much of the increase in tuberculosis in England and Wales in the last 10 years was due to an increase in the number of patients who had been born abroad. Recent trends in migration into the UK may have contributed to the increased number of cases among new immigrants. The population of the black African ethnic group approximately trebled from 1988 to 1998, while the ISC population increased by about one third with most of this increase occurring between 1988 and 1993. The populations of white, black Caribbean, and Chinese ethnic groups in England and Wales have increased by less than 6% over the same period (Labour Force Survey population data from 1988, 1993 and 1998).
The geographical pattern of tuberculosis in England and Wales reflects the distribution of some high risk population subgroups. The large number of immigrants, especially recent immigrants, in London has contributed to the substantial increases observed in the capital. In addition, the tuberculosis/HIV co-infection rate increased in the 1990s in London (PHLS CDSC, personal communication).15 Although the number of adult patients with tuberculosis infected with HIV in England and Wales nearly doubled between 1993 and 1998, this represented only 9% of the national increase in tuberculosis during this period. As information on the socioeconomic status of patients was not collected in this survey, no light can be shed on the effect of poverty on the occurrence of tuberculosis. Further investigation of this issue would be possible using postcodes and indices of deprivation. Despite higher rates of tuberculosis in older people, and an ageing population in Britain, the increase in patients over 65 years of age accounted for less than 10% of the increase in England and Wales since 1988 (data not shown).
As in earlier national surveys,3 ,4 most disease in 1998 was pulmonary in origin although the proportion of patients with a positive sputum smear in 1998 (27%) was lower than in 1993 (35%). Patients in the white ethnic group continued to contribute the largest proportion (54%) of potentially infectious cases (sputum smear positive) in the community. Prompt treatment of such patients, as well as identification and screening of their contacts, must remain an integral part of tuberculosis control to reduce transmission of infection in England and Wales.
If resources to control tuberculosis in England and Wales are to be used efficiently, they must be focused on the groups at highest risk of the disease such as new entrants to Britain from countries with a high prevalence of tuberculosis. Screening of new immigrants has been found to identify cases of active tuberculosis20 ,21 but the current system is weak.10 ,20 Strategies need to be devised to prevent the occurrence of disease in new immigrants more effectively, and research needs to be carried out to determine the factors underlying the very high rates in new immigrants and the effectiveness of intervention measures for this group. Not only should treatment services be capable of providing therapy for patients and prophylaxis for contacts, but they should also be provided in ways best suited to the needs of the population mix in the local community.
This was the last in a series of five-yearly national tuberculosis surveys beginning in 1978, which have highlighted rapid changes in the epidemiology of tuberculosis in England and Wales. The implementation of continuous enhanced surveillance of all cases of tuberculosis from 1999 will provide a detailed and accurate picture of the occurrence of tuberculosis in a more timely way so that prevention and control measures can be adjusted to be more effective, while making the most efficient use of resources.
Acknowledgments
The authors would like to thank the clinicians, tuberculosis and chest clinic nurses, microbiologists and all other hospital or clinic staff who reported cases to the survey. We are grateful to all district coordinators and consultants in Communicable Disease Control for collating reports and chasing up missing data, and to the staff of the CDSC Regional Epidemiology Units for their support. We would like to thank André Charlett for statistical advice, and all other members of the survey Steering Committee for their advice and support (Corry van den Bosch, Ian Campbell, Mike Catchpole, Peter Christie, Jeremy Hawker, Owen McCarthy, Bill Smith, Neena Stewart, Tony Swan, Paul Van Buynder and Brian Watt). We are indebted to the survey team, especially Francine Ryan, for invaluable work in data collection. Thanks are due to Peter Craig for programming and database advice.
References
Supplementary materials
TB at the end of the 20th century
In the paper entitled "Tuberculosis at the end of the 20th century in England and Wales: results of a national survey in 1998" by A M C Rose et al which appeared on pp 173�9 of the March 2001 issue of Thorax, the data for the South East region were omitted from table 3[t3] on page 176 of the paper. The correct version of the table is shown here. The authors apologise for this omission.
Footnotes
The survey was funded by the Department of Health.
Conflicts of interest: none.
Linked Articles
- Correction