Article Text

Abstract
Background: Airway hyperresponsiveness in asthmatics is considered to be one of the major consequences of airway inflammation and remodelling. Airway responsiveness is normal in patients with eosinophilic bronchitis (EB), despite eosinophilic inflammation of the airways comparable to that which occurs in asthmatics. Comparisons between asthma and EB should clarify the changes in airway morphology that are related specifically to AHR in asthmatics.
Methods: Eighteen asthmatic patients, 15 patients with EB, and 11 healthy subjects were recruited. Airway wall area percentage (WA%), centrilobular prominence, and air trapping were compared using thin slice section computed tomography.
Results: WA% was significantly greater in asthmatics than in patients with EB (72 (3.1)% v 54 (2.1)%, p = 0.032) and was similar in EB patients and controls (54 (2.1)% v 57 (1.8)%, p>0.05). Centrilobular prominence and air trapping were similar in EB patients and asthmatics and were significantly greater than in controls.
Conclusion: WA% rather than air trapping or centrilobular prominence may be associated with the airway hyperresponsiveness that occurs in asthmatics but not in patients with EB.
- AHR, airway hyperresponsiveness
- EB, eosinophilic bronchitis
- FEV1, forced expiratory volume in 1 second
- FVC, forced vital capacity
- WA%, airway wall area percentage
- asthma
- eosinophilic bronchitis
- high resolution computed tomography
- airway hyperresponsiveness
Statistics from Altmetric.com
- AHR, airway hyperresponsiveness
- EB, eosinophilic bronchitis
- FEV1, forced expiratory volume in 1 second
- FVC, forced vital capacity
- WA%, airway wall area percentage
Asthma is a chronic airway inflammatory disease that is associated with an increased number of eosinophils, mast cells, and Th2 lymphocytes which induce airway hyperresponsiveness (AHR) and a reversible airflow limitation.1 In addition to airway inflammation, most asthmatics (even those with a mild condition) show evidence of remodelled airways, including goblet cell hyperplasia, reticular basement membrane thickening, vascular proliferation, and smooth muscle hypertrophy.2 Thickening of the airway walls is attributed to inflammation and remodelling of the airways that occur during asthma.3 The degree of thickening of the airway walls in asthmatics is correlated with the severity of the disease and airway flow limitation.4,5 However, pathology studies have revealed that, in asthmatics, the thickened airway wall extends through the small airways.6
Morphological changes in the small airways have recently been indirectly analysed using high resolution computed tomography (HRCT). Obstruction of the small airways results in regional air trapping and an increased prominence of the centrilobular structure.7,8 HRCT scanning is an accurate and reproducible method for evaluating the small airways8 and is more sensitive than spirometry.7 Relatively few studies of the relationship between bronchial wall thickness and AHR have been conducted,4,9,10 and the results of these studies are inconsistent because subjects showed different degrees of airway inflammation or because the studies lacked appropriate control groups. In addition, there has been no study to investigate the contribution of small airway changes to AHR of asthma.
Eosinophilic bronchitis (EB) is an airway disease in which the microscopic pattern of inflammation of the large airways resembles that of asthma; however, patients with EB have normal airflow and show no signs of AHR.11,12 In addition, there is no difference between the two conditions with respect to the expression of Th2 cytokines such as interleukin (IL)-4 and IL-5 and degranulation of eosinophils within the bronchial mucosa.13,14 A macroscopic analysis of the morphology of the large and small airways has not been carried out in patients with EB. Furthermore, due to the similarity of airway inflammation in the two conditions, the effect of the airway inflammation contributing to AHR9 could be eliminated if the two conditions were compared.
The aims of this study were (1) to examine the macroscopic changes in the airways of patients with EB and (2) to compare changes in the morphology of the airways of asthmatics and patients with EB in the thin section CT scan.
METHODS
Subjects
Eighteen asthmatic patients, 15 patients with EB, and 11 healthy subjects (controls) were enrolled in the study. A clinical history was obtained using a physician administered questionnaire15 from subjects who had complained of chronic coughing for at least 4 weeks. EB was diagnosed on the basis of the following criteria: (1) forced expiratory volume in 1 second (FEV1) and forced vital capacity (FVC) >75% of the predicted value without variable airway obstruction which could be demonstrated by a negative response to a short acting bronchodilator (increase in FEV1 <15%); (2) absence of bronchial hyperreactivity (>10 mg/ml methacholine); (3) sputum eosinophilia (>3%); and (4) no abnormality in the lung parenchyma on simple chest posteroanterior radiograph. All the subjects with EB were part of a cohort described in a previous publication.16 None of the present study subjects developed asthma or a decline in FEV1 (%) during the follow up period of 6–24 months. Asthma was defined according to American Thoracic Society criteria17 on the basis of clinical symptoms. Patients with intermittent or mild persistent asthma with sputum eosinophilia (>3%) were included according to the clinical features and the daily medication required for symptomatic control. Each patient showed airway reversibility, as documented by a positive bronchodilator response of >15% increase in FEV1 and/or airway hyperreactivity of <10 mg/ml methacholine. Normal healthy subjects were recruited from hospital personnel who answered negatively to a screening questionnaire for respiratory symptoms and had FEV1/FVC >80%, FEV1 >75% predicted, PC20 methacholine >10 mg/ml, and normal findings on the chest radiograph. Exclusion criteria were current or ex-smokers, evidence of bacterial infections on chest radiographs, treatment with systemic or inhaled steroids, or admission to hospital during the 6 weeks before the study.
Subjects visited the laboratory on three occasions. On the first visit the allergen skin prick test, short acting bronchodilator test, and sputum induction were performed. The study subjects produced sputum by the aerosol inhalation method of Pin et al using hypertonic saline.18 Sputum samples were examined and treated within 2 hours of collection using the method of Pizzichini and colleagues with minor modification.19 On the second study day the subjects underwent PC20 methacholine challenge test conducted using the method of Juniper et al20 and the results were expressed as the provocation concentration required for a 20% reduction in FEV1 (PC20) in non-cumulative units.20 On the third study day the subjects underwent the thin section CT scanning. Atopy was determined by skin prick tests using 48 common inhalant allergens including dust mites (Dermatophagoides farinae and D pteronyssinus), cat fur, dog fur, fungus, cockroach, grass, tree, and ragweed pollen (Bencard, Brentford, UK). The test was regarded as positive when the wheal diameter was ⩾3 mm.
This study was performed with the approval of the ethics committee of the University Hospital and informed written consent was obtained from all study subjects.
Thin slice CT scanning and radiological evaluation
All of the subjects underwent volumetric thin section CT scanning of the chest using a Somatom 4 scanner (Siemens Medical Systems, Forchheim, Germany). Patients were scanned caudocranially in one breath hold; 1 mm collimation was used at a table feed of 6 mm/0.75 s scanner rotation (8 mm/s) at 120 kV and 140 mA. For the expiratory thin section CT scan, all subjects were instructed to take a deep breath, exhale all the way, and hold their breath. Scanning was performed from the lung bases toward the apices. The volumetric axial images with 1 mm thickness and the 10 mm intervals were reconstructed with a high spatial frequency algorithm on both end inspiration and end expiration scanning. All scans were obtained at suspended end inspiratory volume because artifacts have been reported in scans obtained at functional residual capacity.21
The images were viewed at two window levels of −450 HU for accurate measurement of bronchial diameters and −700 HU for analysis of other HRCT features. All images were displayed at the lung window setting using a PACS (picture archiving and communication system) workstation (Starpacs, Infinitt Technology).
The thin section CT scans were evaluated for the presence and/or extent of the following features: (1) airway wall area percentage for bronchial wall thickening; (2) prominence of centrilobular structures for centrilobular nodule and branching linear structure; (3) air trapping on expiratory scan; (4) bronchiectasis; and (5) emphysema. These findings were defined according to the glossary of terms recommended by the Fleischner Society.22
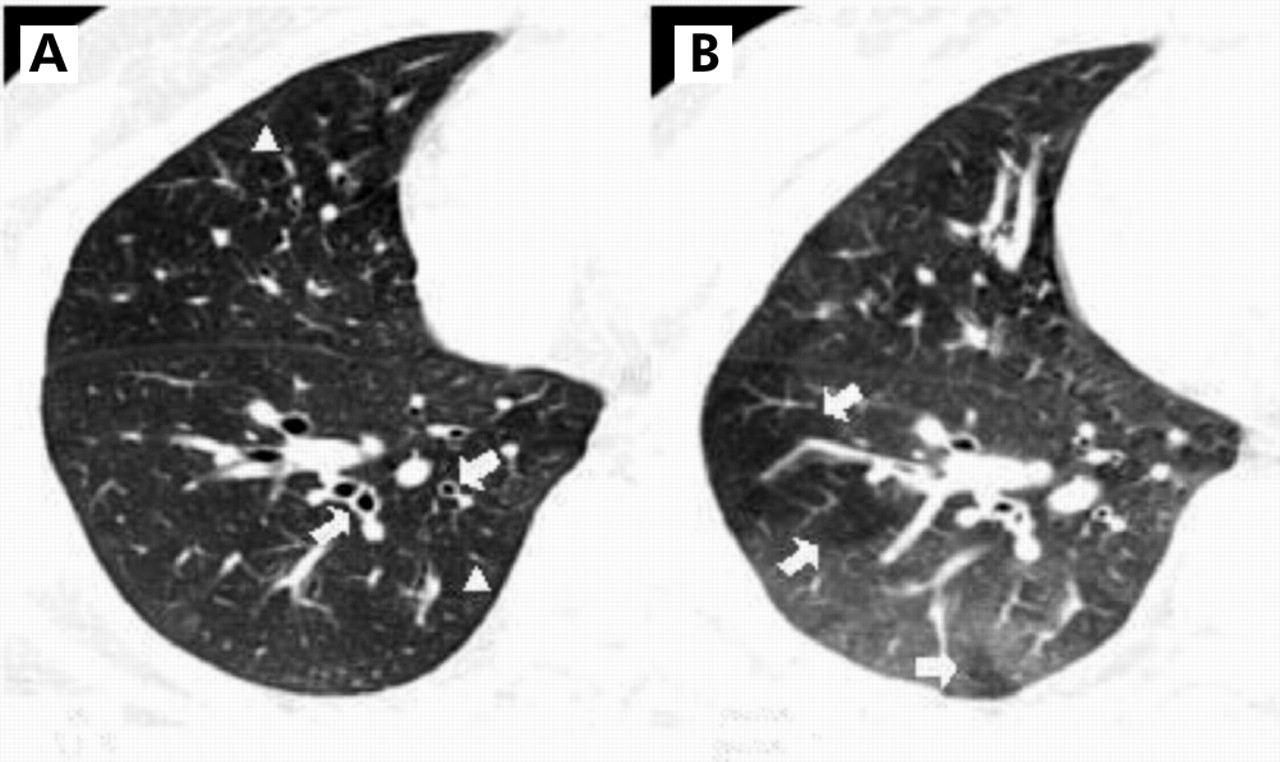
The prominence of centrilobular structures was defined as a dot-like, Y-shaped, or X-shaped opacity that lay in the region of the lobular core adjacent to the centrilobular artery, or within a few millimetres from the borders of the lobules such as the interlobular septa or pleura (fig 1).

CT scans in a 45 year old man with mild persistent bronchial asthma. (A) Inspiratory thin section CT scan showing diffuse bronchial wall thickening (arrows) and prominence of centrilobular structure (arrowheads, score 1) in the right lower lobe. (B) Expiratory thin section CT scan showing geographical air trapping (arrows, score 2) at the same level of the right lower lobe.
Air trapping was defined as the abnormal retention of gas (<100 HU compared with normal lung parenchyma) within a lung or lung units at the end of exhalation. Air trapping can also be seen in normal subjects, although its extent is limited. Focal areas of relative lucency can be seen in normal subjects on expiratory scans in the superior segments of the lower lobes.23 It is postulated that the slender segments may be less well ventilated than adjacent lung, having a tendency to trap air during exhalation.
Bronchiectasis was diagnosed as the cylindrical, varicose, or cystic type. To diagnose bronchiectasis, the observers used not only the classical criterion based on the comparison of the diameters of the bronchial lumen and the homologous pulmonary artery, but also the absence of normal distal tapering of the bronchial lumen, as assessed on successive CT slices, and visualisation of bronchi within 1 cm of the pleura.24 Emphysema was defined as a focal area of very low attenuation, usually without definable wall, surrounded by higher attenuation normal lung parenchyma. Ground glass opacity was defined as an area of hazy increase in lung opacity on the HRCT scan which is not associated with obscuration of underlying vessels.
The images were viewed on a work station using a magnification of ×5, and measurements of overall (D) and internal (L) diameter of the bronchi were made using electronic callipers with wall thickness (T) being derived from these measurements (T = (D − L)/2), fig 2. All bronchi of more than 1.5 mm in diameter clearly seen in cross section were measured in each slice of the inspiratory scans. Oblique sections influence wall thickness, and the long to short diameter ratio was used to assess “roundness” with an upper limit of 1.5 being permitted and measurements then being performed across the short diameter.25
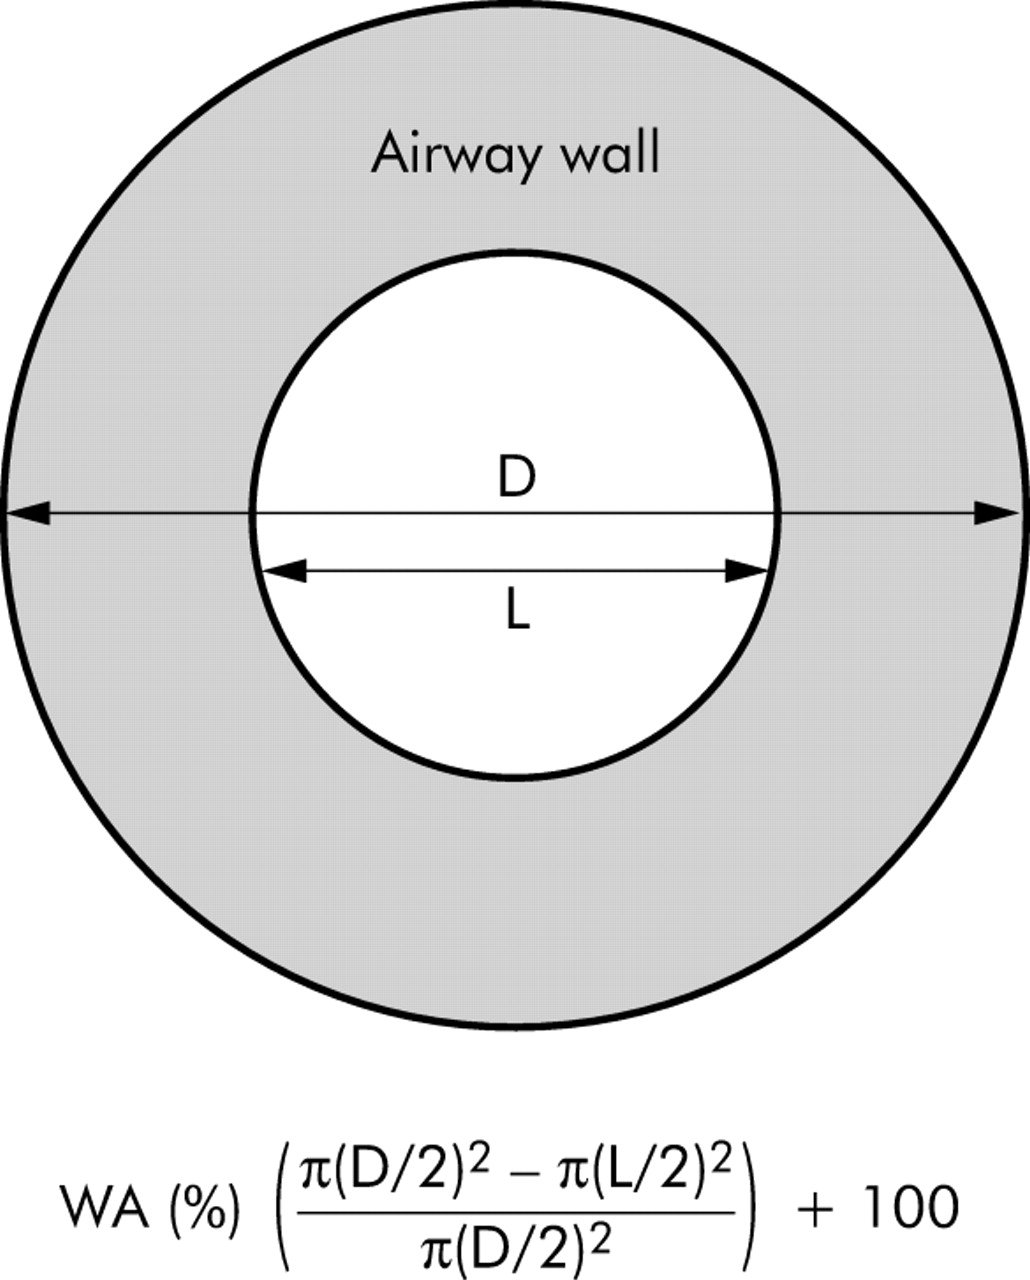
Schematic explanation of measurement of airway wall area percentage (WA%). D, outer diameter of bronchus; L, inner diameter of bronchus.
The airway wall area percentage (WA%) was used to compare bronchial wall thickening between the groups. Wall area was calculated as a percentage of total airway cross sectional area, thereby relating wall thickness to bronchial size, and a mean value was calculated for each patient for each observer from all the bronchi measured.4 Given that two independent observers may identify a different position for the wall edge, we combined the data from the observers to obtain a consensus measurement of wall thickness, taking the mean of the average values obtained for the two observers for each assessment. Wall thickness expressed as a consensus value for each patient was created in the same way, giving single measures of WA%.
The lung was divided into six zones (upper, middle, and lower right and left) by one third and two third of the vertical distance between the lung apices and the domes of the diaphragm. Each of these zones was evaluated and scored separately for the presence and/or extent of the features on the thin section CT scan. The prominence of centrilobular structures and air trapping were scored in each of six zones according to the percentage of the involved area to cross sectional area (0 = no involvement; 1 = 1–25%; 2 = 26–50%; 3 = 51–75%; and 4 = 76–100% of cross sectional area) as described in other studies.26,27 The scores of the six zones were summated as the total scores for centrilobular structures and air trapping ranging from 0 to 24. They were expressed as a semi-quantitative scale of grade as follows: grade 0, <1; grade 1, 1–5; grade 2, 6–12; grade 3, 13–18; grade 4, >18. Air trapping in the superior segments of the lower lobes and isolated pulmonary lobules were not scored because of the possibility of physiological air trapping.28 The remaining features of the thin section CT scan (emphysema and bronchiectasis) were evaluated in terms of their presence or absence.
Reproducibility
Two experienced thoracic radiologists (JP and YH) who were blinded to the clinical features of the study subjects measured independently overall (D) and internal (L) diameters of the bronchi using electronic callipers on two occasions separated by an interval of 2 weeks and calculated WA%. Intra-observer and inter-observer variation were assessed by plotting the difference between two WA% measurements against the mean value of the two.29 To assess inter-observer and intra-observer variability of parameters, the kappa coefficient of agreement (κ) was computed.30
Analysis of data
The characteristics of the subjects were compared using descriptive statistics. Comparisons between the three groups (patients with EB, asthmatics, and controls) were made using the Kruskal-Wallis test and, if significant, the Mann-Whitney U test was used to compare non-parametric data between two groups. An analysis of variance (ANOVA) and Duncan’s multiple range test were used to analyse parametric data. Spearman’s rank correlation coefficient was calculated to evaluate the relationships between the physiological responses (FEV1, FEF25–75%, and PC20 methacholine) and radiological parameters. A p value of <0.05 indicated statistical significance.
RESULTS
Thin slice CT scan findings
The characteristics of the subjects are shown in table 1. Age, sex, FEV1 % predicted, and sputum eosinophil content were matched between patients with EB and asthmatics. There was no difference in FEV1 % predicted between the three groups. Patients with mild asthma had a significantly lower levels of FEF25–75 % predicted than normal groups (p = 0.028), but there was no statistical differences between patients with EB and controls even though the former group had a lower trend than the controls (83.8 (9.3)% v 94.6 (3.6)%, p = 0.096). The proportion of subjects with atopy was similar in the groups with EB and asthma. PC20 methacholine was significantly lower in asthmatics than in patients with EB and controls.
Characteristics of study subjects
The inter-observer agreement rate was 78% for centrilobular prominence and 72% for air trapping, and 84%, 76%, and 75% for the presence of bronchiectasis, emphysema, and ground glass opacities, respectively. The κ value was >0.75 for centrilobular prominence, which represents excellent agreement. The κ values for air trapping ranged from 0.45 to 0.59, which represents fair to good agreement.31 The intra-observer agreement rate was 84% for centrilobular prominence and 88% for air trapping, and 86%, 90%, and 82% for the presence of bronchiectasis, emphysema, and ground glass opacities, respectively. All of their κ values were >0.75.
A total of 911 bronchi were measured using thin section CT scanning (264 in 15 patients with EB, 366 in 23 asthmatics, and 281 in 16 controls; range 15–21 bronchi per subject). There was no difference in the mean number of bronchi measured in each study group. The mean diameters of the outer airway of the measured bronchi were similar in each group (5.4 (0.24) mm, 5.5 (0.23) mm, and 5.6 (0.26) mm in the controls, patients with EB, and asthmatics, respectively; p>0.05).
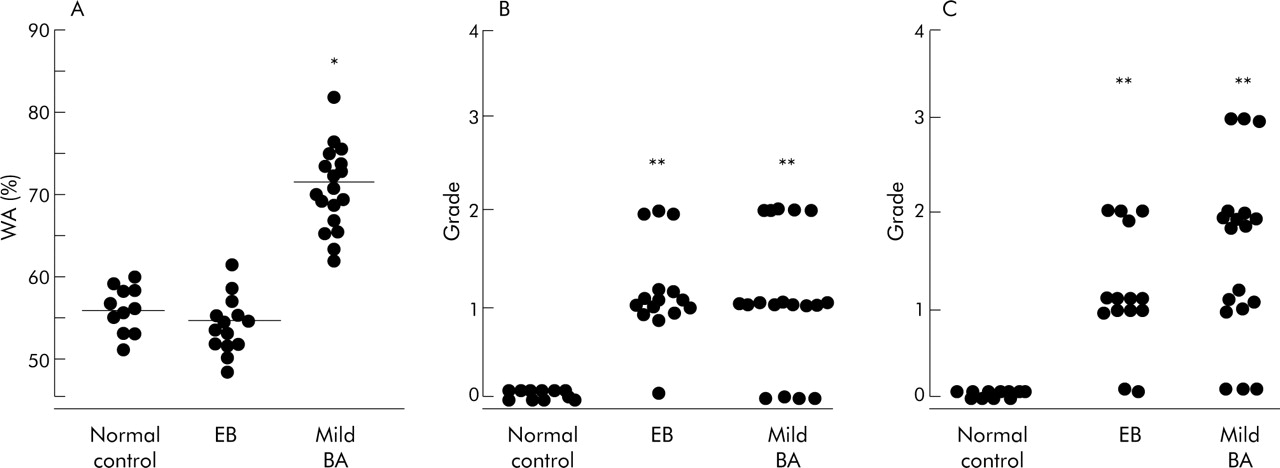
The mean WA% was significantly greater in asthmatics (72 (3.2)%) than in controls (57 (1.8)%) and EB patients (54 (2.1)%; p = 0.032 for each; fig 3A), but there was no difference in WA% between the latter two groups. We analysed the WA% by the inner diameter of 2 mm (small v large airways) in the three groups. WA% of the small airways (1.5–2 mm inner diameter) was greater than that of the large airway in patients with asthma (85 (3.1)% v 68 (3.2)%, p = 0.012), but there was no significant difference in WA% between large (>2 mm in inner diameter) and small airways in patients with EB and controls. In the small airways, asthmatic patients had a significantly greater WA% than control subjects or those with EB (p = 0.009).

Comparison of (A) airway wall area percentage (WA%), (B) prominence of centrilobular structure, and (C) air trapping on HRCT scans between patients with eosinophilic bronchitis (EB), mild asthma, and normal controls. WA% was higher in patients with asthma than in those with EB or normal controls (A). The prominence of the centrilobular structure was higher in patients with EB than in those with asthma, but the difference was not statistically significant (p>0.05) (B). Air trapping was higher in patients with asthma than in those with EB, but there was no statistical difference (p>0.05). Patients with EB and those with asthma had greater air trapping than normal controls (C). Bar represents mean (SE). *p = 0.032 v subjects with EB and normal controls; **p<0.05 v normal controls.
The inter-observer and intra-observer agreement rates for WA% are shown in fig 4. In each plot none of the mean differences severely deviated from zero. The κ values for inter-observer and intra-observer agreement of WA% were 64% and 76% respectively, which represents good to excellent agreement.
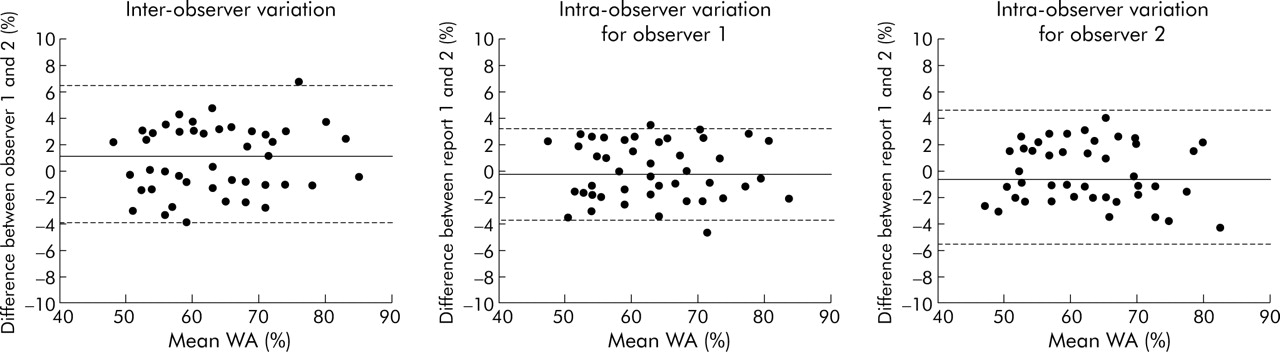
Inter-observer and intra-observer variances for the measurement of airway wall area percentage (WA%). The mean and difference between two measurements are plotted. The dotted and dashed lines represent the mean and mean ±2SD of the differences, respectively.
Centrilobular prominence was observed in 78% of the asthmatic subjects and in 93% of the patients with EB, but was not observed in any of the controls. The grade of centrilobular prominence was significantly higher in asthmatics and in patients with EB than in controls (p = 0.024, p = 0.035, respectively), but there was no difference between the former two groups (p>0.05; fig 3B). Air trapping was observed in 83% of mild asthmatics and in 87% of patients with EB, but was not observed in controls. The grade of air trapping was significantly higher in asthmatics and patients with EB than in controls (p = 0.025, p = 0.032, respectively), but there was no difference between the former two groups (p>0.05; fig 3C). None of the controls showed air trapping or centrilobular prominence. None of the patients with EB and none of the asthmatics had bronchiectasis or emphysema. Ground glass opacities were not observed in any of the subjects.
Correlation of airflow limitation with abnormal thin slice CT findings
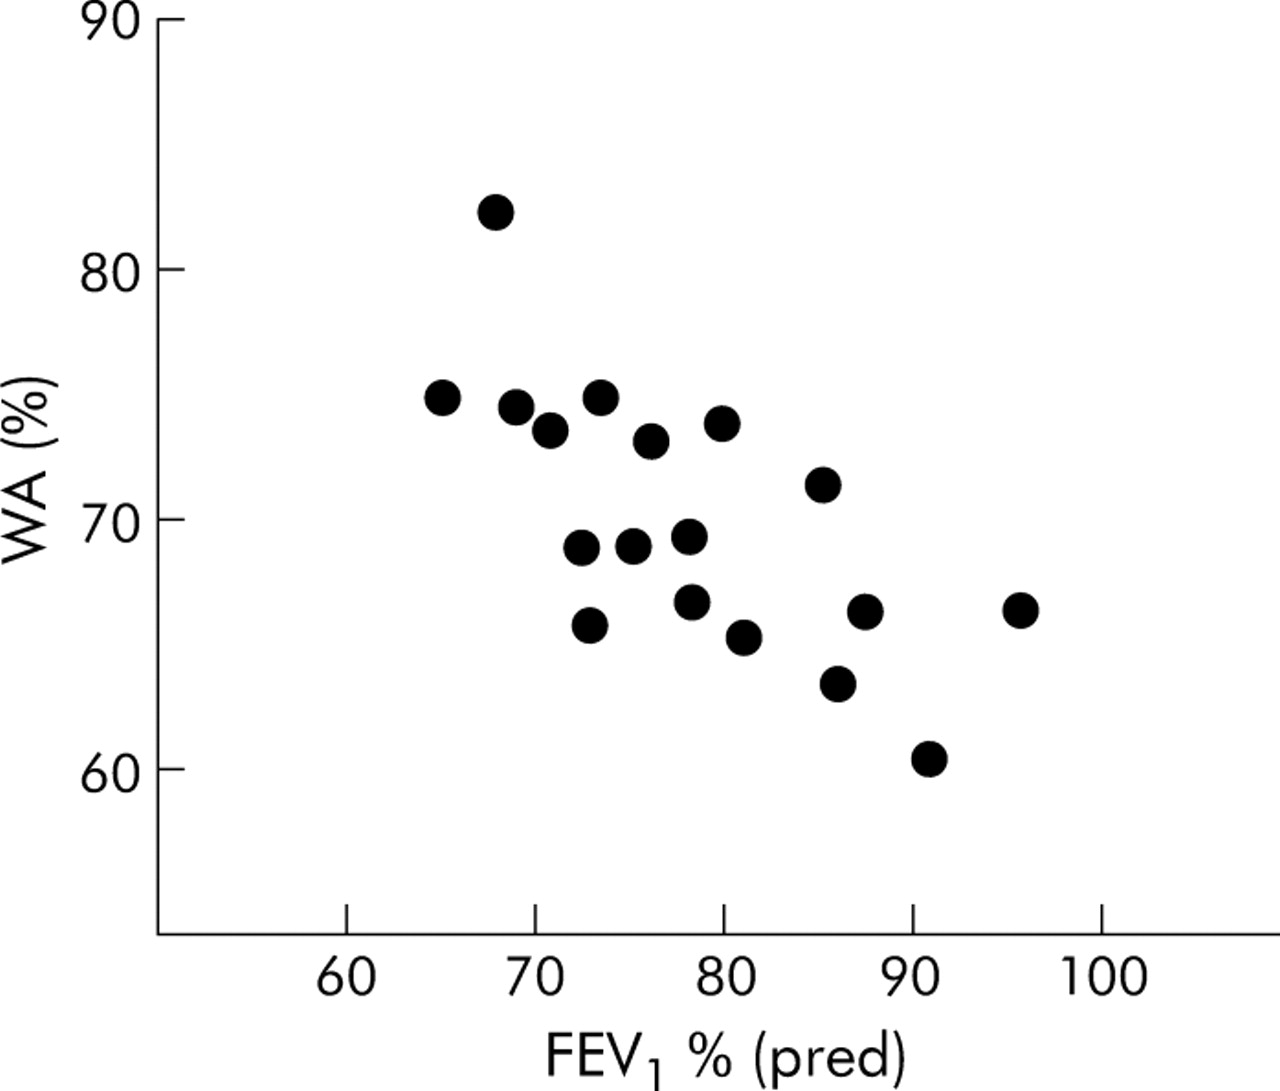
We investigated the correlation between changes in the airway morphology observed using thin section CT scanning and the degree of airflow obstruction (FEV1 % predicted, FEV1/FVC%, FEF25–75 % predicted, and AHR (PC20 methacholine)) in asthmatics and patients with EB. WA% was inversely correlated with FEV1 and FEV1/FVC in patients with asthma (r = −0.42, p = 0.026 and r = −0.54, p = 0.015, respectively; table 2, fig 5) but not in those with EB (r = −0.04, p>0.05 and r = −0.12, p>0.05 for FEV1 % predicted and FEV1/FVC%, respectively). Other parameters including air trapping and centrilobular prominence were not correlated with FEV1 % predicted or FEV1/FVC% in either asthmatics or patients with EB (table 2). FEF25–75 % predicted was not correlated with WA% or any other parameters in asthmatics or patients with EB (r = −0.18, p>0.05, r = −0.12, p>0.05, r = −0.08, p>0.05 for WA%, centrilobular prominence, and air trapping, respectively). We also investigated the relationship between changes in the airways and AHR (PC20 methacholine) in asthmatics and found that none of the parameters related to morphological changes in the airways was correlated with AHR in this group (r = −0.02, p>0.05, r = −0.06, p>0.05, r = 0.12, p>0.05 for WA%, centrilobular prominence, and air trapping, respectively).
Correlation coefficient between abnormalities on thin section CT scans and degree of airway obstruction (FEV1 % predicted and FEV1/FVC%)
Correlation between airway wall area percentage (WA%) and FEV1 % predicted in patients with mild asthma. WA% was inversely correlated with FEV1 % predicted (r = −0.42, p = 0.026).
DISCUSSION
AHR in asthma may be mainly attributed to the inflammation and remodelling of the airways as a consequence of epithelial damage, subepithelial fibrosis, increased airway vasculature, deposition of proteoglycans, and smooth muscle changes.32 In this study the relationship between airway morphology and AHR in patients with EB and those with asthma was compared using thin section CT scanning. We observed no thickening of the large airway walls in patients with EB, whereas patients with mild asthma had significantly thicker walls in the large airways than those with EB. Given that the extent of airway inflammation is comparable between these two diseases, thickening of the large airways in asthmatics would appear to be due to airway remodelling rather than inflammation. In addition, we found that the amount of air trapping and centrilobular prominence was similar in patients with EB and in asthmatics. These results suggest that the absence of thickening of the walls of the large airways in patients with EB may be one of the reasons for the normal airway responsiveness to methacholine in these patients. Moreover, AHR in asthmatics may be attributed to thickened large airways rather than to changes in the small airways.
To our knowledge, this study is the first in which patients with EB have been compared with asthmatics with a similar extent of airway inflammation. The results of this study may therefore be clearer than those of studies comparing asthmatics with normal control subjects which produced conflicting results. For example, Boulet et al10 reported that airway wall thickness (measured using HRCT) was correlated with AHR in asthmatics with fixed airway obstructions. In contrast, Little and et al4 failed to demonstrate a relationship between airway wall thickness and AHR in chronic asthmatics.
Niimi et al9 have recently evaluated the relationship between airway sensitivity and airway reactivity versus bronchial wall thickness and airway inflammation. They found that airway reactivity was correlated negatively with airway wall thickness, while airway sensitivity was related to the degree of airway inflammation but not to airway wall thickness. However, dissociation of eosinophilic inflammation from AHR has been observed in asthmatics undergoing treatment with inhaled steroids. For instance, the elimination of inflammation by glucocorticoids was reported to improve but not to eliminate AHR.33 In our study the effect of airway inflammation on AHR could be excluded because asthma and EB are both associated with a similar degree of sputum eosinophilia (table 1). We did not measure airway inflammation using mucosal biopsies. However, airway inflammation can be assessed by measuring the cellular components of sputum.18 In addition, because asthma and EB are pathologically similar eosinophilic inflammatory airway diseases,12 it seems reasonable to compare asthma with EB to exclude the effect of airway eosinophilia on AHR.
In this study airway wall area was similar in patients with EB and in normal control subjects. In our previous long term study of patients with EB,16 most patients exhibited transient sputum eosinophilia that persisted for less than 2 months and showed no derangement of airflow rate and associated symptoms. Based on our previous observations and the findings of the present study, the absence of airway wall thickening may be associated with transient airway inflammation as reflected by the relatively short term eosinophilia within the airways of patients with EB.
AHR may develop when airway inflammation and remodelling have increased progressively over months or years. This causes the recruitment of inflammatory cells and the release of mediators over the short term. However, over the long term, underlying structural changes such as subepithelial fibrosis and extracellular matrix deposition cause irreversible airway remodelling.34 Thickening of the airway smooth muscle layer,35 abnormalities in autonomic neuronal control,36 and vascular factors such as vascular endothelial growth factor (VEGF)37 also have the potential to contribute to AHR in asthma. It has been well documented that there are some differences and similarities between asthma and EB in immunopathological aspects as indicated by biopsy or sputum studies. Previous studies of asthma have reported thickening of the basement membrane layer, reduction in epithelial integrity, and increased iNOS expression.38,39 Using bronchial biopsies, bronchoalveolar lavage, and induced sputum, Brightling et al have shown that asthma and EB have similar immunopathological findings except for mast cell infiltration into the smooth muscle of subjects with asthma.40
Morphometric and cellular analysis revealed the same degree of basement membrane thickening and cellular infiltration in patients with EB and those with asthma.12,40 Kanazawa et al41 recently reported that the production of VEGF and airway permeability were increased in asthmatics but not in patients with EB. Berry et al42 also found that infiltration of airway smooth muscle by mast cells that expressed IL-4 and IL-13 was characteristic of asthma but not of EB. IL-13 was detected in larger amounts in the sputum and mucosa of asthmatics than in subjects with EB,42,43 and sputum IL-13 levels were inversely correlated with PC20 value in subjects with asthma.43 These findings raise the possibility that interactions between mast cells and airway smooth muscle and the overproduction of cytokines may contribute to the thickening of the bronchial walls and to the development of AHR.
Microscopic studies using these procedures give us important information on the immunopathophysiology of asthma and EB. However, thickening of whole bronchial walls, small airway abnormalities, or any other gross morphology cannot be precisely evaluated with these procedures. Our gross examination of airway morphology using thin section CT scanning showed that EB is associated with normal airway wall thickness despite the presence of eosinophilic airway inflammation.
In our study, air trapping and centrilobular prominence were seen in 83% and 78% of asthmatics. These values are higher than those reported by other investigators.31,44,45 The different results between the studies might be due to different CT scanning methodology, different scoring systems, and ethnic differences.
We analysed the WA% by the inner diameter of 2 mm (small v large airways) in the three groups. WA% of the small airway (1.5–2 mm inner diameter) was greater than that of the large airway in asthmatic subjects (85 (3.1)% v 68 (3.2)%, p = 0.012). However, we found no significant difference in WA% between large (>2 mm inner diameter) and small airways (1.5–2 mm in inner diameter) in patients with EB. In addition to a greater degree of centrilobular prominence and air trapping, this result suggests that small airways of diameter <1.5 mm may be a major site at which eosinophilic inflammation occurs during EB.
Abnormalities of the small airway such as the prominence of centrilobular structures and air trapping were partially reversible in patients with both near fatal asthma and non-near fatal asthma following steroid treatment.46 However, it is not known whether the changes that occur in the small airways of patients with EB are reversible after treatment with anti-inflammatory drugs. Further studies are needed to investigate the change in the small airways over time in EB.
In conclusion, EB causes changes in the small airways that are reflected by an increase in air trapping and centrilobular prominence which resemble the changes that occur in asthmatic patients. However, the thickness of the large airway is normal in patients with EB, which may explain the normal responsiveness of such patients to methacholine. This finding implicates bronchial wall thickening in the AHR that characterises asthma. Increased air trapping and centrilobular prominence may be indicative of the presence of diseased small airways in patients with EB.
REFERENCES
Footnotes
-
Published Online First 21 October 2005
-
S-WP and J-SP contributed equally to this work.
-
This study was supported by a grant from the Korean Health 21 R&D Project, Ministry of Health and Welfare, Republic of Korea (01-PJ10-PG6-01GN14-0003).
-
Competing interests: none declared.
Linked Articles
- Airwaves