Article Text

Abstract
Background: Single measurements of peak oxygen uptake (V˙o2) have been shown to predict mortality in patients with cystic fibrosis (CF) although no longitudinal study of serial measurements has been reported in children. A study was undertaken to determine whether the initial, final, or the rate of fall of forced expiratory volume in 1 second (FEV1) or peak V˙o2 was a better predictor of mortality.
Methods: Twenty eight children aged 8–17 years with CF performed annual pulmonary function and maximal exercise tests over a 5 year period to determine FEV1 and peak V˙o2, magnitude of their change over time, and survival over the subsequent 7–8 years. Analysis was done using Kaplan-Meier curves and Cox proportional hazard model.
Results: Peak V˙o2 fell during the observation period in 70% of the patients, with a mean annual decline of 2.1 ml/min/kg. Initial peak V˙o2 was not predictive of mortality but rate of decline and final peak V˙o2 of the series were significant predictors. Patients with peak V˙o2 less than 32 ml/min/kg exhibited a dramatic increase in mortality, in contrast to those whose peak V˙o2 exceeded 45 ml/min/kg, none of whom died. The first, last, and rate of decline in FEV1 over time were all significant predictors of mortality.
Conclusions: Higher peak V˙o2 is a marker for longer survival in CF patients.
- cystic fibrosis
- exercise
- peak oxygen uptake
- pulmonary function
- survival
Statistics from Altmetric.com
Much of what we know about exercise in children with cystic fibrosis (CF) has come from cross sectional studies1–6 which essentially conclude that lower forced expiratory volume in 1 second (FEV1) and reduced weight for height or lean body mass are correlated with lower peak oxygen uptake (peak V˙o2), and that peak V˙o2 could predict earlier mortality.7,8 Nixon et al7 reported that higher peak V˙o2 was significantly correlated with survival, and that FEV1 did not improve the correlation in a multivariate model. Moorcroft et al8 reported that, while peak V˙o2 correlated with survival, it was no better than FEV1 in predicting likelihood of survival over 5 years. One problem with such studies of lung function and exercise capacity is the variable time of onset and rate of progression of clinically significant pulmonary disease within an individual. Thus, single time point measurements are more susceptible to bias inherent to this approach, a bias precluded by longitudinal studies. There is a remarkable dearth of data regarding longitudinal assessment of peak V˙o2 in children with CF.9 One study in young adults with CF reported that peak V˙o2 remained stable despite a fall in mean predicted FEV1 from 69% to 54%, based on two measurements of peak V˙o2 on average 6.3 years apart in a study with a high patient attrition rate.10
Such longitudinal data are of particular interest because they may offer insight into understanding the relationship between fitness and survival in CF—the “nature versus nurture” argument. Presently, it is recognised that there are “milder CF phenotypes” depending on the class of mutation and the presence or absence of pancreatic insufficiency.11 Selvadurai et al12 recently demonstrated a relationship between genotype and peak aerobic power. Do patients who inherently possess greater maximum aerobic power live longer, or do patients with milder phenotype remain more active and simply maintain a higher peak V˙o2 rather than let it fall due to debility? Determination of peak V˙o2 embodies the consummate test of oxygen transport and utilisation, and is heavily dependent on optimal cardiopulmonary function. Thus, peak V˙o2 could provide another yardstick for measuring severity of the CF phenotype, for assessing response to intervention(s), or for predicting mortality as has been demonstrated in CF and chronic obstructive pulmonary disease (COPD).13
A prospective annual assessment of peak V˙o2 was therefore carried out from 1991 to 1996 on a convenience sample of children with CF. The aims were to track pulmonary function and nutritional status—the two main predictors of peak V˙o2 derived from cross sectional studies—in order to determine the importance of peak V˙o2 in the prediction of mortality in CF. This would indicate whether or not peak V˙o2 is a good predictor of mortality over a 5–10 year period and, if so, whether the actual innate level or the change over time is more important.
METHODS
Subjects
The study cohort consisted of children with CF followed regularly (usually quarterly) at the CF clinic of the Winnipeg Health Sciences Center. This institution is the sole tertiary care centre for children in the province of Manitoba (population ∼1 million), Canada, and virtually all children in the province with CF were followed there. Eligible patients were those old enough to perform a progressive exercise test (⩾7 years old) of any severity except transplant candidates. No patients with cor pulmonale or on supplemental oxygen were included in the study. A necessary condition for testing at a scheduled clinic appointment was that the patient was in his/her usual clinical status—that is, with no recent exacerbation. Colonisation with Burkholderia cepacia was very uncommon among patients attending this clinic. Treatment remained essentially unchanged during the study period despite the introduction of Pulmozyme, which was used sporadically in the clinic. All eligible patients underwent annual testing. As far as possible, the test was incorporated and presented to the families as part of the routine clinical assessment. Sometimes scheduling difficulties made it impossible to adhere to the annual testing ideal, so test results obtained as part of other research studies (with a formal consent process) were used in the analysis. At all times procedures conformed to ethical standards of the local Institutional Review Board and were explained to parents and patients, all of whom assented.
Protocol
FEV1 was measured (model AT-6, Schiller AG) and expressed as percentage predicted.14 Nutritional status was assessed by ideal weight for actual height.15 Exercise testing was done on an electrically braked cycle ergometer (Lode Excalibur). Subjects performed progressive exercise with step increments of 5, 10, or 15 watts per minute, based on standing height and severity of pulmonary disease, such that expected duration of exercise would be approximately 10 minutes. Flexibility in pedal cadence of 40–80 rpm was permitted. They were strongly encouraged to pedal to exhaustion, manifest by falling pedal cadence accompanied by visible signs of exertion.
Apparatus and measurements
Heart rate was measured with a standard tripolar ECG (HP 78203A). Ventilation was measured with a screen pneumotachograph and exhaled gases were collected in 100 litre gas collection bags on a Jaeger Transferscreen II modified to perform exercise studies. Exhaled gases were continuously analysed for oxygen and carbon dioxide concentrations using Ametek zirconium oxide (S-3A) and infrared (CD-3A) analysers, respectively. Oxygen saturation was measured by pulse oximetry (Nellcor N-200, Hayward, CA, USA) using an earclip probe. All signals were continuously recorded on a strip chart recorder (Gould TA2000) running at 5 mm/s for offline computation of ventilation, oxygen uptake and carbon dioxide output based on mixed expired gas concentrations using the Haldane transformation. The highest oxygen uptake in the progressive test was taken as peak V˙o2.
Statistical analysis
Measurements were made from 1991 to 1996 and the last known follow up was January 2004. Peak V˙o2 was normalised for body weight (ml/min/kg). The rise in peak V˙o2 values in the majority of subjects after the first test was immediately obvious. We therefore decided to exclude the first test result in all subjects, thereby reducing our sample size since analysis was limited to patients who completed at least four exercise tests. Mortality was defined as death or date of lung transplant since those who received a lung transplant would have died shortly without this procedure. In 7 years following the last test (1996), six patients died from their CF lung disease, one of them 2 years after transplantation. Another three patients were still alive following lung transplantation but were considered to be imminent deaths, bringing the total number of pulmonary related deaths in this cohort to nine.
We began by fitting a linear regression to the time series for FEV1 and for peak V˙o2 of each patient. Because we were interested in factors affecting the change in peak V˙o2 over time, we also employed a mixed effects model analysis using Splus 2000 version 3 (Mathsoft Inc). Cox proportional hazard regression was done to determine the influence of FEV1 and peak V˙o2 on mortality. We chose the intercept of the time-series regression as the initial measurement of each predictor in the series, and the final measurement was taken as the de facto last test result in the series. Kaplan-Meier curves were constructed from these variables. We also examined whether the change over time was a better predictor than a single measurement using the time gradients calculated as described above. The model fit was tested with the likelihood ratio statistic.16 Hazard ratios and 95% confidence intervals were computed for FEV1 and peak V˙o2 as predictors using Cox proportional hazard regression. These analyses were done with Statview version 5 (SAS Institute Inc) on a Macintosh computer.
RESULTS
Although approximately 75 patients were followed through the clinic, the number of patients who performed exercise tests was limited as nearly half were too young to reliably perform spirometry and progressive exercise. Three patients aged >7 years were never tested because they died during the first few years of the study, and two more died after having done only one maximal test during the study period. Eight children were tested twice and nine children were tested only once, thus yielding an insufficient number of tests to be included in the analysis. Among this group, mean (SD) FEV1 was 79 (19)% predicted. The cohort consisted of 28 children (14 boys) who were tested on at least four occasions, yielding at least three measurements (after discarding the first test) per patient between December 1991 and April 1996 (table 1).
Initial and final anthropometric and spirometric variables for the cohort of 28 children
Pulmonary function in the study population spanned the spectrum from normal to severe airway obstruction. The overall decline in FEV1 during the study period averaged 8.3% predicted, yielding a mean annual rate of fall of approximately 2.5% predicted (p = 0.0013). Patients achieved a heart rate >170/min in all exercise tests and most achieved a heart rate of >180/min at maximal exercise. The mean ratio of maximal ventilation to maximum voluntary ventilation (35×FEV1) for each patient over the course of the study was 0.928 and ranged from a low of 0.463 to a high of 1.46. Significant oxygen desaturation (<90%) was not seen in any patient. The mean time elapsed between tests was 1.2 years (range 0.3–3) and time between initial and final tests used in these analyses ranged from 0.9 to 4.3 (mean 2.3) years. Patients grew an average of 4.3 cm per year in height (range 1–8) and gained an average weight of 3.6 kg per year (range 0.8–9) during the course of the study. They were well nourished: mean percent ideal body weight was 103 at the initial test, with no patient less than 80%; while the mean percent ideal body weight at the time of the final test was 102. In general, percent ideal body weight remained very stable during the observation period.
The mixed effects model demonstrated an overall decline in peak V˙o2 of 0.17 ml/min/kg per month which was equal in boys and girls although boys started with a slightly higher peak V˙o2 (mean difference 3.7 ml/min/kg, p = 0.0035). In addition to the influence of sex, the model also showed a significant interaction between age and months elapsed since initial testing, with a more rapid decline (p = 0.048) in children who were older at the onset of annual testing. There was no relation between initial peak V˙o2 and the subsequent rate of decline.
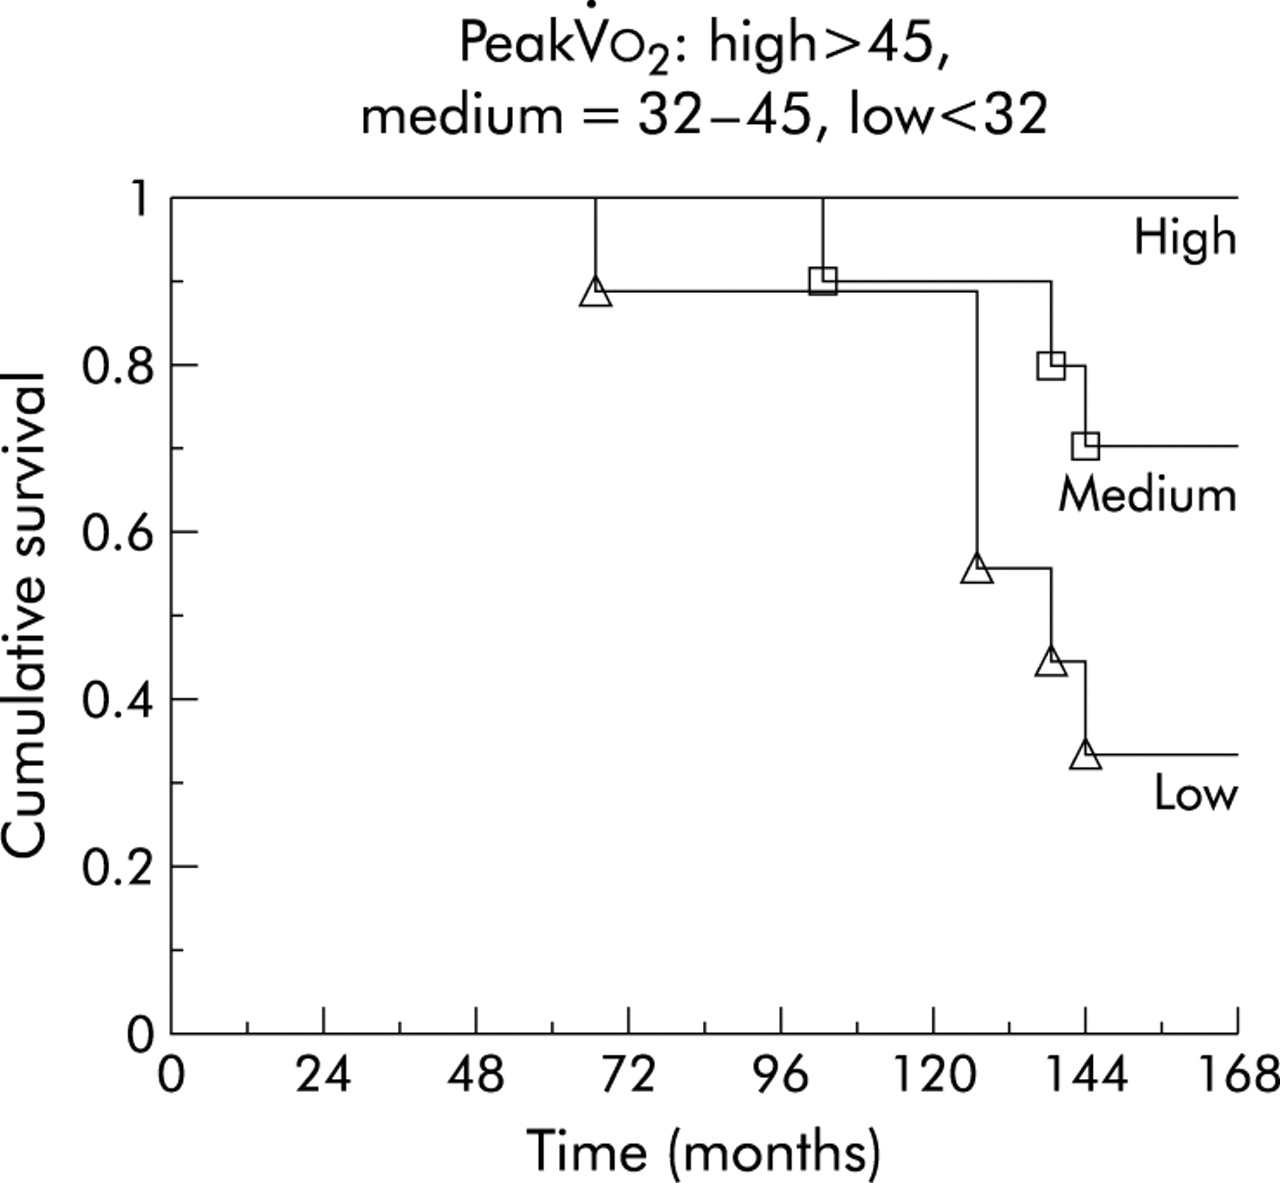
The Cox proportional hazards model summaries are shown in table 2. The hazard ratios can be interpreted as the increase (or decrease) in the hazard ratio with an increase in one unit of the predictor variable: in the case of FEV1, the unit is 1% predicted whereas in the case of peak V˙o2 the unit is 1 ml/min/kg. The hazard ratios indicate a lower risk of death in the follow up period in patients with higher FEV1 or peak V˙o2. Final but not initial peak V˙o2 measurement in an individual was highly predictive of mortality in the 8 years following cessation of data collection, as shown by a Kaplan-Meier plot (fig 1).
Univariate Cox regression functions using single predictor and time gradients of predictor variable

Kaplan-Meier plots of final peak V˙o2 and likelihood of survival during follow up stratified according to high, medium, and low peak V˙o2. The lowest tertile was peak V˙o2 ⩽31.99 ml/min/kg.
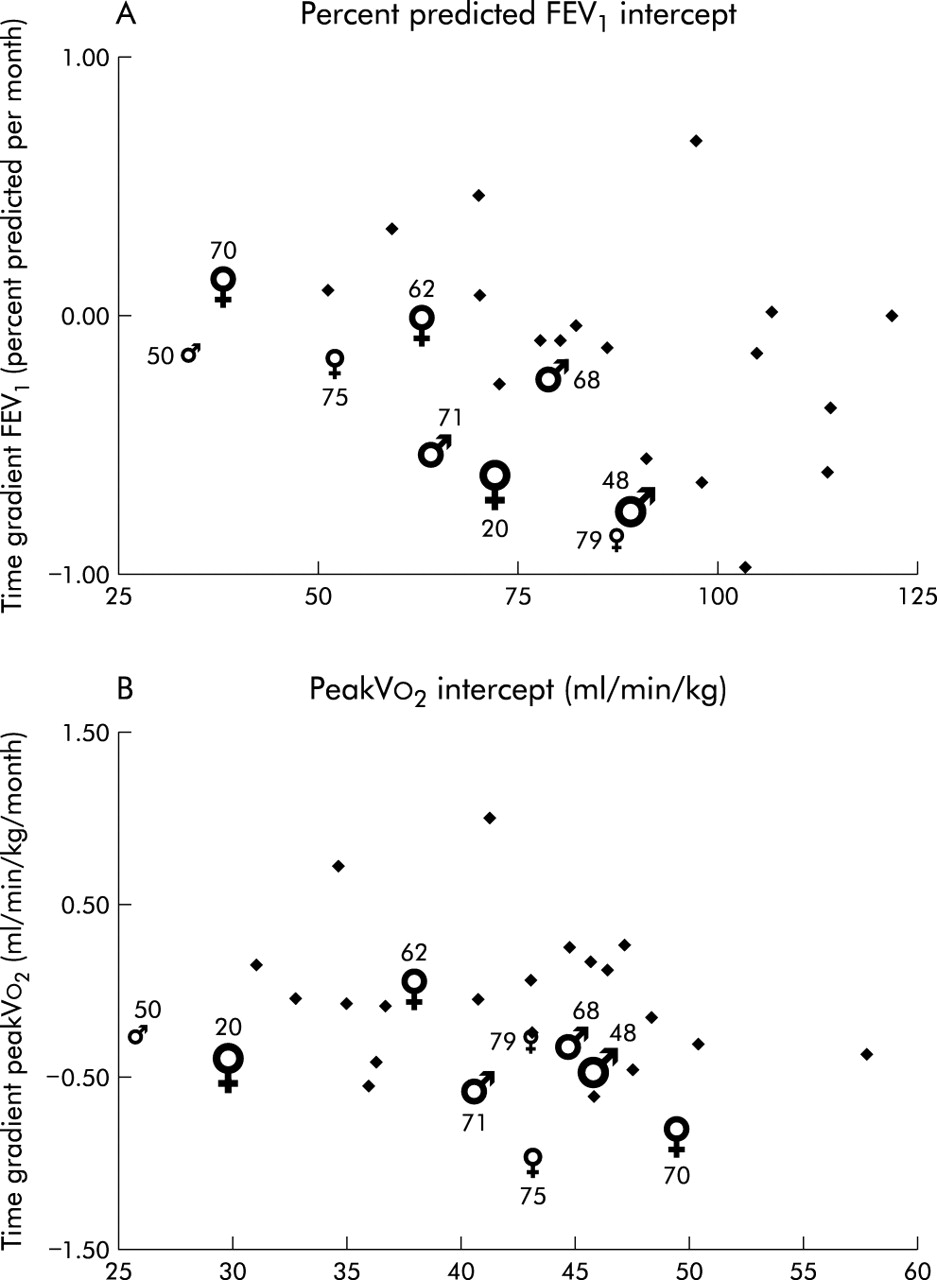
In order to determine whether any single measurement was a better predictor of mortality than a series of annual measurements, time gradients were calculated for FEV1 and for peak V˙o2 and the slopes of these functions were used as covariates in a Cox regression model. The results of this analysis and the corresponding hazard ratios are shown in the lower part of table 2 and the units are change in percent predicted FEV1 or change in peak V˙o2 (ml/min/kg) per month. According to these survival functions, the hazard rate was roughly equivalent for both FEV1 and peak V˙o2 intercepts. This is not surprising since these measurements were taken, in many cases, as much as 10 years earlier. On the other hand, the rate of change in FEV1 and peak V˙o2 during the course of the study exerted small but significant effects on ultimate mortality. The smallness of values for the hazard ratios coupled with their relatively large standard error hinders conceptualisation, so these data are best portrayed as in fig 2. Although age and sex did not contribute significantly to the Cox regression analysis, they are also highlighted in the figures to show their known effect on mortality. There was a clustering of mortality in the FEV1 plot in a manner that makes intuitive sense: either a low initial FEV1 with little change thereafter or a high initial FEV1 with an obvious subsequent slide were both associated with mortality in our cohort (fig 2A). The same pattern, though present, is not as readily apparent in the peak V˙o2 plot (fig 2B). Nevertheless, in light of the Kaplan-Meier curves shown in fig 1, we constructed a third plot of the rate of change of peak V˙o2 versus final peak V˙o2 (fig 3). Among those who died during the follow up period, there was a clustering toward lower peak V˙o2 values and none exhibited an upward trend in peak V˙o2 during the testing period.

Plots of fitted slopes versus fitted intercepts (by linear regression) for (A) FEV1 and (B) peak V˙o2 of each subject in the study group. The lung deaths are shown according to sex with the size of the symbol proportional to the age of the patient at commencement of the study. The number beside each event symbol is the number of months from the last test to the time of death.

Plot of fitted slopes versus final peak V˙o2 of each subject in the study group. The lung deaths are shown according to sex with the size of the symbol proportional to the age of the patient at commencement of the study. The number beside each event symbol is the number of months from the last test to the time of death.
DISCUSSION
Our longitudinal analysis of a sample of children with CF confirmed the prognostic value of peak V˙o2 with results strikingly similar to those of Nixon et al.7 Patients whose final peak V˙o2 was in the lowest tertile had a mortality rate approaching 60% over the subsequent 7–8 years. The prognostic information captured in peak V˙o2 was also borne out by Cox regression analysis (table 2), although this was not apparent from initial peak V˙o2 values. According to hazard ratios computed by the Cox model, the effects of FEV1 and peak V˙o2 on survival were of similar magnitude, but examination of both the initial values and their respective rates of change showed the superiority of FEV1 in this regard. The fact that the rate of decline in peak V˙o2 was a statistically significant predictor of mortality (table 2) is most likely due simply to the fact that two patients with relatively high initial peak V˙o2 (who coincidentally had low FEV1) experienced greater reductions in peak V˙o2 during the years leading up to death or transplantation. The influence of peak V˙o2 (actual value or rate of change) in the prediction of mortality is best depicted in fig 3. The importance of relative underweight to prognosis in CF has been recognised,17 but our inability to demonstrate this in our survival analysis was probably due to the overall good nutritional status of the patients in this series. Although our patient population was small, the findings are made more robust by the fact that they all came from a single centre where care was standardised and where there was negligible isolation rate of B cepacia.
We interpret our data as follows. Patients in our study fell into the disease severity category of those who survive beyond 15 years according to Corey et al.18 The mean age at study outset was 10 years and the study lasted for 5 years. Survival beyond this time was highly likely, and the corollary is that risk of death in that same time frame was correspondingly small. In such a population, declining FEV1 early in the course of the disease was small and had little impact on the prediction of mortality until a threshold was reached. Once this threshold was crossed, mortality within the next 7 years became more likely. At this stage peak V˙o2 entered the picture as a variable with predictive value for outcome: higher peak V˙o2 was associated with greater longevity. The fact that the rate of decline in peak V˙o2 in our patients was not affected by initial peak V˙o2 implies that those who started with a higher peak V˙o2 lived longer. No study published thus far was designed to answer the key question—whether better peak V˙o2 is a marker for less severe illness or whether those patients who remain physically active succeed in delaying the onset of respiratory failure. It is conceivable that, as pulmonary function declines due to repeated chest exacerbations during which the child feels unwell, he/she refrains from physical activity and thus becomes progressively deconditioned. Studies of levels of habitual activity in children with CF reached various conclusions,19,20 although activity levels fell as health status declined.21 However, it is not at all clear that the level of habitual physical activity has any bearing on peak V˙o2 in healthy children.22
Whereas FEV1 is the usual marker for severity of lung disease, many factors other than lung function influence peak V˙o2. These principally include measurable factors such as height, sex, age, and pubertal status,23 as well as more difficult to quantify factors such as effort. Physical fitness also has a substantial genetic component24 and it is becoming apparent that genes remote from the CF gene locus also determine disease severity.25 This raises the possibility that the same genes that confer better physical fitness also confer a survival advantage in CF. Selvadurai et al12 recently demonstrated a relationship between genotype and peak aerobic power. One could hypothesise that patients with similar degrees of lung disease, measured by FEV1, have different prospects for survival depending on their peak V˙o2. Figure 3 illustrates this point by contrasting two patients from the present cohort. One was a 16 year old girl of mean (SD) 83 (1)% ideal body weight with FEV1 of 52 and 49% predicted and peak V˙o2 of 30 and 25 ml/min/kg 1 year apart who required a lung transplant within 2 years, and the other was a 14 year old girl of mean (SD) 93 (1)% ideal body weight whose FEV1 hovered between 38 and 43% predicted and whose peak V˙o2 was consistently >40 ml/min/kg over an 18 month period. She did not die from progressive lung disease until more than 6 years later.
It is clear that there is a learning effect in the measurement of peak V˙o2 in children and that the results of a single test are suspect, particularly if they are a first attempt. This should come as no surprise to the experienced clinician who knows that it typically involves more than one visit for most children to master the forced expiratory manoeuvre used in obtaining FEV1, and first attempts are often unreliable. Performing a progressive exercise test to voluntary exhaustion is more complicated still, and a child will probably perform better once he/she knows what to expect. While there was an inexorable decline in peak V˙o2 over time of the order of 2 ml/min/kg per year, some patients demonstrated continual stability or even improvement in childhood. This contrasts with the report by Moorcroft et al, but they were able to obtain follow up data in only one third (30 patients) of their original sample, potentially skewing their conclusions.8
In summary, we have affirmed that peak V˙o2 is correlated with survival in CF and have shown that peak V˙o2 exhibits a measurable decline in children with CF. Although FEV1 is simpler to obtain and more reproducible, it fails to deliver the more comprehensive functional assessment offered by measurement of peak aerobic power. The decision whether or not to incorporate periodic peak V˙o2 determinations will rest with individual clinics and attending physicians, and will depend on availability of resources. Nevertheless, our findings support the introduction of this assessment as early as possible, with repeat measurements at intervals. Only then will the true usefulness of peak V˙o2 as a prognostic index be realised.