Article Text

Abstract
Introduction The aim of this study was to compare the reproducibility of epidermal growth factor receptor (EGFR) immunohistochemistry (IHC), EGFR gene amplification analysis, and EGFR and KRAS mutation analysis among different laboratories performing routine diagnostic analyses in pathology in The Netherlands, and to generate normative data.
Methods In 2008, IHC, in-situ hybridisation (ISH) for EGFR, and mutation analysis for EGFR and KRAS were tested. Tissue microarray sections were distributed for IHC and ISH, and tissue sections and isolated DNA with known mutations were distributed for mutation analysis. In 2009, ISH and mutation analysis were evaluated. False-negative and false-positive results were defined as different from the consensus, and sensitivity and specificity were estimated.
Results In 2008, eight laboratories participated in the IHC ring study. In only 4/17 cases (23%) a consensus score of ≥75% was reached, indicating that this analysis was not sufficiently reliable to be applied in clinical practice. For EGFR ISH, and EGFR and KRAS mutation analysis, an interpretable result (success rate) was obtained in ≥97% of the cases, with mean sensitivity ≥96% and specificity ≥95%. For small sample proficiency testing, a norm was established defining outlier laboratories with unsatisfactory performance.
Conclusions The result of EGFR IHC is not a suitable criterion for reliably selecting patients for anti-EGFR treatment. In contrast, molecular diagnostic methods for EGFR and KRAS mutation detection and EGFR ISH may be reliably performed with high accuracy, allowing treatment decisions for lung cancer.
- breast cancer
- cancer genetics
- cancer research
- comparative genomic hybridisation
- diagnostics
- EGFR mutation
- familial cancers
- gene amplification
- genetics
- image analysis
- immunohistochemistry
- in-situ hybridisation
- lung cancer
- molecular pathology
- oncology
- proficiency testing
- sputum
Statistics from Altmetric.com
- breast cancer
- cancer genetics
- cancer research
- comparative genomic hybridisation
- diagnostics
- EGFR mutation
- familial cancers
- gene amplification
- genetics
- image analysis
- immunohistochemistry
- in-situ hybridisation
- lung cancer
- molecular pathology
- oncology
- proficiency testing
- sputum
Introduction
Recently, an empirical treatment approach with epidermal growth factor receptor (EGFR) tyrosine kinase inhibitors (TKIs) showed spectacular responses in a subset of patients with advanced non-small cell lung cancer (NSCLC).1–4 In those patients, EGFR mutations and DNA amplifications were detected, and several studies have since been performed on the adjuvant treatment of NSCLC with EGFR TKIs. For prediction of response to EGFR TKI treatment, EGFR gene copy number,5 EGFR protein expression, EGFR mutation4 6 and KRAS mutation are informative.5 7–9 However, in those studies, biomarker analysis was performed in central laboratories.
Before the biomarkers can be used to select patients for this novel type of treatment, it is necessary to evaluate the reproducibility of testing by different laboratories. Recently, recommendations for the use of EGFR molecular assays have been reported, and these include guidelines for tissue storage, handling and processing.10 In addition, recommendations for the standardisation of molecular assays have been discussed. For mutation analysis, sequencing has been the procedure of choice, although the development of more rapid and sensitive techniques is awaited. For gene copy number changes, fluorescence in-situ hybridisation (FISH) analysis was preferred, as true amplification of the EGFR gene in NSCLC is less frequent as polysomy. Since then, high correlation between EGFR FISH and chromogenic in-situ hybridisation (CISH) analysis has been shown.11 12 For colorectal cancer, a norm for mutation analysis has been published recently,13 and the required level of minimum performance was based on arbitrary grounds. For lung cancer, suggestions for a norm in mutation and amplification analysis have not been published.
Proficiency testing for molecular diagnostic pathology has been performed in The Netherlands for more than a decade.14 In addition to intralaboratory validation of any novel molecular assay for diagnostic purposes, the performance of molecular testing in different laboratories needs to be assessed before using new molecular markers in daily healthcare procedures. Therefore, in 2008 and 2009, EGFR and KRAS analysis was evaluated nationwide. In two ring studies, the reproducibility was evaluated and a performance level for mutation and amplification analysis obtained.
Materials and methods
Ring study design
In 2008 and 2009, a ring study for quality control of EGFR and KRAS was performed. Organisation of the ring study was according to a previously described procedure,14 which was basically that a similar set of blinded samples was distributed to different laboratories, test results were returned to a central location, and after decoding they were summarised as a consensus result, thereby delineating outliers. Subsequently, overall outcome was written in a concept report, distributed to participants for comments, and then finalised. Monitoring quality control of daily practice was performed with ethical approval according to ‘code goed gebruik’. A letter of invitation was sent from a central office to all pathology laboratories in The Netherlands. According to the Dutch Pathology Society, participation in ring studies for proficiency testing has been part of the guidelines for molecular diagnostics in pathology since 2005, and therefore strongly recommended. Laboratories could sign up for one or more of the tests offered. In 2008, laboratories tested immunohistochemistry (IHC) for EGFR, in-situ hybridisation (ISH) for EGFR, and mutation analysis for EGFR and KRAS. Formalin-fixed paraffin-embedded NSCLC specimens and DNA isolated from cell lines were used. Based on the results obtained in 2008, IHC testing was omitted in 2009. An overview of the samples distributed is shown in table 1.
Overview of materials distributed in the ring studies of 2008 and 2009 according to test purpose
From 15 lung cancer resection specimens with known outcome of mutation analysis for EGFR and KRAS, as determined by cycle sequencing15 alone or by high resolution melting followed by cycle sequencing,16 17 6 mm cores were used to prepare a tissue microarray (TMA). In two of the cases a second core was taken from a different paraffin block, resulting in 17 TMA samples for 2008. In 2009, one core was removed to avoid possible recognition based on orientation of the array. After cutting sections for 80 slides, only 13 cores remained with sufficient tumour in the cores, including one of the cases with a duplicate core. The starting point for numbering the cores within the TMA was different each year.
To test EGFR IHC variability between the different laboratories, two unstained TMA slides of 3 μm were sent to each participant. Participants were asked to use the following scoring system (adapted from Tsao et al15) for IHC data: 0, no staining visible; 1, weak membranous staining in ≤10% tumour cells; 2, moderate/continuous membranous staining in >10% tumour cells; 3, strong and continuous membranous staining in >10% of the tumour cells.
For EGFR ISH analysis two unstained TMA slides of 3 μm thickness in 2008 and 5 μm thickness in 2009 were distributed. For consistent data collection, participants were asked to use an EGFR copy number scoring system similar to the already routinely used HER2/neu testing in molecular diagnostic pathology laboratories in The Netherlands, according to the guidelines of the American Society of Clinical Oncology (ASCO)/College of Amercian Pathologists (CAP)18: 0, no amplification; 1–5, copies/nucleus in >50% tumour cells; 1, low amplification, small clusters or 6–10 copies/nucleus in >50% of tumour cells; 2, amplification, large clusters or >10 copies/nucleus in >50% of tumour cells. Since only the presence or absence of amplification is important in clinical practice, the categories between 0 and 1 were grouped together to generate one group for no amplification.
To estimate the concordance in EGFR and KRAS mutation analysis in 2008, DNA isolated from three cell lines with known mutations at a concentration of 10 ng/μl, and two 10 μm paraffin-embedded sections with a tissue area >10×10 mm2 from two cases of pulmonary adenocarcinoma, were distributed. For each tumour specimen, one H&E-stained slide of 4 μm thickness was also included.
In 2009, four samples of a dilution series of DNA isolated from a cell line with a known mutation were mixed with DNA from another cell line with wild-type for that gene at a concentration of 30 ng/μl. In addition, one 4 μm section of the TMA along with the 13 samples were distributed for the mutation analysis of EGFR and KRAS, and tumour cells from each case should have been scraped off the TMA slide for DNA extraction. An additional section of the TMA was included for H&E staining to allow evaluation of tumour percentage by the participant. In 2008 and 2009, mutation analysis was performed according to Lynch et al2 by participants CP, KS, RdW, EM and ML, and according to van Zandwijk et al19 by participants PN, ES, AvdB and CvN. Mutation analysis was performed according to Janmaat et al20 in 2008, and according to Kramer et al17and Heideman et al17 in 2009, by participant DH.
Participating laboratories received coded cases and were unaware of the content with respect to presence or absence of mutations, EGFR amplification or EGFR expression status. Submission of results had to be within 6 weeks of receiving the tests.
Data analysis
For evaluation of the outcome of IHC and ISH, a consensus score using an arbitrarily chosen consensus threshold of 75% was used. Results denoting a ‘not assessable’ (NA) answer were not included in the calculation of the consensus score. The success rate (percentage) of the results of all laboratories combined was calculated as 1–fraction of NA results, this rate denotes the percentage of total requested tests resulting in an (incorrect or correct) answer.13 Sensitivity and specificity were calculated compared with the consensus score, not taking the NA results into account. Results that differed from the consensus were considered to be either false-negative or false-positive results. For example, if most (>75%) laboratories detect a KRAS codon 12 mutation, but another laboratory identified the wrong mutation, this may have the same clinical relevance, but it was scored for technical error: false positive.
Results
EGFR immunohistochemistry
In 2008, eight laboratories participated in the IHC ring study. The IHC results for the TMA and details of methods used are shown in table 2. In the eight laboratories, seven different antibodies were used. For six of the seven antibodies the epitope recognition site was on the extracellular domain of the EGFR protein and for the other it was on the intracellular domain of the EGFR protein.
EGFR IHC scores and test details for tissue samples in each laboratory
The range of variation in high and low expression scores between laboratories was remarkable. For only four of 17 cases (23%, nos 4, 7, 9 and 14) the consensus threshold of 75% was reached, with a score range of one step difference maximum. For three cases, five of the eight laboratories (63%) showed the same result; one case showed a one step difference in score (range 2–3), and the other two showed a two step difference in score (range 0–2). In four samples the range of scores varied from absence of staining to strong membranous staining (scores 0–3). Hardly any of the IHC EGFR expression patterns correlated with EGFR amplification or mutation status. The staining results for samples of the same tumour (nos 3 and 5) were the same for five laboratories, and there was a one score difference for the other three laboratories, indicating more consistency within the laboratories than among the laboratories. In 2009, IHC was not part of the proficiency testing.
EGFR in-situ hybridisation
In 2008, eight laboratories participated in ISH studies. Five laboratories used FISH and three used CISH. The ISH results are shown in table 3.
ISH scores for tissue microarray samples for each laboratory participating in 2008 (n=17 samples) and/or 2009 (n=13 samples)
One laboratory had a success rate of 24%, while for the other laboratories the success rate was over 97%. Two laboratories using CISH had difficulties in obtaining reliable results: 15 of 51 cases (30%) could not be evaluated with CISH in contrast to only 1/102 (1%) with FISH. For the score range 0/1 and 2, a consensus score was obtained in 15/17 cases. For the distinction of ‘amplification’ (that is, score 2) versus ‘no amplification’ (that is, score 0 or 1) all cases reached the consensus score. One FISH laboratory missed the amplification in all three cases with amplification.
In 2009, eight laboratories delivered results for ISH. Five laboratories used FISH and three used CISH. An additional laboratory did not submit data because they wanted more slides for reliable estimation of amplification with CISH analysis. For the score range 0/1 versus 2, a 100% consensus score was obtained in all 13 cases using FISH, and in 11/13 using CISH. Two laboratories using CISH had difficulties in getting reliable information from the slide. In 2009, the overall consensus was 100% for FISH and CISH when non-evaluated slides were not considered as a false interpretation.
EGFR and KRAS mutation analysis
In 2008, 10 laboratories submitted results for the mutation analysis. The technique used in all laboratories was PCR followed by direct sequencing. One laboratory performed KRAS analysis only, since in case KRAS is wild-type, they send the case to another laboratory for EGFR mutation analysis. Exons 19 and 21 of EGFR were analysed by all nine laboratories. Exons 18 and 20 were tested by five and four laboratories, respectively. All the laboratories using sequence analysis indicated that the test might produce a false-negative result in cases with <50% tumour cells. For samples with <50% tumour cells, one laboratory analysed exon 19 for fragment length alterations by using GeneScan (Applied Biosystems, Foster City, California, USA) and the exon 21 p.Leu858Arg mutation after digestion of the template DNA by the restriction enzyme Sau96I, which recognises only wild-type DNA at this position.
The results for isolated DNA in 2008 are shown in table 4. A consensus score was reached in all five samples. The results for the three DNA isolates were highly concordant. In DNA isolate 3, apart from the p.Leu858Arg mutation in exon 21, an additional p.Thr790Met mutation was detected by three out of the four laboratories examining exon 20 in this case: that is, one false-negative result. The percentage of tumour cells in the two paraffin samples was estimated to be at least 50% by all laboratories.
EGFR and KRAS mutation analysis for isolated DNA and paraffin sections
The p.Gly12Cys mutation in slide 1 and the p.Gly12Ala mutation in slide 2 were detected with a high rate of concordance. For slide 1, one laboratory reported a false-negative result and two laboratories could not give a reliable answer. Laboratory K performed inadequately in four out of five cases (that is, one false-positive results and three NA cases). The method of reporting mutations was variable due to the fact that almost no laboratory used the consensus nomenclature for mutations.
In 2009, 12 laboratories submitted results for KRAS mutation, and nine submitted results for EGFR mutation analysis. The techniques used were PCR combined with direct sequencing (n=11) and high-resolution melting followed by cycle sequencing for genotyping aberrantly melted PCR products (n=1). The mutation analysis results for DNA isolates are given in table 4 and for the TMA they are given in table 5. The analysis of the isolates revealed the same KRAS mutation in four of the samples, with a high rate of concordance. Only one laboratory obtained a false-negative result in a sample containing approximately 10% tumour cells. No false-positive results were found in the isolate containing wild-type DNA only.
Scores for tissue microarray samples for each laboratory participating in mutation analysis of EGFR and/or KRAS in 2009
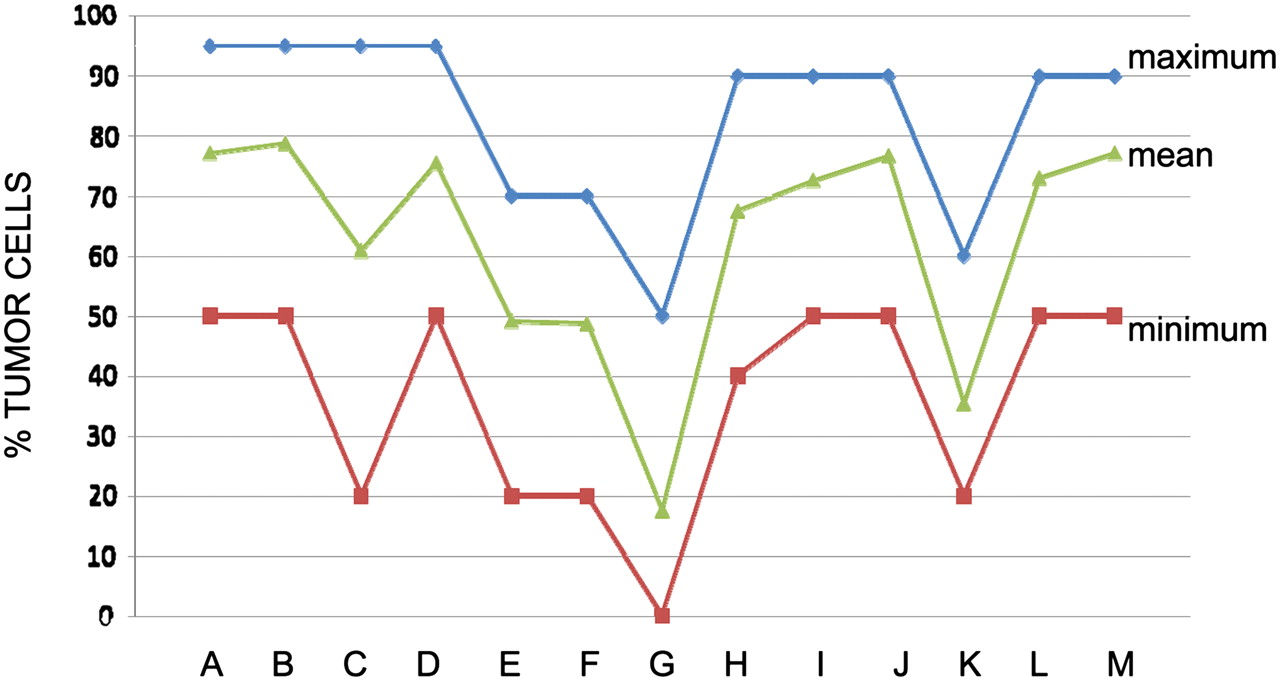
The estimation of the percentage of tumour cells in the TMA samples ranged from 40% to 75% (see figure 1). For mutation analysis a consensus score (≥75%) was reached for 12 out of 13 TMA samples. In TMA sample no. 5, which was derived from the same tumour as sample no. 3, but from another block, seven out of 10 laboratories with a test result detected the same mutation as in TMA no. 3. One laboratory reported a negative result and an estimated tumour fraction below 50%, whereas the two other laboratories reported a negative result with tumour cell percentages of 60% and 65%. In TMA sample no. 7, two laboratories reported a false-positive result, and in TMA sample no. 8 two laboratories reported a false-negative result, although the estimated percentage of tumour cells was ≥50%. In TMA sample no. 13, one laboratory detected a KRAS p.Gly12Asp mutation instead of the p.Gly12Ala mutation detected by the other laboratories.
The minimum (red), mean (green) and maximum (blue) percentage of tumour cells scored for each tissue microarray sample in the 2009 ring study. For direct sequencing analysis, the laboratories reported that the test might be false negative due to sampling when a mutation was not detected in cases of estimated tumour percentage <50%.
An overview of proficiency testing for 2008 and 2009 is shown in table 6. In 2008, the overall success rates for EGFR ISH, and EGFR and KRAS mutation analyses, were 89%, 98% and 88%, respectively. If two outlier laboratories with a low success rate for either EGFR ISH (24%) or KRAS mutation analysis (40%) were not taken into account, the success rate of all three tests was 98%. In 2009, the success rates for EGFR ISH, and EGFR and KRAS mutation analyses, were 97%, 99% and 99%, respectively.
Overview of proficiency testing for the different tests in 2008 and 2009
The mean sensitivity of these analyses varied between 80% and 100% in 2008, and between 94% and 100% in 2009. The mean specificity of these analyses varied between 95% and 100% in 2008, and 98% and 100% in 2009. The mean accuracy was in the range of 93–100% when all laboratories were included. When the outlier laboratories were not included in the analyses, the range for mean accuracy for the four tests was 97–100%.
Discussion
This study describes the first nationwide proficiency testing for EGFR and KRAS mutation analysis, EGFR gene amplification analysis and EGFR expression. For EGFR expression analysis with IHC a consensus score of only 23% of the cases was reached, denoting a high variation in IHC results for most of the cases. Therefore, without further standardisation, EGFR expression analysis by IHC was considered not suitable for use in daily practice. In contrast, ISH and mutation analysis for EGFR and KRAS testing leads to a mean success rate of ≥97%, a sensitivity of ≥96% and a specificity of ≥95%.
To generate a norm for adequate molecular testing we propose that two cut-off levels should be chosen: one for the success rate (the percentage of correct answers is calculated as 100% minus the percentage of cases not leading to a test result and error cases combined), and one for the error level in the test outcome (the sum of false-positive and false-negative cases per test). In this study, two laboratories with success rate of 24–40% for ISH and KRAS mutation testing, respectively, clearly performed below a reasonable threshold. For the other laboratories taken together, the success rate was over 97%. To set a norm for success rate in a ring study with a limited number of test samples (<14) our study suggests that a maximum allowed error of one sample per test is reasonable. With this norm, two outlier laboratories were identified: one with two false-negative results and one with three false-negative results.
In theory, a 90% Bayesian confidence interval (CI) may be calculated for a number of samples in proficiency testing, see table 7. For instance, in a laboratory with eight out of 10 correct answers in a proficiency testing study, the chance is 90% that between 53% and 92% of the routine analyses will be correct. The chance is 5% that in daily practice this laboratory will generate the correct answer for more than 92% of cases. As it seems reasonable to set a norm in proficiency testing at the smallest number of correct cases where the upper limit of the 90% CI is above the 95%, theoretically in a setting of 10 cases at least nine cases should be correct.
90% posterior probability estimates based on performance in proficiency testing
For a specific set of samples in proficiency testing (n=10, 14, 20 or 30) the 90% CI (region between the 5th percentile and 95th percentile of the posterior probability distribution) is shown for the success rate (fraction of correct answers×100%). The 90% CI is constructed with Bayesian statistics,21 assuming uniform prior probability for the success rate on the interval between 0 and 1.
Our data suggest that 97% sensitivity and 97% specificity for mutation detection is feasible. Unfortunately, to determine whether every individual laboratory reaches this level precisely, an unacceptably large amount of samples needs to be tested in a ring study. However, the main aim of proficiency testing, providing external feedback about test performance, was reached with a limited number of samples, as in this study laboratories performing within the proposed error norm and outlier laboratories for a certain test were clearly established. Moreover, the necessity of participating in quality control ring studies of molecular diagnostic pathology is demonstrated.
Recently, for KRAS mutation analysis in colorectal cancer, arbitrary thresholds for success rates of DNA extraction and correct KRAS mutation identification were set at 95% and 97%, respectively.13 For lung cancer, a norm has not been recommended in the guidelines for EGFR and KRAS mutation testing.10 Importantly, our study supports that such mutation and gene amplification analyses can be performed with an average 95% success rate and 97% accuracy. Nevertheless, reporting the accuracy level, and also the sensitivity and specificity data, provides additional information.
In The Netherlands, participation in proficiency testing is part of the guideline, but a norm for proficiency testing is lacking. In the USA, in the ‘Clinical Laboratory Improvement Act’ of 1988, ‘unsatisfactory’ performance in proficiency testing is defined as failure to attain the minimum satisfactory score for an analyte for a single testing event. ‘Unsuccessful’ performance is defined as failure to attain the minimum satisfactory score for either two consecutive or two out of three consecutive events. Failure to return proficiency testing results to the proficiency testing programme within the time frame specified by the programme, or failure to participate, is also an unsatisfactory performance. In the USA (for clinical chemistry and microbiology) when testing a larger number of cases, failure to attain an overall testing event score of at least 80% is considered unsatisfactory. As to the consequences of an unsatisfactory performance the responsibility for improvement belongs to the laboratories performing the molecular test. Essential in this respect appears to be an internal quality control and validation programme with external samples. In Europe, the consequences for unsuccessful performance in molecular diagnostics have not yet been established. One option is that the laboratory itself directly withdraws the test from its diagnostic procedures. Alternatively, either the professional organisation or the government should establish consequences.
For the detection of EGFR amplification/polysomy in 2008, one laboratory reported three false-negative results, whereas in 2009 results were optimal. Although a high correlation between EGFR FISH and CISH analyses has been shown,11 12 the success rate of FISH was 100% in both years (in total 150 results), but for CISH the success rate was 67% (34 /51) in 2008 and 95% (37/39) in 2009 (see table 6). The low success rate for ISH in 2008 was largely due to a single laboratory (with a success rate of 24%) that had just begun to use EGFR ISH. It can be argued that a laboratory should not participate in a ring test as long as the test is not internally validated successfully. The scoring system to detect EGFR copy number changes in NSCLC used in this study differed from the more recently published guidelines using the Colorado criteria.22 23 Interestingly, that scoring system is significantly different from the HER2 scoring system, mainly because of the more frequent occurrence of polysomy in lung cancer compared with breast cancer. Therefore, the presence of cases with polysomy could affect the consensus rate in proficiency testing when using scoring systems other than the Colorado criteria.
A relation between EGFR mutation and gene amplification has been described: EGFR gene amplification often accompanies EGFR mutation with preferential amplification of the mutant allele.27 In our study, one out of two amplification-positive cases tested for EGFR mutations showed a mutation. For clinical relevance, the molecular diagnostic methods appear to be more important than IHC for the identification of lung adenocarcinoma patients who may benefit from EGFR inhibitor treatments.28
In the ring studies of 2008 and 2009 most laboratories did not use standard nomenclature. The EGFR mutations were interpreted as correct as long as the correct numbers of nucleotides that were deleted or inserted were mentioned. However, for future reference the use of standard nomenclature is strongly advised. Guidelines for standard nomenclature of mutations can be found on the website of the Human Genome Variation Society (http://www.hgvs.org/rec.html).
Most discordant sequencing data were found in samples containing less than 50% tumour cells; therefore, it is essential to mention the percentage of tumour cells of the material used for DNA isolation and the sensitivity of the assay and/or reliability of the specific analysis in the pathology reports. Remarkably, the variation in estimation of tumour cell percentage varies tremendously between laboratories for tissue cores that, from the first to the last section (4 μm each), were cut within a 400 μm paraffin block thickness (figure 1). This may be due to variation in interpretation between pathologists; for example, confusion between the percentage of nuclei that are in the tumour (the correct measurement) and the percentage area of the sample that is tumour, which is not the correct estimate but is the percentage that pathologists often measure; this will be subject of further research. Of utmost importance is the relation between the fraction of tumour cells in a clinical specimen and the analytical sensitivity of the method used. The latter denotes the threshold of the technique for mutation detection, which can be expressed as number of copies necessary to detect a signal or the minimum number of mutated cells required to detect a signal in a background of wild-type cells. For PCR and sequencing, a minimum amount of 20–30% tumour cells is required,29–32 while for other techniques, such as PCR heteroduplex analysis with denaturing high-performance liquid chromatography, this is 1%,33 for scorpion ARMS methodology it is around or below 1%, for PCR high-resolution melting sequencing it is around 2.5%,16 34 for peptide nucleic acid clamped PCR it is 1–10%,35 and for mutation-specific PCR it is 2.5%.35 Theoretically not only the fraction of tumour cells is relevant, but also the amount of mutated heterozygous or homozygous gene copies per tumour cell, possibly increased by either polysomy24 36–38 or (mutant allele specific) amplification.39 40 If this biological phenomenon occurs, the fraction of tumour cells may in theory be slightly lower, but still lead to mutation detection. Therefore, clinical samples harbouring a tumour cell fraction at the detection limit of the technique may be used for mutation detection, but in this situation only a mutation-positive test result will be regarded as informative.
Generally, a deletion mutation is easier to detect than a point mutation. The present series contained only one point mutation sample (DNA08). Indeed, the Thr790Met mutation was detected by only three of the four laboratories that examined exon 20. It is possible that with mutation sequencing analysis a difference in analytical sensitivity may be present between deletion and point mutations, especially in cases where the tumour cell fraction is close to the detection limit.
For proficiency testing in molecular diagnostics (DNA-based ISH/mutation testing) in The Netherlands, a 75% consensus has been reached since 1998 for >95% of the samples (Schuuring E, Thunnissen E unpublished data). In order to achieve a high consensus (for example, US standard 80%), high-quality test samples are required. An interlaboratory survey of HER2 IHC in breast cancer revealed that 20% of the ‘challenges’ (samples) showed too much variation in staining to ‘be considered valid proficiency testing challenges’. A similar sample number of 25% with low consensus (<80%) was reported in another study for HER2,41 42 and a study for CD117.43 In fact these data underscore the higher variation present in IHC compared with ISH and mutation analyses.
IHC detection of EGFR expression did not lead to a consensus score in 13 of the 17 cases. This may be explained by: (a) the use of six different antibodies (see table 2), (b) different epitope retrieval approaches,44 (c) variations in signal enhancement, (d) use of automatic or manual staining, (e) a tissue handling procedure not exactly similar to the one used in house, or (f) variation in interpretation of stained slides. The first three explanations probably have the largest impact. For different antibodies the range of variation is large, with maximum difference of around 30–50% in the number of percentage positive cases.45–47 Although the epitope-binding site may differ between antibodies, the affinity of binding may be more important, as laboratories E and F had the highest values for IHC scores, while they were targeting different domains, and also using different antigen retrieval methods. Basically, IHC analysis is not quantitative, but can at best be considered a semiquantitative method with certain limits. In a model system on quantitative IHC it was shown that a difference in epitope concentration by a factor of only four was the range between minimum staining and maximum staining intensity.48 The linear part of the dynamic range of IHC staining is close to a factor of two to three. Moreover after binding of the primary antibody, signal enhancement systems lead to an amplification of four to nine times, which is the difference between a maximum and a negative IHC outcome. Alternative explanations are less likely, such as: (a) the scoring system—scoring was standardised and performed according to a method described previously,15 which is similar to the HER2/neu IHC scoring for breast cancer in the Netherlands49; (b) the tissue sample—it was fixed for all laboratories in the same manner; (c) the paraffin TMA block—it was cut at the same time, avoiding possible influences over time50; (d) depth levels—these vary only minimally: <400 μm for both ring studies, leaving minimal space for heterogeneity; (e) difference between biopsy and resection—this was not an issue in this study.47 The lack of consensus for scoring EGFR IHC has also been reported in head and neck squamous cell carcinoma and colorectal carcinoma,51 and consequently not used for the selection of patients that might benefit from EGFR-targeted therapy. In this type of ring study, it is not necessary to standardise methodology beforehand, as it may well be that the techniques used are different, but that they still lead to the same outcome, as was previously shown for a ring study on tissue identification14 and also for the outcome of amplification and mutation analysis of this study. Nevertheless, this study clearly shows that further standardisation is required for EGFR IHC and that it should not be used to select lung cancer patients for EGFR TKI therapy at present. It is not excluded that future IHC studies with EGFR mutation-specific antibodies may yield more reproducible results.52 53 Currently, EGFR IHC plays no role in selection for clinical treatment.
Conclusion
This study describes nationwide proficiency testing for EGFR and KRAS mutation analysis, EGFR expression, and EGFR gene amplification analysis. EGFR expression detected by IHC is not a suitable test for reliably selecting patients for anti-EGFR treatment. In contrast, molecular diagnostic methods for EGFR and KRAS mutation detection and EGFR ISH can be performed reliably in clinical pathology laboratories in The Netherlands.
Take-home messages
External quality assurance ring studies are useful to monitor molecular diagnostic tests performed in different pathology laboratories.
Epidermal growth factor receptor (EGFR) production measured by immunohistochemistry shows a high variation between laboratories, and, under the current circumstances, this prohibits its use as biomarker for treatment selection.
EGFR mutation and in-situ hybridisation analysis may reliably be performed on a routine basis, allowing wider use of EGFR as a biomarker in lung cancer.
Acknowledgments
The help of H van Diermen van den Berg with preparation of tissue microarray, and I Stuij (SKKP/SKML) for organisation of samples and answer distribution, is greatly appreciated.
References
Footnotes
Competing interests None.
Ethics approval Ethics approval was obtained.
Provenance and peer review Not commissioned; externally peer reviewed.